
Abbreviation (ISO4): Chinese Journal of Alzheimer's Disease and Related Disorders
Editor in chief: Jun WANG
Chinese Journal of Alzheimer's Disease and Related Disorders >
Quantitative analysis of low-frequency electroencephalogram in Alzheimer’s disease
Received date: 2020-05-23
Revised date: 2020-07-05
Online published: 2020-09-25
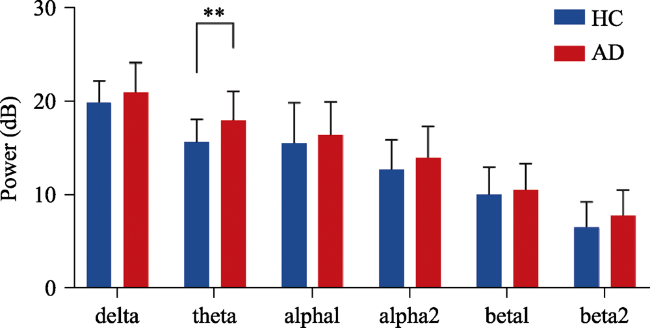
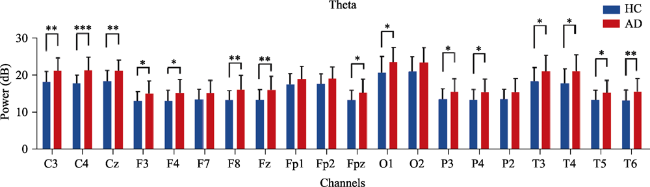
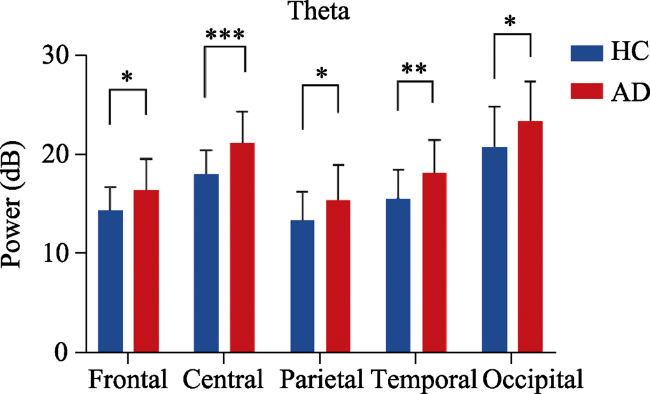
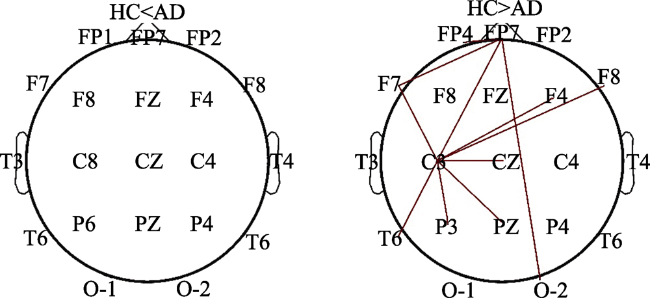
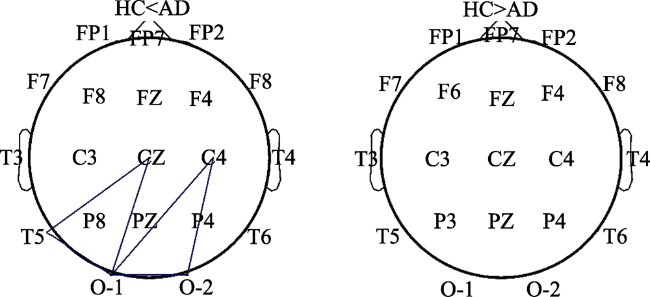
Objective: To explore the application value of quantitative EEG analysis in Alzheimer ’s disease (AD).Methods: We included 26 AD patients and 26 elderly people with normal cognitive function. The 20 scalp electrodes resting state electroencephalogram (EEG) was used to detect the brain waveform of the subjects. The power spectrum density of each band and the weighted phase lag index (wPLI) were used to analyze the differences in EEG changes among the groups. Results: In the AD group, the power spectrum density of θ band was significantly higher than that of the control group. In addition, the difference in functional connection between the two groups mainly exists in the δ and θ of the low frequency band. The phase synchronization of AD patients in the δ band is reduced, while the phase synchronization of AD patients in θ band is significantly stronger than that of the control group. Conclusion: Quantitative EEG analysis shows that the brain frequency of Alzheimer’s disease patients is slowed and the function connectivity is disconnected.
Key words: Alzheimer’s disease; EEG; Power spectrum density; Weighted phase lag index
YAN Yi , ZHAO Aonan , QIU Yinghui , XU Wei , DENG Yulei . Quantitative analysis of low-frequency electroencephalogram in Alzheimer’s disease[J]. Chinese Journal of Alzheimer's Disease and Related Disorders, 2020 , 3(3) : 215 -220 . DOI: 10.3969/j.issn.2096-5516.2020.03.010
表1 两组受试者的人口学资料 |
| HC组(n=26) | AD组(n=26) | P值 | |
|---|---|---|---|
| 女性,N(%) | 17 (65.38%) | 18 (69.23%) | 0.768 |
| 年龄,年 (均数±标准差) | 67.92±7.17 | 69.42±8.82 | 0.144 |
| 病程 | - | 3.56±2.66 | - |
| MMSE分数 | 29.62±0.64 | 14.19±5.27 | <0.001 |
| MoCA分数 | 28.85±0.97 | 11.00±5.23 | <0.001 |
注释:粗体代表有统计学差异。 |
表2 θ频段内功率值与神经心理学评估的相关性分析 |
| θ频段 | MMSE | MoCA | ||
|---|---|---|---|---|
| r | P | r | P | |
| 全脑平均功率 | -0.263 | 0.065 | -0.343 | 0.015 |
| 中央区平均功率 | -0.359 | 0.01 | -0.436 | 0.002 |
| 额区平均功率 | -0.218 | 0.128 | -0.289 | 0.042 |
| 枕区平均功率 | -0.233 | 0.103 | -0.296 | 0.037 |
| 顶区平均功率 | -0.175 | 0.225 | -0.251 | 0.078 |
| 颞区平均功率 | -0.263 | 0.065 | -0.348 | 0.013 |
注释:粗体代表有统计学差异。 |
| [1] |
|
| [2] |
孙云闯, 金海强, 孙永安, 等. 脑脊液相关标志物检测在阿尔茨海默病痴呆诊断中的应用[J]. 中国神经精神疾病杂志, 2018, 44 (12): 722-726.
|
| [3] |
|
| [4] |
|
| [5] |
|
| [6] |
|
| [7] |
|
| [8] |
|
| [9] |
|
| [10] |
贺永, 阿尔茨海默病的神经影像学研究进展[J]. 生物化学与生物物理进展, 2012, 39(8): 811-815.
|
| [11] |
|
| [12] |
|
| [13] |
|
| [14] |
|
| [15] |
龙霞, 李小凤, 定量脑电图在阿尔茨海默病中的临床应用研究进展[J]. 现代医药卫生, 2019, 35(5): 695-698.
|
| [16] |
|
| [17] |
|
| [18] |
|
| [19] |
|
| [20] |
|
| [21] |
|
| [22] |
|
| [23] |
|
| [24] |
|
| [25] |
|
| [26] |
|
| [27] |
|
| [28] |
|
| [29] |
|
| [30] |
|
| [31] |
|
| [32] |
|
| [33] |
|
| [34] |
|
| [35] |
|
| [36] |
|
/
| 〈 |
|
〉 |