
Elastic parameters waveform inversion method of the second-order time integral wavefield for marine pure P-wave data
Received date: 2024-05-07
Online published: 2025-05-09
Copyright
In marine exploration, when the seismic data in the exploration area only includes P-wave data collected by hydrophones, traditional acoustic full waveform inversion velocity modeling methods cannot invert S-wave velocity information. This paper focuses on ocean fluid-solid coupled media and derives the acoustic-elastic coupled equations using the boundary coupled method of acoustic-elastic wave equations. We validated the potential of using P-wave data for shear wave modeling through numerical simulation results of a three-layer model. An inaccurate velocity model can lead to the failure of full waveform inversion. To address the dependency issue of velocity model in full waveform inversion, we introduce second-order time integration operation and construct a second-order integration objective function. Then, the second-order integral waveform inversion gradient operators suitable for the acoustic-elastic coupled equations were derived, and a P-and S-wave velocity waveform inversion approach based on pure P-wave data in a marine environment was established. Finally, we conduct inversion tests using modified Marmousi2 models of the horizontal and irregular seabed. The inversion results verified the applicability and accuracy of the second-order integrated wave field acoustic-elastic coupled equation inversion method.
WenBo SUN , HongLiang ZHANG , JianHua WANG , GuoChen WU , TieZhao BAO , JiCai DING . Elastic parameters waveform inversion method of the second-order time integral wavefield for marine pure P-wave data[J]. Progress in Geophysics, 2025 , 40(2) : 774 -786 . DOI: 10.6038/pg2025HH0540
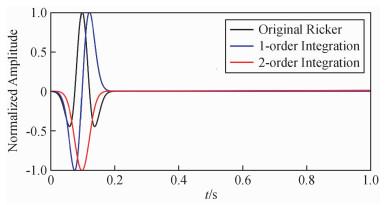
图1 Ricker子波及其时间积分(主频为10 Hz)黑线为Ricker子波;蓝线为Ricker子波的时间一阶积分;红线为Ricker子波的时间二阶积分. Fig 1 Ricker wavelet with a dominant frequency of 10 Hz and its time integral The black line represents the Ricker wavelet, the blue line denotes the first-order time integral of Ricker wavelet and the red line denotes the second-order time integral of the Ricker wavelet. |
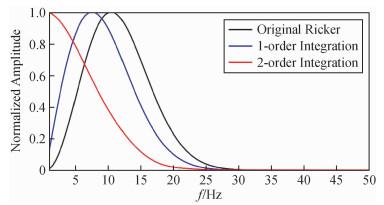
图2 Ricker子波及其时间积分的频谱(主频为10 Hz)黑线为Ricker子波的频谱;蓝线为Ricker子波时间一阶积分的频谱;红线为Ricker子波时间二阶积分的频谱. Fig 2 The frequency spectrum of a Ricker wavelet with a dominant frequency of 10 Hz and its time integral The black line represents the spectrum of the Ricker wavelet, the blue line denotes the spectrum of first-order time integral of ricker wavelet, the red line denotes the spectrum of second-order time integral of ricker wavelet. |
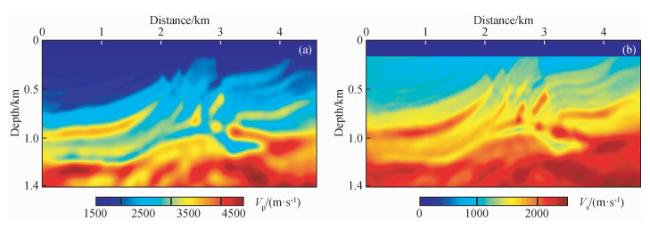
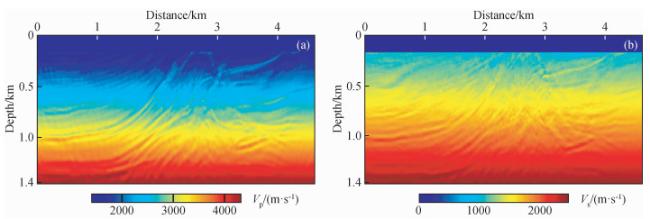
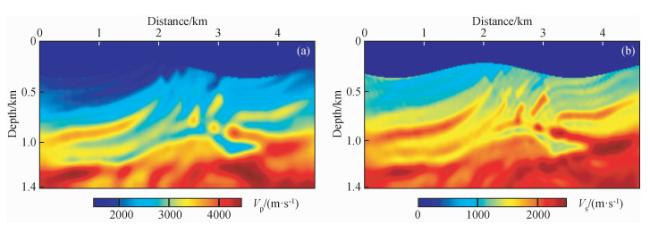
图7 时间二阶积分波场全波形反演结果(a)反演纵波速度;(b)反演横波速度. Fig 7 The inversion results by full waveform inversion of the second-order time integral wavefield (a) Inverted S-wave velocity; (b) Inverted S-wave velocity. |
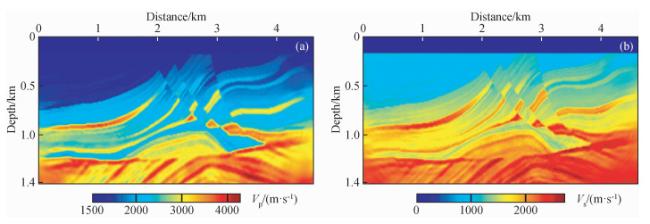
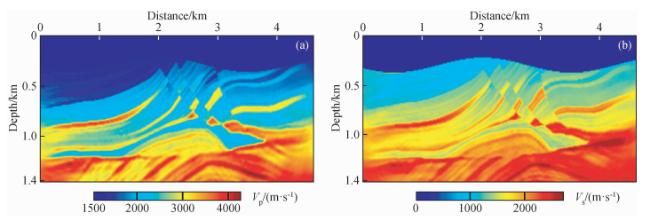
图8 时间二阶积分波场+全波形反演(IntI2+FWI)结果(a)反演纵波速度;(b)反演横波速度. Fig 8 The second-order time integral wavefield+full waveform inversion (IntI2+FWI) results (a) Inverted P-wave velocity; (b) Inverted S-wave velocity. |
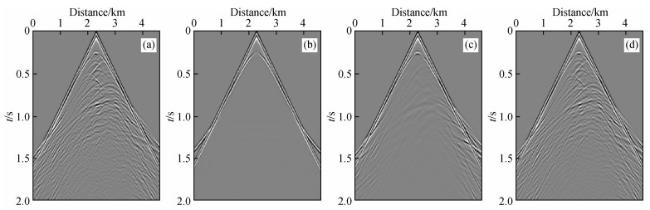
图9 地震记录(a)观测记录;(b)初始模型模拟记录;(c)积分波场反演记录;(d)积分波场+全波形反演记录. Fig 9 Seismic records (a) Observed data; (b) Record calculated using initial model; (c) Record calculated using integral wavefield; (d) Record calculated final inverted model. |
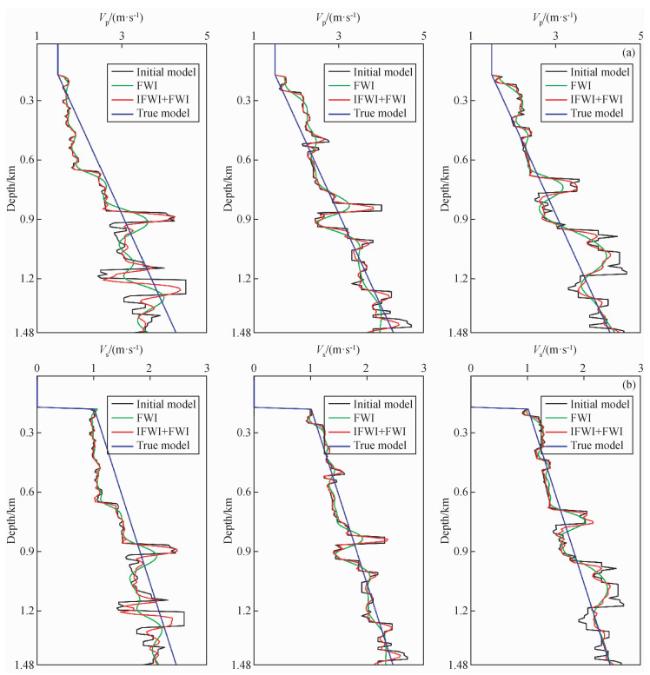
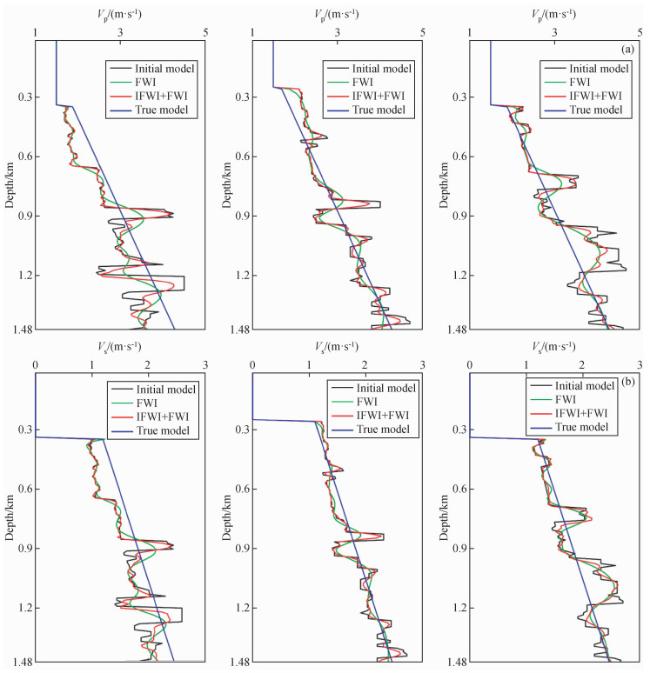
图11 第1500 m、2450 m、4000 m道(左,中,右)的两种反演结果的(a)深度-纵波速度和(b)深度-横波速度曲线对比图中黑线为真实速度,绿线为初始速度,蓝线为常规全波形反演结果,红线为时间二阶积分+全波形反演的结果. Fig 11 Comparison of (a) depth-P-wave velocity and (b) depth-S-wave velocity curves for two inversion results at traces of 1500 m, 2450 m, and 4000 m (left, middle, right) The black line in the figure represents the true velocity, the green line represents the initial velocity, the blue line represents the conventional full waveform inversion result, and the red line represents the time second-order integration+full waveform inversion result. |
图14 时间二阶积分波场全波形反演结果(a)反演纵波速度;(b)反演横波速度. Fig 14 The inversion results by full waveform inversion of the second-order time integral wavefield (a) Inverted S-wave velocity; (b) Inverted S-wave velocity. |
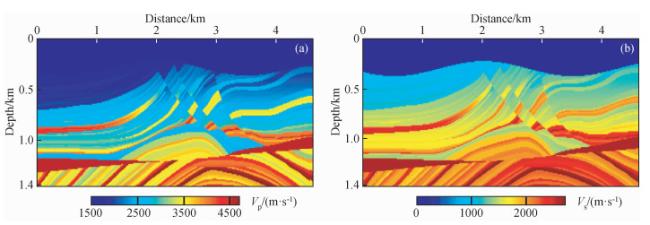
图16 第1500 m、2450 m、4000 m道(左,中,右)的起伏海底界面反演结果的(a)深度-纵波速度和(b)深度-横波速度曲线对比图中黑线为真实速度,绿线为初始速度,蓝线为常规全波形反演结果,红线为时间二阶积分+全波形反演的结果. Fig 16 Comparison of the irregular seabed interface inversion results for the 1500 m, 2450 m, and 4000 m traces (left, middle, right) in terms of (a) depth-P-wave velocity, and (b) depth-S-wave velocity curves The black line in the figure represents the true velocity, the green line represents the initial velocity, the blue line represents the conventional full waveform inversion result, and the red line represents the time second-order integration+full waveform inversion result. |
感谢评审专家提出的宝贵意见.
|
|
|
|
|
|
|
Donno D, Chauris H, Calandra H. 2013. Estimating the background velocity model with the normalized integration method. //75th EAGE Conference & Exhibition Incorporating SPE EUROPEC 2013. London: EAGE, cp-348-00956, doi: 10.3997/2214-4609.20130411.
|
|
|
|
|
|
Jiang L L. 2010. Body-fitted grid generation for the geological conditions [Ph. D. thesis](in Chinese). Changchun: Jilin University.
|
|
|
|
|
|
|
|
|
|
|
|
|
|
|
|
|
|
|
|
|
|
|
|
|
|
|
|
|
|
|
|
|
|
|
|
Wu J, Wu G. 2017. Full waveform inversion in acoustic-elastic coupled media based on the finite-difference method. //79th EAGE Conference and Exhibition 2017. Paris: EAGE, 1-5, doi: 10.3997/2214-4609.201700796.
|
|
|
|
|
|
|
|
Xu S, Wang D, Chen F, et al. 2012. Full waveform inversion for reflected seismic data. //74th EAGE Conference and Exhibition Incorporating EUROPEC 2012. Copenhagen: EAGE, cp-293-00729, doi: 10.3997/2214-4609.20148725.
|
|
Yang S, Wu G C, Shan J Z, et al. 2023. Simulation of seismic waves in the fluid-solid coupled thermoelastic medium. //3rd International Meeting for Applied Geoscience & Energy Expanded Abstracts. Houston: Society of Exploration Geophysicists, doi: 10.1190/image2023-3911405.1.
|
|
|
|
Zhang B, Wu G, Shan J, et al. 2023. Simulation of a wavefield in VTI media adopting an acoustic-elastic coupled equation. //84th EAGE Annual Conference & Exhibition. Vienna: EAGE, 1-5, doi: 10.3997/2214-4609.202310913.
|
|
|
|
|
|
蒋丽丽. 2010. 面向地质条件的贴体网格生成技术[博士论文]. 长春: 吉林大学.
|
|
|
|
|
|
|
|
|
/
| 〈 |
|
〉 |