
Abbreviation (ISO4): Chinese Journal of Alzheimer's Disease and Related Disorders
Editor in chief: Jun WANG
Chinese Journal of Alzheimer's Disease and Related Disorders >
Quantifying Extrapyramidal Iron Deposition in Patients with Alzheimer's disease using Quantitative Susceptibility Mapping
Received date: 2021-05-13
Revised date: 2021-06-28
Online published: 2021-09-25
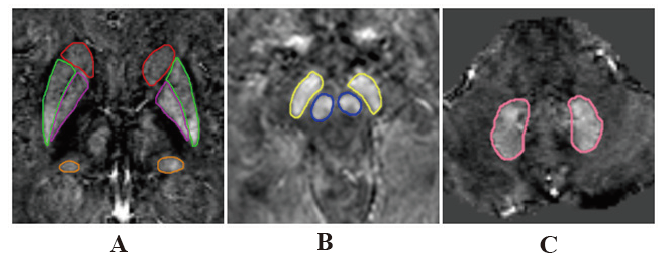
Objective: To quantitative the iron deposition of extrapyramidal nuclei in patients with Alzheimer's disease (AD) by quantitative susceptibility mapping(QSM) and to analyze the correlation between magnetic sensitivity values(MSV) and clinical laboratory indicators and cognitive scores. Methods: Fifty-nine patients with AD (AD group) and 22 aged volunteers without cognitive impairment (CON group) underwent routine MRI and ESWAN examination. SPIN software was used for image post-processing. MSV of bilateral head of caudate nucleus(HCN), globus pallidus(GP), putamen(PUT), thalamus(THA), red nucleus(RN), substantia nigra(SN) and dentate nucleus(DN) were measured respectively, and correlation analysis was conducted with cognitive scores and general data. The area under ROC curve was used to evaluate the effectiveness of MSV values in diagnosing AD. Results: The MSV of all nuclei in AD group were higher than CON group, and there were significant differences in bilateral HCN, bilateral GP, bilateral THA, right RN, right SNand left DN (P< 0.05). The MSV of bilateral HCN and bilateral PUT had a significant negative correlation with the MMSE score. There was a significant negative correlation between the MSV of bilateral HCN, bilateral PUT and MoCA scores. The MSV of bilateral HCN, bilateral PUT had a significant negative correlation with CDT scores (all P< 0.05). The MSV of right GP was positively correlated with the course of the disease; The MSV of bilateral THA were inversely related to triglyceride content(all P< 0.05). ROC analysis showed that MSV of the left GP had the largest AUC. Conclusion: Increasing iron deposition of extrapyramidal nuclei in AD patients may affect cognitive status.

DONG Jun-yi , LIU Yang-ying-qiu , GAO Bing-bing , TIAN Shi-yun , SONG Qing-wei , MIAO Yan-wei . Quantifying Extrapyramidal Iron Deposition in Patients with Alzheimer's disease using Quantitative Susceptibility Mapping[J]. Chinese Journal of Alzheimer's Disease and Related Disorders, 2021 , 4(3) : 231 -236 . DOI: 10.3969/j.issn.2096-5516.2021.03.012
表1 MRI扫描参数Tab. 1 MR scanning parameters |
| 名称 | TR(ms) | TE(ms) | 层厚(mm) | 层间距(mm) | FOV(cm×cm) | 矩阵 | 翻转角(°) | 带宽(kHz) |
|---|---|---|---|---|---|---|---|---|
| T1WI | 2500 | 25 | 6 | 1 | 22×19.8 | 320×256 | / | 31.25 |
| T2WI | 5000 | 118 | 6 | 1 | 22×19.8 | 320×256 | / | 31.25 |
| T2 Flair | 9000 | 172 | 6 | 1 | 22×22 | 256×192 | / | 31.25 |
| ESWAN | 36 | 3.6;7.8;11.9;16.1; 20.3;24.4;28.6;32.8 | 1 | 0 | 24×24 | 256×256 | 20 | 31.25 |
图2 AD组及CON组各核团的MSV值比较。标★者为两组间差异具有统计学意义(P<0.05)。Fig.2 Comparison of MSV values of nuclei in AD and CON groups. Marked with "★" means difference between the two groups was statistically significant (P < 0.05). |
表2 AD组与CON组各脑灰质核团MSV值比较(x±s)Tab. 2 Comparison of MSV values of gray matter nuclei in AD and CON group(x±s) |
| 部位 | AD组 | HC组 | P值 |
|---|---|---|---|
| Left-HCN | 87.95±18.14 | 79.28±15.86 | 0.013① |
| Right-HCN | 92.22±25.06 | 77.61±20.75 | 0.018① |
| Left-GP | 142.85±44.28 | 119.72±27.06 | 0.036① |
| Right-GP | 148.19±40.73 | 125.00±28.07 | 0.011① |
| Left-PUT | 93.93±29.16 | 89.39±23.91 | 0.420 |
| Right-PUT | 100.02±28.46 | 91.97±21.45 | 0.531 |
| Left-THA | 42.42±18.94 | 34.29±8.33 | 0.033① |
| Right-THA | 52.63±22.97 | 39.47±9.91 | 0.019① |
| Left-RN | 98.34±31.95 | 83.32±14.85 | 0.071 |
| Right-RN | 101.44±33.63 | 85.36±20.18 | 0.035① |
| Left-SN | 139.11±34.86 | 128.50±32.09 | 0.167 |
| Right-SN | 138.66±36.76 | 119.81±27.86 | 0.035① |
| Left-DN | 103.02±31.77 | 88.21±26.45 | 0.039① |
| Right-DN | 103.82±35.80 | 88.58±31.65 | 0.085 |
Note: Marked with “①” were statistically significant (P < 0.05). |
图3 A为AD组各脑灰质核团MSV值与MMSE评分间相关性分析热点图;B为AD组各脑灰质核团MSV值与MoCA评分间相关性分析热点图;C为AD组各脑灰质核团MSV值与CDT评分间相关性分析热点图;D为AD组各核团MSV值与各一般资料相关性分析热点图。标“*”者为两者存在相关性。Fig.3 A shows the hot spot of correlation analysis between MSV values of gray matter nuclei and MMSE score in AD group. B: The hot spot diagram of correlation analysis between MSV values of gray matter nuclei and MoCA score in AD group; C: The hot spot diagram of correlation analysis between MSV values of gray matter nuclei and CDT score in AD group; D: The hotspot diagram of correlation analysis between MSV values of each nucleus in AD group and general data. Those marked with "*" indicate correlation between the two. |
| [1] |
|
| [2] |
|
| [3] |
|
| [4] |
|
| [5] |
|
| [6] |
|
| [7] |
|
| [8] |
|
| [9] |
|
| [10] |
|
| [11] |
|
| [12] |
|
| [13] |
|
| [14] |
|
| [15] |
|
| [16] |
|
| [17] |
|
| [18] |
|
| [19] |
|
| [20] |
|
| [21] |
|
| [22] |
|
| [23] |
|
| [24] |
|
| [25] |
|
| [26] |
|
| [27] |
|
| [28] |
|
| [29] |
|
/
| 〈 |
|
〉 |