
Abbreviation (ISO4): Chinese Journal of Alzheimer's Disease and Related Disorders
Editor in chief: Jun WANG
Chinese Journal of Alzheimer's Disease and Related Disorders >
Analysis of changes in gut microbiota of 5XFAD transgenic mice
Received date: 2021-05-13
Revised date: 2021-06-12
Online published: 2021-09-25
Objective: To explore the gut microbiota changes of 5XFAD transgenic mice of Alzheimer's disease (AD) model compared with wild-type (WT) mice and the impacts of gender difference. Methods: The feces of different gender 5XFAD and WT mice were collected, and the bacterial 16S rRNA of fecal genomic DNA was amplified by PCR and sequenced by using high-throughput sequencing methods. Then, the differential and functional analysis of the sequencing data are carried out through nf-core and the bioinformation analysis method based on the R language platform. Results: In the composition analysis, compared to WT mice, 5XFAD transgenic mice had lower abundance of Epsilonbacteraeota and Proteobacteria at the phylum level. At genus level, 5XFAD transgenic mice had higher abundance of Alistipes and Lactobacillus and lower abundance of Helicobacter. In the functional analysis, compared to WT mice, 5XFAD transgenic mice had influenced different metabolism pathways. Besides, the composition and function of microbiota was different in a gender specific manner. Conclusion: The gut microbiota of 5XFAD transgenic mice is different from that of WT mice, and the difference is affected by gender.

Key words: gut microbiota; 16S rRNA high-throughput sequencing; 5XFAD
LUO Zhi-yu , CHU Xing-kun , CHANG Shuai-shuai , FENG Yuan , YANG Da-bing , WANG Xin-yi , DU Xiao-guang , FENG Teng , ZHANG Jing . Analysis of changes in gut microbiota of 5XFAD transgenic mice[J]. Chinese Journal of Alzheimer's Disease and Related Disorders, 2021 , 4(3) : 179 -184 . DOI: 10.3969/j.issn.2096-5516.2021.03.002
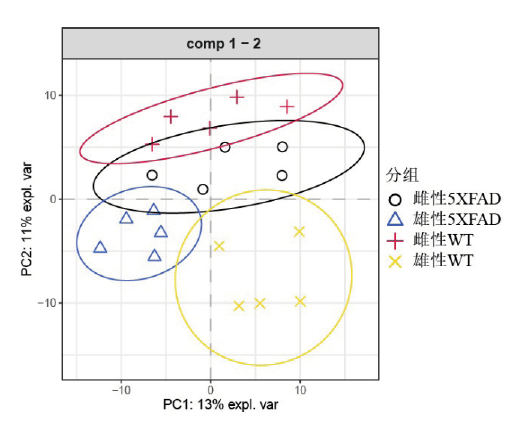
图1 5XFAD和WT小鼠的菌群PCA分析。黑色和蓝色标识分别为5XFAD小鼠的雌雄体,红色和黄色标识分别为WT小鼠的雌雄体;PC1提示第一方向可解释方差为13%,而PC2提示第一方向可解释方差为11%。Fig. 1 PCA analysis of the gut microbiota in the 5XFAD and WT mice. The black and blue lines respectively represent the females and males in the 5XFAD mice, and the red and yellow lines respectively represent the females and males in the WT mice. PC1 indicates that the explanatory variance in the first direction is 13%, and PC2 indicates that the explanatory variance in the first direction is 11%. |
图2 5XFAD和WT小鼠在门(A)和属(B)水平上的相对丰度。X轴为WT和5XFAD雌雄四组小鼠,Y轴为菌群在该组样本中的比例,每个条目不同颜色代表不同的菌群,不同颜色条目的长度代表菌群中的比重。Fig. 2 The relative abundance of gut microbiota in 5XFAD and WT mice at the phylum (A) and genus (B) levels. The X-axis indicates the four groups of mice: male WT and 5XFAD, female WT and 5XFAD. The Y-axis indicates the proportion of specific gut microbiota in the assigned group. The different colors of each band represent a different gut microbiota, and the length of the different color strip represents the proportion of the gut microbiota. |
图3 5XFAD和WT小鼠的差异Lefse分析。图中不同颜色代表不同分组的小鼠,X轴代表LDA(Log)值,Y轴代表不同菌群的ASV水平,同时显示该水平在科和属水平的注释。Fig. 3 Lefse analysis of the gut microbiota difference between 5XFAD and WT mice. The different colors in the figure represent mice in different groups. The X-axis indicates the LDA (Log) value. The Y-axis indicates the ASV level of different gut microbiota and shows the annotation of gut microbiota at the family and genus level. |
图4 5XFAD和WT小鼠的性别差异Lefse分析。图中不同颜色代表不同分组的小鼠,X轴代表LDA(Log)值,Y轴代表不同菌群的ASV水平,同时显示该水平在科和属水平的注释。Fig. 4 Lefse analysis of the gut microbiota difference of different gender between 5XFAD and WT mice. The different colors in the figure represent mice in different groups. The X-axis indicates the LDA (Log) value. The Y-axis indicates the ASV level of different gut microbiota and shows the annotation of gut microbiota at the family and genus level. |
图5 5XFAD中雌雄差异的菌群和WT中雌雄差异菌群的维恩图。Fig. 5 Venn diagram that shows the number of different gut microbiota in different gender 5XFAD and WT mice. |
图6 肠道菌群功能分析。横坐标为每个通路百分比数值的平均值,纵坐标为Picrust2根据扩增子数据推断微生物群的功能注释;利用wilcox检测得到不同两组间差异通路(*:P<0.05, **:P<0.01)。Fig. 6 Function analysis of gut microbiota. The X-axis indicates the average percentage value of each pathway. The Y-axis indicates the functional annotation of gut microbial community based on the amplicon data by Picrust2. The different pathways between the two groups were obtained by wilcox analysis (*:P<0.05, **:P<0.01). |
| [1] |
|
| [2] |
|
| [3] |
|
| [4] |
|
| [5] |
|
| [6] |
|
| [7] |
|
| [8] |
|
| [9] |
|
| [10] |
|
| [11] |
|
| [12] |
|
| [13] |
|
| [14] |
|
| [15] |
|
| [16] |
|
| [17] |
|
| [18] |
|
| [19] |
|
| [20] |
|
| [21] |
|
| [22] |
|
| [23] |
|
| [24] |
|
| [25] |
|
| [26] |
|
/
| 〈 |
|
〉 |