Analysis of urban and rural residents'willingness to pay for green electricity and its influencing factors
Received date: 2026-03-18
Revised date: 2026-07-24
Online published: 2026-09-03
Supported by
Youth Program of National Social Science Foundation of China(No.22CJY064),Social Science Achievement Review Committee Program of Hunan Province (No.XSP22YBZ071),Key Program of the"14th Five-Year" Plan for Educational Science of Hunan Province(ND 229710)
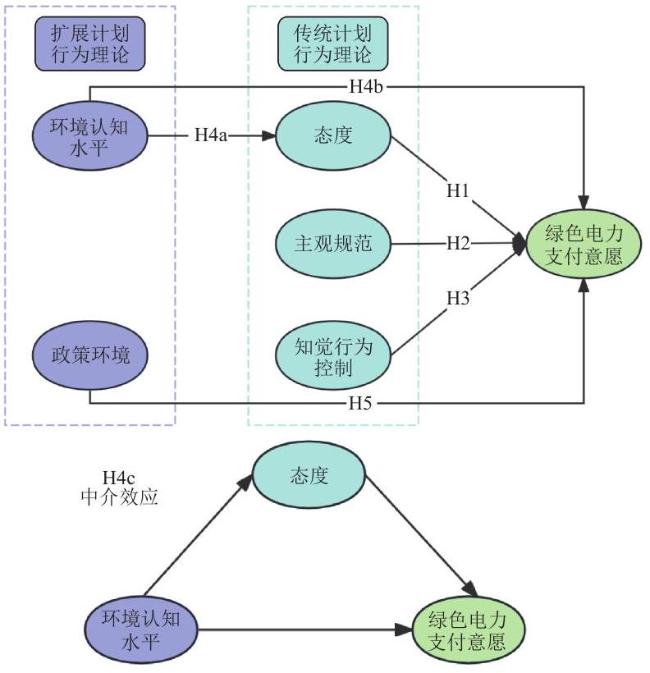
Stimulating green electricity consumption is a key measure for promoting the efficient integration and utilization of renewable energy and plays a vital role in reducing carbon emissions in the energy sector and supporting the green and low-carbon transition of the energy sector.However,the key factors influencing urban and rural residents'willingness to pay for green electricity and the mechanisms underlying this willingness remain unclear,and the design of relevant incentive policies lacks a clear basis.This study utilizes survey data from 1417 urban and rural residents in the Dongting Lake Ecological Economic Zone.By comprehensively applying the double-bounded dichotomous choice contingent valuation method (DBDC-CVM),structural equation modeling(SEM),and fuzzy set qualitative comparative analysis(fsQCA),the study empirically analyzes the level of willingness to pay for green electricity among urban and rural residents,as well as its influencing factors and configuration pathways.The results indicate that:(1)the willingness to pay for green electricity among urban and rural residents is 18.20 yuan per month,a conclusion that remains valid after robustness testing. (2)Attitude,subjective norms,perceived behavioral control, level of environmental awareness,and policy environment all have significant positive effects on willingness to pay,with perceived behavioral control and subjective norms exerting stronger influences,while the effect of level of environmental awareness is relatively weaker.Tests of mediating effects further indicate that attitude mediates the relationship between level of environmental awareness and willingness to pay. (3)Configurational analysis reveals that perceived behavioral control is the core condition driving high willingness to pay.A relationship of both substitution and synergy exists between subjective norms and the policy environment,with the most significant driving effect observed when the two act synergistically.Based on these findings,it is recommended to strengthen the synergistic driving force of subjective norms and the policy environment,optimize the subscription process,and implement differentiated measures to effectively stimulate urban and rural residents'willingness to pay for green electricity.
Jiao HE , Yuqi NIE , Ze YE , Yongfei WU . Analysis of urban and rural residents'willingness to pay for green electricity and its influencing factors[J]. Electric Power, 2026 , 59(8) : 179 -193 . DOI: 10.11930/j.issn.1004-9649.202603048
表1 城乡居民对绿色电力的支付方案Table 1 Green electricity payment schemes for urban and rural residents |
| 支付方案 | 初始投标值/ (元•月 -1 ) | 第2次投标高值/ (元 ⋅ 月 -1 ) | 第2次投标低值/ (元•月 -1 ) |
|---|---|---|---|
| 1 | 10 | 20 | 5.0 |
| 2 | 20 | 40 | 10.0 |
| 3 | 30 | 60 | 15.0 |
| 4 | 40 | 80 | 20.0 |
| 5 | 50 | 100 | 25.0 |
| 6 | 75 | 150 | 37.5 |
| 7 | 100 | 200 | 50.0 |
| 8 | 125 | 250 | 62.5 |
| 9 | 150 | 300 | 75.0 |
| 10 | 175 | 350 | 87.5 |
| 11 | 200 | 400 | 100.0 |
表2 城乡居民社会经济特征描述性统计Table 2 Descriptive statistics of socio-economic charac-teristics of urban and rural residents |
| 项目 | 选项 | 频数 | 百分比/% | 项目 | 选项 | 频数 | 百分比/% |
|---|---|---|---|---|---|---|---|
| 性别 | 男 | 758 | 53.49 | 房屋 | 城镇租住房屋城镇自有住房 | 198 | 13.97 |
| 女 | 659 | 46.51 | |||||
| 18∼25 岁 | 200 | 14.11 | 137 | 9.67 | |||
| 26~35岁 | 437 | 30.84 | 205 | 14.47 | |||
| 468 | 33.03 | 小于4000元 4001~8000元 4001~8000元 | 174 | 12.28 | |||
| 46~55岁 | 220 | 15.53 | 544 | 38.39 | |||
| 56~65岁 | 84 | 5.93 | 8001~12000元 8001~12000元 12001~16000元 12001~16000元 | 440 | 31.05 | ||
| 66岁及以上 | 8 | 0.56 | 177 | 12.49 | |||
| 高中及以下 | 212 | 14.96 | 82 | 5.79 | |||
| 306 | 21.59 | 常住 | 1~2人 | 173 | 12.21 | ||
| 本科研究生及以上 | 711 | 3人 | 554 | 39.10 | |||
| 188 | 13.27 | 4人 5人及以上 5人及以上 | 504 | 35.57 | |||
| 63 | 4.45 | 186 | 13.12 | ||||
| 科研设计单位 科研设计单位高等教育单位高等教育单位中初教育单位中初教育单位 | 54 | 3.81 | 小于 30 m2 31~60 m 2 | 21 | 1.48 | ||
| 医疗卫生单位其他事业单位 | 214 | 102 | 7.20 | ||||
| 189 | 13.34 | 61∼100 m2 | 393 | 27.73 | |||
| 101∼150 m2 | 676 | 47.71 | |||||
| 其他事业单位 | 208 | 14.68 | 151∼200 m2 | 170 | 12.00 | ||
| 个体工商户 | 226 | 15.95 | 大于 200 m2 | 55 | 3.88 | ||
| 国有企业 | 88 | 6.21 | 56 | 3.95 | |||
| 其他 | 255 | 17.99 | 245 | 17.29 | |||
| 368 | 25.97 | 101~150元 101~150元 101~150元 151~200元 | 483 | 34.09 | |||
| 174 | 12.28 | 151~200元 | 315 | 22.23 | |||
| 常德市荆州市 | 217 | 15.31 | |||||
| 荆州市 | 89 | 6.28 | |||||
| 长沙市望城区 | 569 | 40.16 |
表3 支付方案和选择形式分布Table 3 Distribution of payment schemes and choice formats |
| 支付方案 | 频数(比例/%) | ||||
|---|---|---|---|---|---|
| 是-是 | 是-否 | 否-是 | 否-否 | 合计 | |
| 1 (10,20,5) | 84 (65.12) | 20 (15.50) | 6 (4.65) | 19 (14.73 ) | 129 |
| 2 (20,40,10) | 91 (71.09) | 11 (8.59 ) | 6 (4.69) | 20 (15.63) | 128 |
| 3 (30,60,15) | 71 (55.47) | 27 (21.09) | 12 (9.38) | 18 (14.06 ) | 128 |
| 4 (40,80,20) | 81 (60.45) | 21 (15.67) | 8 (5.97 ) | 24 (17.91 ) | 134 |
| 5 (50,100,25) | 63 (48.84) | 28 (21.70) | 9 (6.98 ) | 29 (22.48) | 129 |
| 6 (75,150,37.5) | 60 (46.88) | 27 (21.09) | 17 (13.28) | 24 (18.75 ) | 128 |
| 7 (100,200,50) | 57 (44.53 ) | 28 (21.87) | 13 (10.16) | 30 (23.44 ) | 128 |
| 8 (125,250,62.5) | 51 (39.54 ) | 24 (18.60) | 12 (9.30) | 42 (32.56 ) | 129 |
| 9 (150,300,75) | 58 (44.28) | 22 (16.79) | 17 (12.98 ) | 34 (25.95) | 131 |
| 10 (175,350,87.5) | 44 (34.65 ) | 31 (24.41) | 18 (14.17) | 34 (26.77) | 127 |
| 11(200,400,100) | 52 (41.27) | 18 (14.28 ) | 16 (12.70 ) | 40 (31.75 ) | 126 |
表4 变量定义与解释Table 4 Variable definitions and descriptions |
| 变量 | 变量含义 | 赋值方法 |
|---|---|---|
| T | 投标值 | 问卷中的初始投标值(见表1) |
| A | 年龄 | 1:18~25岁;2:26~35岁;3:36~45岁;4:46~ 55 岁;5:56~65岁;6:66岁及以上 |
| E | 受教育程度 | 1:高中及以下;2:大专;3:本科;4:研究生及以上 1:机关;2:科研设计单位;3:高等教育单位;4:中初教育单位;5:医疗卫生单位; |
| J | 职业 | 6:其他事业单位;7:个体工商户;8:国有企业;9:其他 1:岳阳市;2:益阳市;3:常德市;4:荆州 |
| C | 居住地区 | 市;5:长沙市望城区 1:城镇租住房屋;2:城镇自有住房;3:农村租住房屋;4:农村自有住房 |
| I | 月收入水平 | 1:小于4000元;2:4001~8000元;3:8001~ 12000 元;4:12001~16000元;5:大于 16000 元 |
| Tp | 常住人口数 | 1:1~2人;2:3人;3:4人;4:5人及以上 1:小于 |
| Ar | 住房面积 | 4: |
| E1 | 电费支出 | 4:151~200元;5:200元以上 |
表5 二元 Logit 回归模型Table 5 Binary Logit regression model results |
| 变量 | B | 标准误差 | 平均值 | Wald | 显著性 |
|---|---|---|---|---|---|
| 投标值 | -0.134*** | 0.023 | 34.929 | <0.001 | |
| 年龄 | -0.186** | 0.064 | 2.700 | 8.416 | 0.004 |
| 受教育程度 | 0.247** | 0.093 | 2.618 | 7.058 | 0.008 |
| 居住城市 | 0.481*** | 0.047 | 3.224 | 103.973 | <0.001 |
| 月收入水平 | 0.342*** | 0.081 | 2.611 | 17.589 | <0.001 |
| 常住人口数 | 0.269** | 0.088 | 2.496 | 9.258 | 0.002 |
| 常数 | -0.902 | 0.578 | 2.433 | 0.119 |
表6 分城乡二元 Logit 回归结果Table 6 Results of the urban-rural binary Logit regression |
| 变量 | 全样本 | 城镇居民 | 农村居民 | 剔除省会城市 |
|---|---|---|---|---|
| 投标值 | -0.134*** | -0.217*** | -0.244*** | -0.139*** |
| 年龄 | -0.186** | -0.454* | -0.269** | -0.254*** |
| 受教育程度 | 0.247** | 0.731** | 0.590*** | 0.233** |
| 居住城市 | 0.481*** | 0.604*** | 0.803*** | 0.208** |
| 月收入水平 | 0.342*** | 0.410* | 1.001*** | 0.407*** |
| 常住人口数 | 0.269** | 0.963*** | 0.643*** | 0.277** |
| 常数 | -0.902 | -1.131 | -3.817 | -0.413 |
表7 信度和效度检验结果Table 7 Results of reliability and validity tests |
| 路径关系 | 标准载荷系数 | Cronbach's α | RC | EAV |
|---|---|---|---|---|
| TD1→态度 | 0.793 | 0.810 | 0.811 | 0.588 0.588 |
| TD2→态度 | 0.774 | |||
| TD3→态度 | 0.733 | |||
| ZG1→主观规范 | 0.776 | 0.800 | 0.800 | 0.572 |
| ZG2→主观规范 | 0.751 | |||
| ZG3→主观规范 | 0.742 | |||
| ZJ1→知觉行为控制 | 0.783 | 0.811 | 0.812 | 0.591 |
| ZJ2→知觉行为控制 | 0.771 | |||
| ZJ3→知觉行为控制 | 0.751 | |||
| HJ1→环境认知水平 | 0.774 | 0.802 | 0.802 | 0.575 |
| HJ2→环境认知水平 | 0.740 | |||
| HJ3→环境认知水平 | 0.760 | |||
| ZC1→政策环境 | 0.765 | 0.803 | 0.801 | 0.573 |
| ZC2→政策环境 | 0.764 | |||
| ZC3→政策环境 | 0.742 |
表8 区别效度检验结果Table 8 Results of discriminant validity tests |
| 变量 | 态度 | 主观规范 | 知觉行为控制 | 环境认知水平 | 政策环境 |
|---|---|---|---|---|---|
| 态度 | 0.767 | ||||
| 主观规范 | 0.394 | 0.756 | |||
| 知觉行为控制 | 0.318 | 0.424 | 0.768 | ||
| 环境认知水平 | 0.505 | 0.287 | 0.297 | 0.758 | |
| 政策环境 | 0.251 | 0.293 | 0.280 | 0.311 | 0.757 |
表 9 结构方程整体适配度检验结果Table 9 Results of the overall goodness-of-fit test for the SEM |
| 指标类型 | 具体指标 | 建议值 | 模型结果 |
|---|---|---|---|
| 绝对 拟合 优度 指标 | 卡方自由度比 X2/df | <5适合,<3良好 | 1.108 |
| 拟合优度指数GFI | >0.9为优秀,0.8~0.9为良好 | 0.991 | |
| 调整拟合优度指数AGFI | >0.9 为优秀,0.8~0.9为良好 | 0.987 | |
| 近似误差均方根RMSEA | ⩽0.05 为优秀,<0.1为良好 | 0.009 | |
| 相对 | 规范拟合指数NFI | >0.9为优秀,0.8~0.9为良好 | 0.988 |
| 拟合 | 增量拟合指数IFI | >0.9为优秀,0.8~0.9为良好 | 0.999 |
| 指标 | 塔克-刘易斯指数TLI | >0.9为优秀,0.8~0.9为良好 | 0.998 |
表10 直接效应检验结果Table 10 Results of the direct effect tests |
| 路径 | 假设 | 标准化路径系数 | 显著性 |
|---|---|---|---|
| 态度→支付意愿 | H1 | 0.264 | *** |
| 主观规范→支付意愿 | H2 | 0.405 | *** |
| 知觉行为控制→支付意愿 | H3 | 0.425 | *** |
| 环境认知水平→支付意愿 | H4b | 0.123 | *** |
| 政策环境→支付意愿 | H5 | 0.223 | *** |
表 11 间接效应检验结果Table 11 Results of the indirect effect tests |
| 路径 | 假设 | 标准化系数 | 90%置信区间 | 显著性 | 检验结果 | 中介效应占比/% | |
|---|---|---|---|---|---|---|---|
| 下限 | 上限 | ||||||
| 环境认知水平→态度→支付意愿 | H4c | 0.076 | 0.060 | 0.093 | *** | 支持 | 52.4 |
表 12 必要性分析结果Table 12 Results of the necessity analysis |
| 条件变量 | 支付意愿 | ~支付意愿 | ||
|---|---|---|---|---|
| 一致性 | 覆盖率 | 一致性 | 覆盖率 | |
| 态度 | 0.553146 | 0.832446 | 0.532249 | 0.265886 |
| ~态度 | 0.512182 | 0.767360 | 0.664611 | 0.330527 |
| 主观规范 | 0.591210 | 0.848963 | 0.510551 | 0.243360 |
| ~主观规范 | 0.473071 | 0.744347 | 0.683159 | 0.356809 |
| 知觉行为控制 | 0.607121 | 0.854754 | 0.504875 | 0.235946 |
| ~知觉行为控制 | 0.457291 | 0.735603 | 0.689232 | 0.368028 |
| 环境认知水平 | 0.622398 | 0.848122 | 0.533167 | 0.241166 |
| ~环境认知水平 | 0.443118 | 0.740890 | 0.664261 | 0.368669 |
| 政策环境 | 0.601589 | 0.861978 | 0.485241 | 0.230790 |
| ~政策环境 | 0.463143 | 0.730481 | 0.709831 | 0.371632 |
表13 组态分析结果Table 13 Results of the configuration analysis |
| 条件变量 | 产生绿色电力支付意愿的组态 | |||
|---|---|---|---|---|
| 组态A1 | 组态A2 | 组态A3 | 组态A4 | |
| 态度 | ⊗ | ⊗ | ||
| 主观规范 | • | • | ||
| 知觉行为控制 | ● | • | • | |
| 环境认知水平 | . | . | ||
| 政策环境 | ⊗ | ⊗ | ● | |
| 一致性 | 0.833102 | 0.841057 | 0.871021 | 0.877314 |
| 原始覆盖率 | 0.257408 | 0.256322 | 0.302393 | 0.456228 |
| 唯一覆盖率 | 0.010995 | 0.028050 | 0.009840 | 0.175454 |
| 总体解的一致性 | 0.850824 | |||
| 总体解的覆盖率 | 0.562362 | |||
| [1] |
|
| [2] |
|
| [3] |
张瑞, 高阳. 上海市绿色电力发展现状及对策思考[J]. 电力需求侧管理, 2006, 8(4):47-50.
|
| [4] |
路妍, 耿鹏云, 安磊, 等. 我国绿色电力交易对当前电力市场影响效果推演[J]. 电力建设, 2024, 45(7):156-166.
|
| [5] |
|
| [6] |
|
| [7] |
吴力波, 周阳, 徐呈隽. 上海市居民绿色电力支付意愿研究[J]. 中国人口.资源与环境, 2018, 28(2):86-93.
|
| [8] |
|
| [9] |
|
| [10] |
|
| [11] |
|
| [12] |
|
| [13] |
|
| [14] |
|
| [15] |
|
| [16] |
|
| [17] |
|
| [18] |
|
| [19] |
|
| [20] |
|
| [21] |
|
| [22] |
张瑞增, 唐若迪, 姚瑶, 等. TPB-NAM 框架下规模农户绿色优质农产品生产意愿研究:基于江苏省的调查数据[J]. 中国农业资源与区划, 2023, 44(4):184-194.
|
| [23] |
周华, 王杜春. 基于结构方程模型的绿色蔬菜消费者购买意愿研究[J]. 北方园艺, 2019(15):157-163.
|
| [24] |
李文超, 邵婧. 消费者环保服装购买行为的影响因素研究:基于计划行为理论和规范激活理论[J]. 中国管理科学, 2025, 33(6): 233-244.
|
| [25] |
|
| [26] |
吴萌, 甘臣林, 任立, 等. 分布式认知理论框架下农户土地转出意愿影响因素研究:基于 SEM 模型的武汉城市圈典型地区实证分析[J]. 中国人口.资源与环境, 2016(9):62-71.
|
| [27] |
|
| [28] |
盛光华, 龚思羽, 解芳. 中国消费者绿色购买意愿形成的理论依据与实证检验:基于生态价值观、个人感知相关性的 TPB 拓展模型[J]. 吉林大学社会科学学报, 2019, 59(1):134-145, 222.
|
| [29] |
|
| [30] |
|
| [31] |
|
| [32] |
|
| [33] |
|
| [34] |
|
| [35] |
林龙圳, 郑佳, 林震. 基于条件价值法(CVM)的库布齐沙漠治理支付意愿及影响因素研究[J]. 中国沙漠, 2020, 40( 6):190-200. LIN Longzhen,ZHENG Jia,LIN Zhen.Study on willingness to pay and influencing factors of Kubuqi desertification control based on CVM Data[J]. Journal of Desert Research,2020, 40(6):190-200.
|
| [36] |
|
| [37] |
|
| [38] |
陈明睿, 陈英, 谢保鹏, 等. 计划行为理论视角下农户参与农渠修建的意愿及其影响因素研究[J]. 干旱区资源与环境, 2024, 38(9): 67-75.
|
| [39] |
|
| [40] |
|
| [41] |
|
| [42] |
|
| [43] |
|
| [44] |
杜运周, 刘秋辰, 程建青. 什么样的营商环境生态产生城市高创业活跃度?-基于制度组态的分析[J]. 管理世界, 2020, 36(9):141-155.
|
| [45] |
孔德易, 严艳, 武梦雪. 乡村旅游创业者社会创业意向影响因素研究:基于 SEM 和 fsQCA 的实证分析[J]. 干旱区资源与环境, 2025, 39(4):199-208.
|
/
| 〈 |
|
〉 |