 PDF(1618 KB)


Raman Spectroscopy in the Detection of Environmental Micro- and Nanoplastics: Applications and Challenges
Kefu Ye, Minjie Xie, Xingqi Chen, Zhiyu Zhu, Shixiang Gao
Prog Chem ›› 2025, Vol. 37 ›› Issue (1) : 2-15.
 PDF(1618 KB)
 PDF(1618 KB)
Raman Spectroscopy in the Detection of Environmental Micro- and Nanoplastics: Applications and Challenges
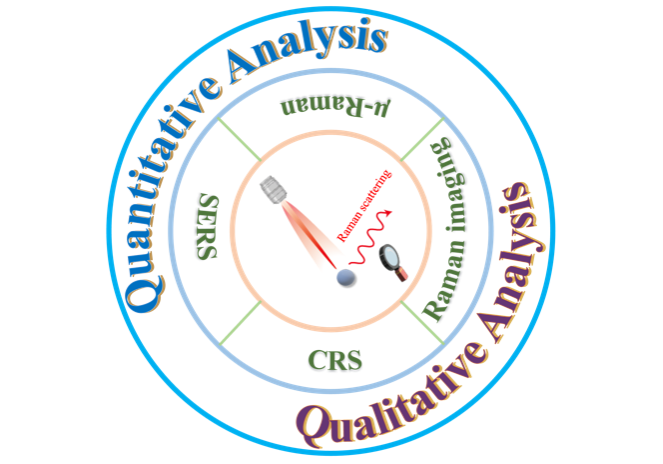
This review highlights the advantages and research advancements of Raman spectroscopy in detecting micro- and nanoplastics in the environment. With the worsening issue of microplastic pollution, particularly its widespread presence in aquatic and terrestrial ecosystems, Raman spectroscopy has emerged as a non-destructive, high-resolution analytical technique widely employed for identifying and quantitatively analyzing micro- and nanoplastics. This is attributed to its unique spectral characteristics and reduced susceptibility to water interference compared to infrared spectroscopy. The strengths of Raman spectroscopy in detecting micro- and nanoplastics lie in its high spatial resolution, broad spectral range, and exceptional sensitivity. However, challenges such as fluorescence interference and low signal-to-noise ratios persist in the detection process. To enhance Raman signals, researchers have introduced various approaches, including sample pretreatment, surface-enhanced Raman spectroscopy (SERS), and nonlinear Raman spectroscopy techniques. Furthermore, this paper underscores the necessity of building a comprehensive Raman spectroscopy database to boost detection accuracy and efficiency. Future research directions include developing more effective preprocessing methods, dynamically monitoring the behavior of micro- and nanoplastics, and integrating intelligent detection systems.
1 Introduction
2 Raman spectroscopy methods for micro-and nanoplastics
2.1 Basic principles and conventional Raman spectroscopy
2.2 Surface-enhanced Raman spectroscopy (SERS)
2.3 Coherent Raman spectroscopy (CRS)
2.4 Raman imaging
3 Identification in environmental samples with Raman spectroscopy
3.1 Fluorescence interference and its elimination
3.2 Machine learning applications with Raman spectral databases
4 Quantitative Analysis
4.1 In situ concentration and mass concentration
4.2 Number concentration via µ-Raman and imaging
5 Conclusion and outlook

Raman spectroscopy / micro- and nanoplastics / qualitative identification / quantitative detection / signal enhancement and optimization / machine learning
| [1] |
|
| [2] |
|
| [3] |
|
| [4] |
|
| [5] |
|
| [6] |
|
| [7] |
|
| [8] |
|
| [9] |
|
| [10] |
|
| [11] |
|
| [12] |
|
| [13] |
|
| [14] |
|
| [15] |
|
| [16] |
|
| [17] |
|
| [18] |
|
| [19] |
|
| [20] |
|
| [21] |
|
| [22] |
|
| [23] |
|
| [24] |
|
| [25] |
|
| [26] |
|
| [27] |
|
| [28] |
|
| [29] |
|
| [30] |
|
| [31] |
|
| [32] |
|
| [33] |
|
| [34] |
|
| [35] |
|
| [36] |
|
| [37] |
|
| [38] |
|
| [39] |
|
| [40] |
|
| [41] |
|
| [42] |
|
| [43] |
|
| [44] |
|
| [45] |
|
| [46] |
|
| [47] |
|
| [48] |
|
| [49] |
|
| [50] |
|
| [51] |
|
| [52] |
|
| [53] |
|
| [54] |
|
| [55] |
|
| [56] |
|
| [57] |
|
| [58] |
|
| [59] |
|
| [60] |
|
| [61] |
|
| [62] |
|
| [63] |
|
| [64] |
|
| [65] |
|
| [66] |
|
| [67] |
|
| [68] |
|
| [69] |
|
| [70] |
|
| [71] |
|
| [72] |
|
| [73] |
|
| [74] |
|
| [75] |
|
| [76] |
|
| [77] |
|
| [78] |
|
| [79] |
|
| [80] |
|
| [81] |
|
| [82] |
|
| [83] |
|
| [84] |
|
| [85] |
|
| [86] |
|
| [87] |
|
| [88] |
|
| [89] |
|
| [90] |
|
| [91] |
|
| [92] |
|
| [93] |
|
| [94] |
|
| [95] |
|
| [96] |
|
| [97] |
|
| [98] |
|
| [99] |
|
| [100] |
|
| [101] |
|
| [102] |
|
| [103] |
|
| [104] |
|
| [105] |
|
| [106] |
|
| [107] |
|
| [108] |
|
| [109] |
|
| [110] |
|
| [111] |
|
| [112] |
|
| [113] |
|
| [114] |
|
| [115] |
|
| [116] |
|
| [117] |
|
| [118] |
|
| [119] |
|
| [120] |
|
| [121] |
|
/
| 〈 |
|
〉 |