
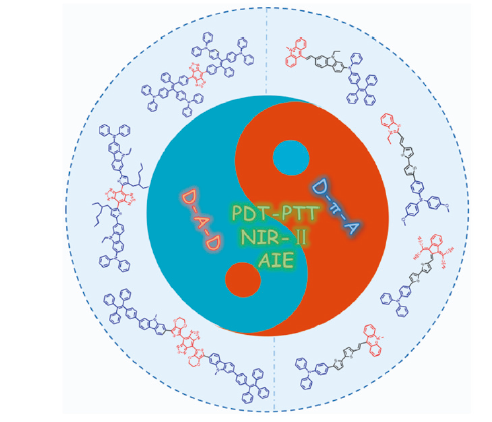
NIR-Ⅱ Aggregation-Induced Emission for PDT-PTT Dual-Mode Synergistic Therapy
Received date: 2023-01-02
Revised date: 2023-02-28
Online published: 2023-08-07
Supported by
The National Natural Science Foundation of China(21905021)
The Sichuan Province Science and Technology Support Program(2022NSFSC1269)
The Sichuan Province Science and Technology Support Program(2023NSFSC1977)
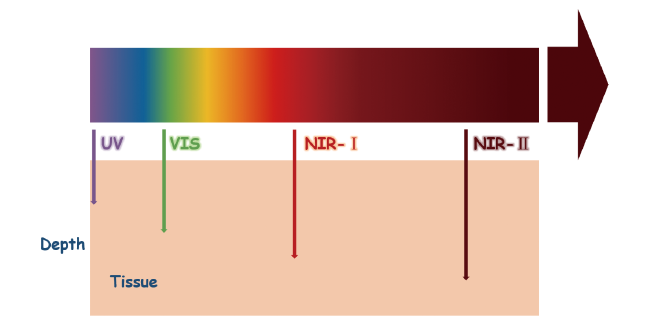
Due to the excellent optical properties, good biocompatibility, high reactive oxygen species yield and excellent photothermal conversion ability, aggregation-induced emission (AIE) materials show great potential applications in the fields of photodynamic and photothermal therapy. However, traditional fluorescent materials need light with short wavelength for emission, which has the problem of poor tissue penetration, and further restricts the clinical application. To overcome the problem, AIE materials with emission in the range of second near-infrared (NIR-Ⅱ) emission are employed, which promotes the feasibility of the clinical application. This review summarizes the application of NIR-Ⅱ AIEgens with donor-π-acceptor (D-π-A) and donor-acceptor-donor (D-A-D) structure in photodynamic-photothermal dual-mode synergistic therapy.
1 Introduction
2 NIR-ⅡAIE molecules with D-π-A and D-A-D structure for dual-mode synergistic therapy
2.1 D-π-A sructure
2.2 D-A-D sructure
3 Conclusion and outlook
Hui Tang , Hairong Li , Xiaochun Liu , Yahui Zhang , Zhouyu Wang , Xiaoqi Yu . NIR-Ⅱ Aggregation-Induced Emission for PDT-PTT Dual-Mode Synergistic Therapy[J]. Progress in Chemistry, 2023 , 35(9) : 1399 -1414 . DOI: 10.7536/PC221230
表1 PDT-PTT双模式协同治疗的NIR-Ⅱ AIE分子的 D-π-A结构Table 1 D-π-A structure of NIR-Ⅱ AIE molecules in PDT-PTT dual-mode synergistic therapy |
| Name | Molecular stucture | λex/λem (nm) | Φf | ROS | PCE | ref |
|---|---|---|---|---|---|---|
| BITT | 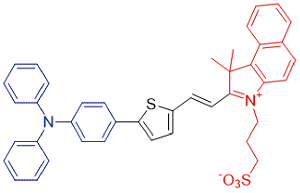 | 590[a]/818[c] | 5.8% | 3.92% | 35.76% | 42 |
| TTT-1 | 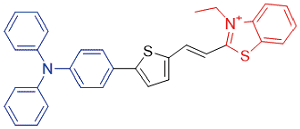 | 535[a]/750[b] | 0.6% | - | 36.5% | 43 |
| TTT-2 | 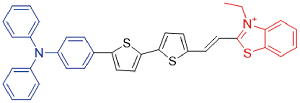 | 540[a]/783[b] | 0.4% | - | 42.6% | 43 |
| TTT-3 |  | 569[a]/782[b] | 0.3% | - | 40.7% | 43 |
| TTT-4 |  | 568[a]/813[b] | 0.3% | - | 39.9% | 43 |
| TI |  | - | - | - | - | 44 |
| TSI |  | - | - | - | - | 44 |
| TSSI | 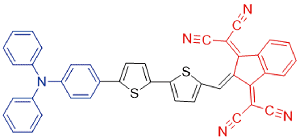 | 664[c]/992[b] | - | - | 46% | 44 |
| TPEDCAc | 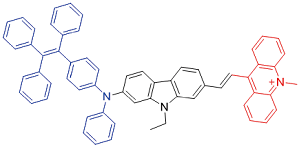 | 580[b]/980[b] | 0.4% | - | 44.8% | 45 |
| TAM | 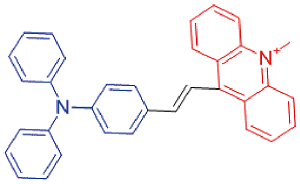 | 581[a]/840[a] | 0.2% | - | - | 46 |
| TSAM | 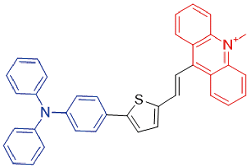 | 587[a]/933[a] | 0.1% | - | - | 46 |
| TSSAM | 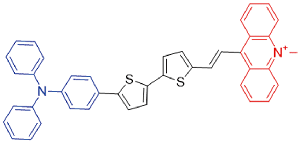 | 595[a]/1022[a] | 0.1% | - | 40.1% | 46 |
[a] 溶液中的吸收或发射波长;[b] 纳米颗粒在水溶液中的发射波长;[c] 固体状态的吸收或发射波长 |
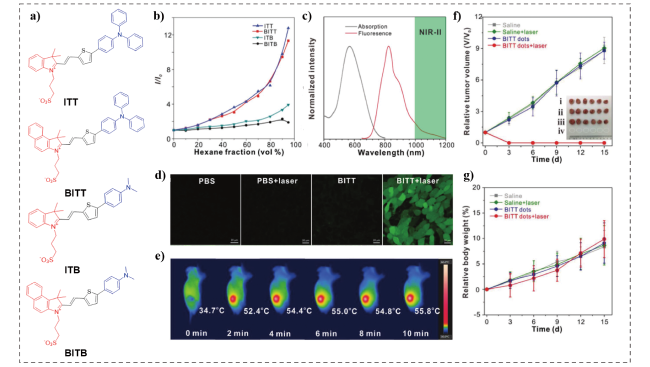
图2 (a) ITT、BITT、ITB、BITB的化学结构;(b) ITT、BITT、ITB、BITB在不同己烷含量下的相对荧光强度(I/I0)图, I0和I分别是四种分子在乙醇和乙醇/甲烷混合物中的荧光强度;(c) BITT纳米颗粒在水溶液中的吸收和发射光谱;(d) DCFH-DA和BITT对4T1细胞内ROS的激光共聚焦成像(CLSM);(e) 瘤内注射BITT纳米颗粒后,660 nm激光照射下的4T1荷瘤小鼠的红外热图像;(f) 不同条件(i,生理盐水;ii,生理盐水+660 nm激光;iii,BITT纳米颗粒;iv, BITT纳米颗粒+660 nm激光)处理的4T1荷瘤小鼠的肿瘤图像;(g) 不同治疗组小鼠的体重变化[42]Fig.2 (a) Chemical structures of ITT、BITT、ITB、BITB; (b) Plots of relative PL intensity (I/I0) of ITT、BITT、ITB、BITB versus hexane fraction; (c) The absorption and emission spectra of BITT NPs in aqueous solution; (d) CLSM imaging of intracellular ROS in 4T1 cells using DCFH-DA with BITT upon diverse treatment; (e) IR thermal images of 4T1 bearing-tumor mice injected with BITT NPs followed by laser irradiation. (f) Bodyweight changes of mice in different treatment groups; (g) Tumor bearing mice after 15-day different treatments[42]. Copyright 2021, Wiley-VCH GmbH |
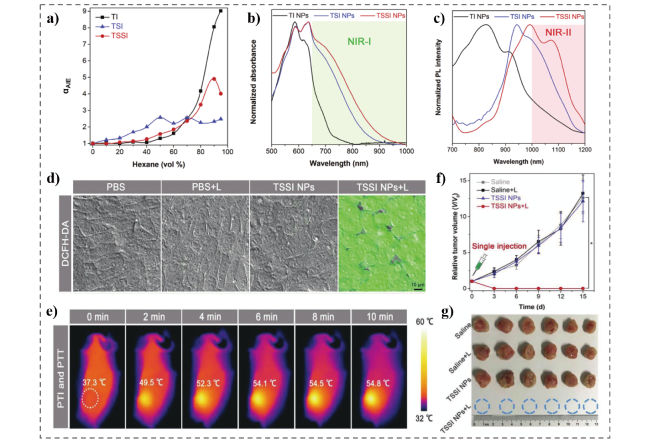
图3 (a) TI、TSI、TSSI相对荧光强度图;(b) TI、TSI 、TSSI纳米颗粒在水溶液中的吸收光谱;(c) TI、TSI、TSSI纳米颗粒在水溶液中的荧光发射光谱;(d) DCFH-DA和TSSI对4T1细胞内ROS的CLSM成像;(e) 注射TSSI纳米颗粒后,激光照射下的4T1荷瘤小鼠的红外热图像;(f) 不同条件(i, 生理盐水;ii,生理盐水+激光;iii,TSSI纳米颗粒;iv, TSSI纳米颗粒+激光)处理的4T1荷瘤小鼠的肿瘤生长曲线和 (g) 肿瘤图像[44]Fig.3 (a) Plots of the relative emission intensity (αAIE) versus hexane fraction; (b) Normalized absorption and (c) normalized emission spectra of these NPs in aqueous solution; (d) intracellular ROS level. (e) Thermal images, heating temperatures (at tumor sites) of tumor-bearing mice during continuous NIR irradiation at 12 h postinjection of TSSI NPs; (f) Time-dependent tumor growth curves of tumor-bearing mice with various treatments; (g) Photos of the tumors harvested at day 15 after different treatments[44].Copyright 2020, WIEY-VCH Verlag GmbH &Co. KgaA, Weinheim |
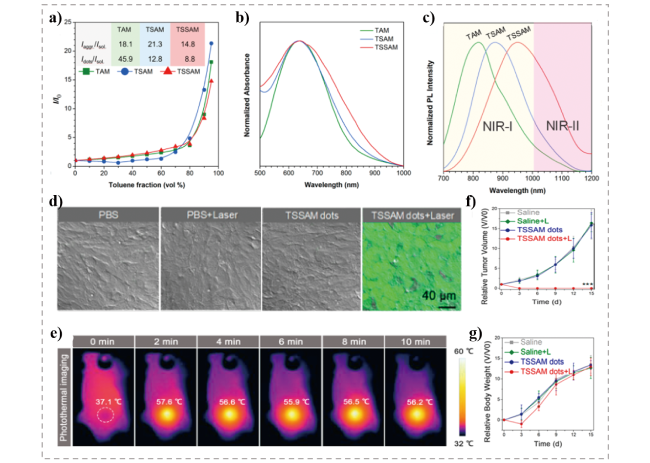
图4 (a) TAM、TSAM、TSSAM在不同甲苯含量下的相对荧光强度(I/I0)图,插图分别显示了三个分子的聚集体与溶液的荧光强度比和纳米颗粒与溶液的荧光强度比;(b) 三个分子在薄膜中的吸收光谱,(c) 三个分子在聚集态下的发射光谱;(d) DCFH-DA和TSSAM对4T1细胞内ROS的CLSM成像;(e) 肿瘤内注射TSSAM纳米颗粒的荷瘤小鼠红外热像图;(f) (左)不同条件(i,生理盐水;ii,生理盐水+激光;iii,BITT纳米颗粒;iv, BITT纳米颗粒+激光)处理的4T1荷瘤小鼠的肿瘤生长曲线和(右)治疗后从小鼠中提取的4T1肿瘤照片;(g) 不同治疗组的小鼠体重变化[46]Fig.4 (a) Plots of relative PL intensity (I/I0) of TAM、TSAM、TSSAM versus toluene fraction, Inset shows a summary table of the variation in PL intensity of TAM, TSAM, and TSSAM in aggregates (Iaggr.) and nanopaticles (NPs), compared with those in solution (Isol.); (b) Absorption spectra of TAM, TSAM, and TSSAM in film; (c) Fluorescence spectra of TAM, TSAM, and TSSAM aggregates (d) Intracellular ROS generation of TSSAM dots in 4T1 cells in the presence of DCFH-DA with light; (e) IR thermal images of 4T1 tumor-bearing mice intratumorally injected with TSSAM NPs, followed by laser irradiation; (f) (Left) Growth curves of the xenografted 4T1 tumors on the mice after receiving treatment with PBS alone, PBS, and laser light irradiation, TSSAM NPs alone, and TSSAM NPs and laser irradiation; (Right) Photographs of the 4T1 tumors extracted from the mice after the treatment described in panel; (g) Body weight curves of the xenografted 4T1 tumors extracted from the mice after the treatment described in panel[46].Copyright 2020, American Chemical Society |
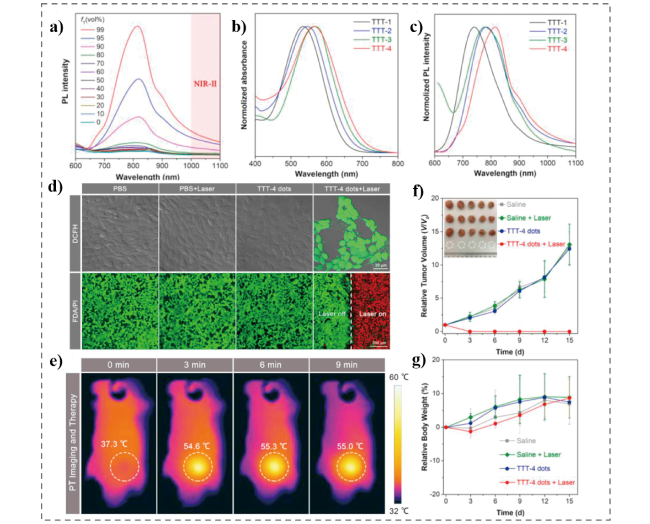
图5 (a) TTT-4在不同甲苯含量(fT)的二甲基亚砜(DMSO)和甲苯混合溶液中的荧光发射光谱;(b) TTT-1、TTT-2、TTT-3、TTT-4在DMSO溶液中的归一化吸收;(c) 四个分子在含有99%甲苯馏分的DMSO和甲苯混合溶液中的归一化荧光光谱;(d) 不同处理的4T1细胞的细胞内ROS生成(上排)和活死细胞染色(下排);(e) 注射TTT-4纳米颗粒后12 h,激光照射肿瘤部位的红外热成像图;(f) 不同处理的荷瘤小鼠的时间依赖性肿瘤生长曲线;(g) 在治疗过程中记录的不同治疗中小鼠的体重变化曲线[43]Fig.5 (a) PL spectra of TTT-4 in DMSO/toluene mixture with different toluene fraction(fT); (b) Normalized absorption of these AIEgens in DMSO solution; (c) Normalized PL spectra of AIEgens in the DMSO/toluene mixture with 99% toluene fraction. (d) Intracellular ROS generation (upper row) and live/dead cell staining (low row) of 4T1 cells treated with PBS, PBS+laser, TTT-4 NPs,and TTT-4 NPs +laser for 13 h; (e) IR thermal images of 4T1 tumor-bearing mice intratumorally injected with TTT-4 NPs, followed by laser irradiation; (f) Time-dependent tumor growth curves of tumor-bearing mice with various treatments; (g) Body weight change curves of mice in different treatment recorded during the treatment process[43].Copyright 2021, Elsevier Ltd |
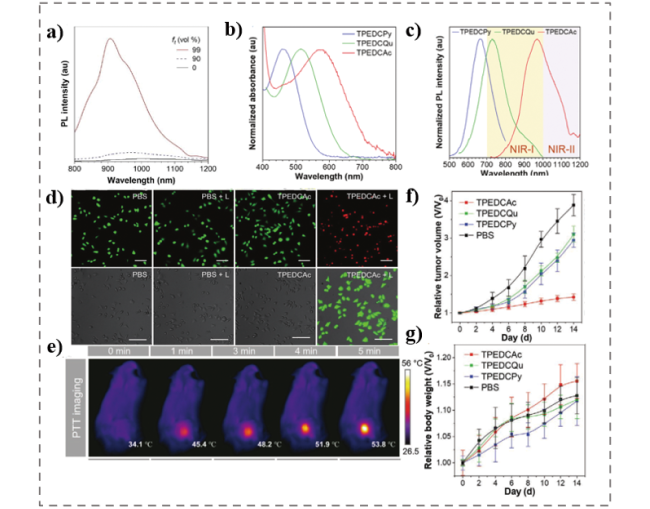
图6 (a) TPEDCAc分子在不同甲苯含量(fT)的DMSO和甲苯混合溶液中的荧光发射光谱;(b),(c) TPEDCAc、TPEDCQu、TPEDCPy三个分子聚集体的吸收和发射光谱;(d) (上排)不同条件下的FDA和PI共同染色的活/死MCF-7细胞染色;(下排)DCFH-DA和TPEDCAc纳米颗粒对MCF-7细胞内ROS的CLSM成像;(e) MCF-7荷瘤小鼠瘤内注射TPEDCAc 纳米颗粒12 h后的红外热像图;(f) 不同条件治疗后的肿瘤体积变化曲线;(g) 不同条件治疗后的小鼠体重变化曲线[45]Fig.6 (a) PL spectra of TPEDCAc in DMSO/toluene mixture with different toluene fraction (fT); (b) Normalized absorption and (c) PL spectra of TPEDCPy, TPEDCQu and TPEDCAc in the aggregate state; (d) (upper row) Live/dead assay of MCF-7 cells co-stained with FDA and PI treated with PBS, PBS+L, TPEDCAc NPs,and TPEDCAc NPs + L for 30 min. (low row) intracellular ROS generation of TPEDCAc NPs in MCF-7 cells in the presence of DCFH-DA with light; (e) IR thermal images of MCF-7 tumor-bearing mice intratumorally injected with TPEDCAc NPs, followed by laser irradiation; (f) Growth curves of tumor-bearing mice with various treatments; (g) Body weight change curves of mice in different treatment recorded during the treatment process[45]. Copyright 2022, Wiley-VCH GmbH |
表2 PDT-PTT双模式协同治疗的NIR-Ⅱ AIE分子的 D-A-D 结构Table 2 D-A-D structure of NIR-Ⅱ AIE molecules in PDT-PTT dual-mode synergistic therapy |
| Name | Molecular structure | λabs/λem | Φf | ROS | PCE | ref |
|---|---|---|---|---|---|---|
| ZSY-TPE | 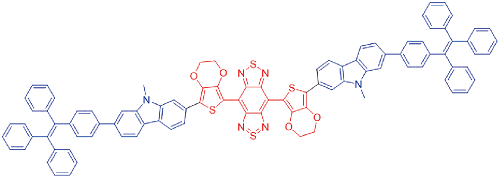 | 730[a]/1020[a] | 3.1% | 13.8% | 28.4% | 47 |
| DDTB | 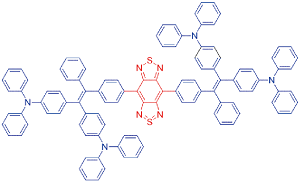 | 687[b]/793[b] | 0.16% | 1.05% | 30.7% | 48 |
| DPMD |  | 524[a]/796[a] | 5% | - | 32% | 49 |
| TPMD |  | 564[a]/822[a] | 19% | - | 42% | 49 |
| CTBT |  | 682[a]/858[a] | 16.92% | - | 57.7% | 50 |
| DCTBT |  | 704[a]/995[a] | 4.37% | - | 59.6% | 50 |
[a] 溶液中的吸收或发射波长;[b] 纳米颗粒在水溶液中的发射波长 |
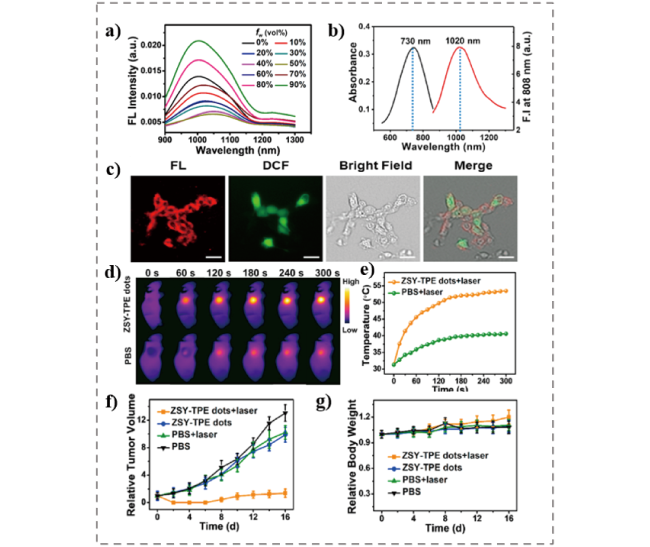
图7 (a) ZSY-TPE分子在不同水含量(fw)的四氢呋喃(THF)和水混合溶液中的荧光发射光谱;(b) ZSY-TPE在二氯甲烷中的吸收和发射光谱;(c) DCFH-DA和ZSY-TPE纳米颗粒对4T1细胞内ROS的CLSM成像;(d) 注射ZSY-TPE纳米颗粒24 h后小鼠全身红外热成像图;(e) 肿瘤温度随激光照射时间的变化图;(f) 不同处理的小鼠肿瘤生长曲线图;(g) 不同治疗后小鼠的相对体重曲线图[47]Fig.7 (a) PL spectra of ZSY-TPE in THF/H2O mixture with different water fraction(fw); (b) Absorption and fluorescent emission spectra of ZSY-TPE in DCM; (c) ROS generation test against 4T1 cells after incubation with ZSY-TPE NPs for 2 h and co-staining with Lysotracker Green; (d) IR thermal images of the whole bodies of mice 24 h after the injection of ZSY-TPE NPs or PBS and laser irrdiation; (e) Variation in tumor temperature as a function of laser irradiation time; (f) Tumor growth inhibition (g) relative body weight curves after different treatments[47].Copyright 2020, Elsevier Ltd |
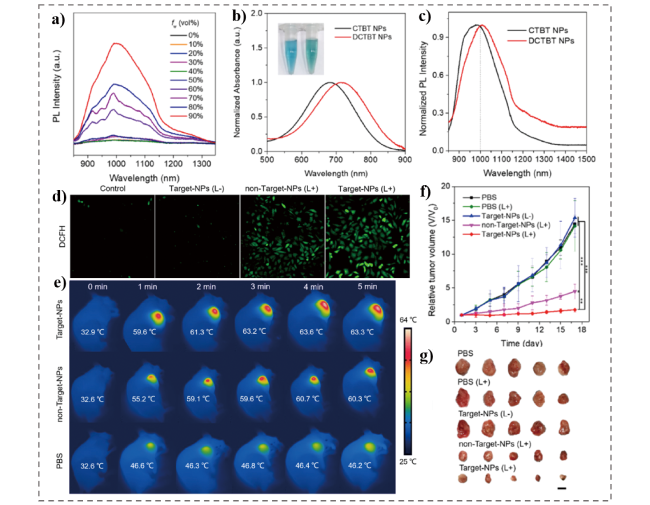
图8 (a) DCTBT分子在不同水含量(fw)的四氢呋喃(THF)和水混合溶液中的荧光发射光谱;(b),(c) CTBT、DCTBT纳米颗粒在水溶液中的归一化吸收光谱和发射光谱;(d) 使用DCFH荧光指示剂检测PANC-1细胞中ROS的CLSM图像;(e) 在注射脂质型DCTBT纳米颗粒8 h后用808 nm激光照射期间,小鼠肿瘤部位的红外热成像图;(f) 不同治疗组的小鼠肿瘤相对体积变化;(g) 不同治疗组治疗后第17天采集的肿瘤图像[50]Fig.8 (a) PL spectra of DCTBT in THF/H2O mixture with different water fraction(fw); (b) Normalized absorption spectra and (c) Normalized emission spectra of two NPs in aqueous solution; (d) ROS detection in PANC-1cells using DCFH as fluorescence indicator; (e) Thermal images, heating temperatures (at tumor sites) of tumor-bearing mice during continuous laser irradiation at 8 h postinjection of lip-DCTBT NPs; (f) Relative tumor volume changes for various treatment groups; (g) Tumor images harvested at 17 day after different treatments[50]. Copyright 2022, Elsevier Ltd |
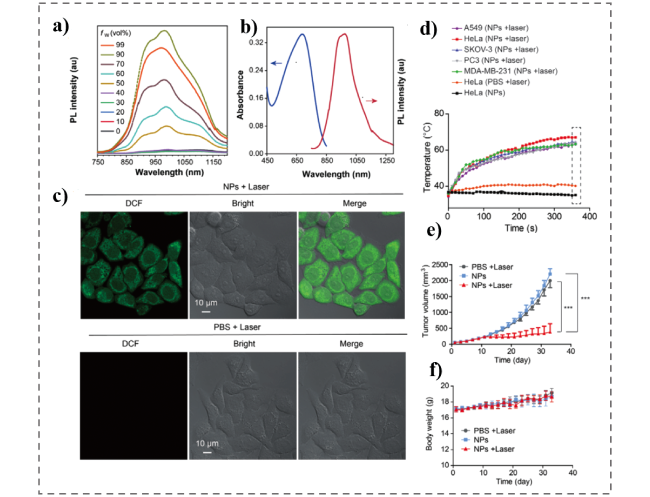
图9 (a) DDTB在不同水含量(fw)的四氢呋喃(THF)/水混合物中的荧光发射光谱;(b) DDTB纳米颗粒在水溶液中的吸收和发射图谱;(c) 分别用DDTB纳米颗粒和PBS孵育细胞后,通过DCFH-DA检测细胞内ROS的生成;(d) 肿瘤区域的温度变化曲线图;(e) 不同处理的小鼠肿瘤生长曲线;(f) 不同处理的小鼠体重变化曲线[48]Fig.9 (a) PL spectra of DDTB in THF/H2O mixture with different water fraction(fw); (b) Absorption and emission spectra of the NPs in aqueous solution; (c) Detection of intracellular ROS generation by DCFH-DA in HeLa cells after incubation with DDTB NPs and PBS, follwed by laser irradiation; (d) Temperature changes at the tumor sites as a function of the laser irradiating time; (e) Average tumor growth curves in different groups; (f) Body weight of HeLa-tumor-bearing mice in different groups[48]. Copyright 2021, Wiley-VCH GmbH |
| [1] |
|
| [2] |
|
| [3] |
|
| [4] |
|
| [5] |
|
| [6] |
|
| [7] |
|
| [8] |
|
| [9] |
|
| [10] |
|
| [11] |
|
| [12] |
|
| [13] |
|
| [14] |
|
| [15] |
|
| [16] |
|
| [17] |
|
| [18] |
|
| [19] |
|
| [20] |
|
| [21] |
|
| [22] |
|
| [23] |
|
| [24] |
|
| [25] |
|
| [26] |
|
| [27] |
|
| [28] |
|
| [29] |
|
| [30] |
|
| [31] |
|
| [32] |
|
| [33] |
|
| [34] |
|
| [35] |
|
| [36] |
|
| [37] |
|
| [38] |
(任飞, 石建兵, 佟斌, 蔡政旭, 董宇平. 化学进展, 2021, 33(3): 341.).
|
| [39] |
|
| [40] |
|
| [41] |
(赵跃智, 蔡敏敏, 钱妍, 解令海, 黄维. 化学进展, 2013, 25(Z1): 296.).
|
| [42] |
|
| [43] |
|
| [44] |
|
| [45] |
|
| [46] |
|
| [47] |
|
| [48] |
|
| [49] |
|
| [50] |
|
| [51] |
|
| [52] |
|
/
| 〈 |
|
〉 |