
Emerging Pollutants
Received date: 2024-03-08
Revised date: 2024-08-31
Online published: 2024-11-01
Supported by
special fund of State Key Joint Laboratory of Environmental Simulation and Pollution Control (Peking University)(23Y03ESPCP)
National Natural Science Foundation of China(22136001)
National Natural Science Foundation of China(22076204)
National Natural Science Foundation of China(U23A205)
National Natural Science Foundation of China(21936007)
National Natural Science Foundation of China(22376204)
National Natural Science Foundation of China(22320102005)
National Natural Science Foundation of China(22276198)
National Key Research and Development Program of China(2022YFC3902100)
National Key Research and Development Program of China(2022YFC3703200)
Second Tibetan Plateau Scientific Expedition and Research Program (STEP)(2019QZKK0605)
Consultative Review Project of Academic Divisions of the Chinese Academy of Sciences(2023-HX01-B-006)
Strategic Priority Research Program of the Chinese Academy of Sciences(XDB0750400)
Program for the Top Young-aged Talents of Higher Learning Institutions of Hebei, China(BJK2022042)
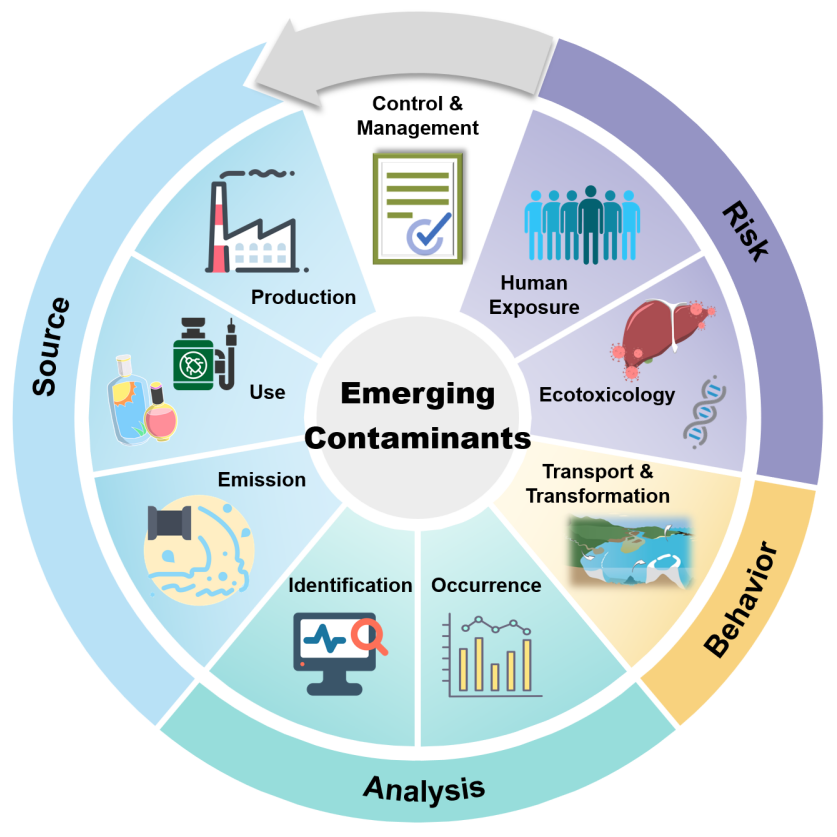
With the rapid development of current society and economy, as well as the accelerated process of industrialization and urbanization, the complexity and seriousness of environmental pollution issues are becoming increasingly apparent. Beyond traditional pollutants, the appearance of emerging pollutants on a global scale has brought new challenges to environment and public health. China’s “14th Five-Year Plan” and medium and long-term planning put forward “emerging pollutant control”, report of the 20th National Congress of the Communist Party of China also explicitly requested “carry out emerging pollutant control”. In 2022, General Office of the State Council issued “Action Plan for Emerging Pollutant Control”, followed by the Ministry of Ecology and Environment and various provinces, municipalities, and autonomous regions, which released corresponding implementation plans, China has transferred to a new phase of environmental protection that balances the control of both traditional and emerging pollutants. However, management of emerging pollutants is a long-term, dynamic and complex systematic project, which urgently needs to strengthen top-level design as well as scientific and technological support. Conducting systematic research on emerging pollutants not only provides effective scientific guidance for their control and improves the level of environmental quality management, but also assists our country in fulfilling international conventions, enhances the discourse power in global environmental governance, ensures our country environmental security, food security, international trade security, etc., and is of great significance for realizing sustainable development. This review aims to comprehensively explore various aspects of emerging pollutants, including their types and characteristics, production, use and emission, identification and detection, environmental occurrence, migration and transformation, ecotoxicological effects, human exposure, health risks, and management strategies. Furthermore, it looks forward to the future research direction, with a view to providing a scientific basis and decision-making support for control of emerging pollutants in China.
1 Concepts, types and characteristics of emerging pollutants
1.1 Definition and basic characteristics of emerging pollutants
1.2 Typical emerging pollutants
1.3 Scientific problems faced in the study of emerging pollutants
2 Production, use and emission of emerging pollutants
2.1 Production, use and emission of POPs
2.2 Production, use and release of antibiotics
2.3 Production, use and release of endocrine disruptors
3 Identification and characterization of emerging pollutants
3.1 Non-targeted analytical techniques for identification and characterization of emerging pollutants
3.2 Data analysis techniques for identification and characterization of emerging pollutants
3.3 Application of technologies for identification and characterization of emerging pollutants
3.4 Outlook
4 Environmental level and distribution characteristics
4.1 Regional distribution characteristics of emerging pollutants
4.2 Characteristics of emerging pollutants in environmental media
4.3 Bioconcentration and accumulation of emerging pollutants
5 Environmental transport and transformation of emerging pollutants, source and sink mechanisms
5.1 Multi-media process of emerging pollutants in the water environment and return tendency
5.2 Transport and transformation of emerging pollutants in soil-plant system
5.3 Atmospheric processes of emerging pollutants
5.4 Numerical modeling of regional environmental fate of emerging pollutants
6 Ecotoxicological effects of emerging pollutants
6.1 Ecotoxicology of perfluorinated and polyfluorinated alkyl compounds
6.2 Ecotoxicology of organophosphates
6.3 Integrated exposure assessment of novel nicotinic pesticides in honey crops
6.4 Ecotoxicology of PPCP-like contaminants
7 Human exposure and health risks of emerging pollutants
7.1 Human health risk-oriented screening of environmental contaminants
7.2 ADME processes and conformational relationships of emerging pollutants in humans
7.3 Environmental health risks of emerging pollutants
8 Management of emerging pollutants
8.1 Difficulties in the management of emerging pollutants
8.2 New pollutant management technologies
8.3 China's emerging pollutants environmental management policy
8.4 International experience in environmental management of emerging pollutants
8.5 Problems and suggestions of China's environmental management of emerging pollutants
9 Key scientific issues and prospects
9.1 Lack of emerging pollutants' bottom line
9.2 Environmental and ecotoxicological toxicological effects of low-dose prolonged exposure
9.3 Compound effects of emerging pollutants and histologic study of human exposure
9.4 Strategies for control and green development of high-risk chemicals
9.5 Construction of machine learning-based database for environmental samples and human exposure
9.6 Capacity building of scientific and technological support for emerging pollutants control actions in China
9.7 Coordinated development of ecological and environmental monitoring capability, fine support of emerging pollutant management, and construction of targeted new pollutant risk prevention and pollution prevention system
Yawei Wang , Qiurui Zhang , Nanyang Yu , Yuan Wang , Si Wei , Mingliang Fang , Sinuo Tian , Yali Shi , Jianbo Shi , Guangbo Qü , Ying Zhu , Yumin Zhu , Chuhong Zhu , Min Qiao , Jianghuan Hua , Mei Liu , Guorui Liu , Jianguo Liu , Yanna Liu , Nannan Liu , Longfei Jiang , Shuqin Tang , Bixian Mai , Cheng Li , Pan Yang , Lihua Yang , Rongyan Yang , Lili Yang , Xiaoxi Yang , Ruiqiang Yang , Xinghua Qiu , Guangguo Ying , Yan Wang , Gan Zhang , Quan Zhang , Zhen Zhang , Ying Zhang , Qianqian Zhang , Rongjing Lu , Da Chen , Xin Chen , Hexia Chen , Jingwen Chen , Jiazhe Chen , Bingcheng Lin , Xiaojun Luo , Chunling Luo , Rong Ji , Biao Jin , Bingsheng Zhou , Minghui Zheng , Shizhen Zhao , Meirong Zhao , Fanrong Zhao , Lu Jiang , Lingyan Zhu , Linlin Yao , Jingzhi Yao , Yong He , Xunjie Mo , Chuanzi Gao , Yongyong Guo , Nan Sheng , Yunhan Cui , Chengqian Liang , Jian Han , Zhen Cheng , Yanhong Zeng , Wenhui Qiu , Yaqi Cai , Hongli Tan , Bingcai Pan , Jiayin Dai , Dongbin Wei , Chunyang Liao , Jincai Zhao , Guibin Jiang . Emerging Pollutants[J]. Progress in Chemistry, 2024 , 36(11) : 1607 -1784 . DOI: 10.7536/PC241114
表1 《2023年重点管控新污染物清单》中列出的14种化学品[10]Table 1 Fourteen types of chemicals listed in 2023 List of Key Controlled New Pollutants[10] |
| Numbering | New contaminant name | New Contaminants | CAS number |
|---|---|---|---|
| 1 | Perfluorooctane sulfonate (PFOS), its salts, and perfluorooctane sulfonyl fluoride (PFOS-related compounds) | Perfluorooctanesulfonic acid (PFOS) and its salts, and perfluorooctanesulfonyl fluoride (PFOSF) (PFOS group) | 1763-23-1 307-35-7 2795-39-3 29457-72-5 29081-56-9 70225-14-8 56773-42-3 251099-16-8 |
| 2 | Perfluorooctanoic acid (PFOA), its salts and related compounds | Perfluorooctanoic acid (PFOA) and its salts and related compounds (PFOA group) | ― |
| 3 | Decabromodiphenyl ether | Decabromodiphenyl ether | 1163-19-5 |
| 4 | Short-chain chlorinated paraffins | Short-chain chlorinated paraffins(SCCPs) | 85535-84-8 68920-70-7 71011-12-6 85536-22-7 85681-73-8 108171-26-2 |
| 5 | Hexachlorobutadiene | Hexachlorobutadiene | 87-68-3 |
| 6 | Pentachlorophenol and its salts and esters | Pentachlorophenol and its salts and esters | 87-86-5 131-52-2 27735-64-4 3772-94-9 1825-21-4 |
| 7 | Trichlorfon propyl alcohol | Dicofol | 115-32-2 10606-46-9 |
| 8 | Perfluorohexane sulfonate (PFHxS) and its salts and related compounds | Perfluorohexanesulfonic acid (PFHxS) and its salts and related compounds (PFHxS group) | ― |
| 9 | Dechlorane and its cis isomer and trans isomer | Dechlorane plus (both cis and trans isomers) | 13560-89-9 135821-03-3 135821-74-8 |
| 10 | Dichloromethane | Dichloromethane | 75-09-2 |
| 11 | Chloroform (trichloromethane) | Chloroform | 67-66-3 |
| 12 | Nonylphenol | Nonylphenols | 25154-52-3 84852-15-3 |
| 13 | Antibiotics | Antibiotics | ― |
| 14 | Obsolete: hexabromocyclododecane, chloradan, endosulfan, hexachlorobenzene, dichlorodiphenyltrichloroethane (DDT), alpha-hexachlorocyclohexane, beta-hexachlorocyclohexane, lindane, endosulfan and its related isomers, polychlorinated biphenyls (PCBs) | Hexabromocyclododecane (HBCD)、Chlordane、Mirex、Hexachlorobenzene、Dichlorodiphenyltrichloroethane (DDT)、α-Hexachlorocyclohexane (α-HCH)、β-Hexachlorocyclohexane (β-HCH)、Lindane、Endosulfan (as a raw material and its isomers)、Polychlorinated biphenyls (PCBs) | ― |
表2 各类环境介质和生物样品中 BFRs 的浓度[55]Table 2 Concentrations of BFRs in environmental matrices and biota samples[55] |
| BFRs | Soil(dw)/ (ng/g) | Sediment(dw)/ (ng/g) | Water/ [ng/(g/mL)] | Air/ (ng/cm3) | Dust(dw)/ (ng/g) | Fish(ww)/ (ng/g) | Bird(ww)/ (ng/g) |
|---|---|---|---|---|---|---|---|
| TBBPA | 651.34±1.21E+03 (n=14) | 1.19E+03±7.05E+03 (n=39) | 0.27±0.51 (n=20) | 8.00E-08 (n=1) | 6.62E+04±3.26E+05 (n=34) | 5.61±17.21 (n=12) | NA (n=0) |
| HBCD | 1.65E+03±5.43E+03 (n=55) | 104.21E+02±334.23 (n=97) | 0.13±0.33 (n=31) | 5.37E-04±3.94E-03 (n=82) | 1.25E+04±4.32E+04 (n=129) | 14.92±59.34 (n=43) | 3.24±7.66 (n=32) |
| DBDPE | 2.38E+03±7.21E+03 (n=31) | 83.41±44.92 (n=48) | 700.31±200.21 (n=9) | 4.40E-06±1.87E-05 (n=48) | 1.55E+04±5.56E+04 (n=78) | 0.74±1.41 (n=11) | 0.41±0.39 (n=11) |
| BTBPE | 341.32±7.22E+03 (n=27) | 230.12±259.53E+02 (n=45) | 1.60E-03±0.2 (n=6) | 1.41E-06±4.19E-05 (n=39) | 7.07E+03±5.65E+04 (n=42) | 0.37±1.41 (n=7) | 6.34±0.39 (n=6) |
| HBB | 15.91±47.82 (n=22) | 1.86±4.32 (n=27) | 0.02E-02±2.57E-03 (n=12) | 1.04E-06±4.52E-06 (n=42) | 674.32±2.45E+03 (n=32) | 0.92±0.11 (n=11) | 0.97±0.93 (n=6) |
| TBB | 1.17±2.73 (n=15) | 9.95E+00±1.93E+03 (n=14) | 2.02E-03±1.29E-03 (n=11) | 1.82E-06±8.68E-06 (n=30) | 2.99E+03±1.69E+04 (n=42) | 1.46 (n=1) | 0.38±0.36 (n=6) |
| PBT | 21.32±72.83 (n=9) | 0.22±0.13 (n=15) | 1.81E-03±1.19E-03 (n=3) | 2.04E-07±8.53E-07 (n=23) | 52.52E+01±141.12 (n=19) | 72.71±35.23 (n=11) | 5.98±13.01 (n=6) |
| TBPH | 41.93±124.15 (n=17) | 44.92±133.12 (n=11) | 3.56E-03±2.51E-04 (n=9) | 9.57E-07±2.61E-06 (n=24) | 2.51E+03±7.20E+03 (n=50) | 14.91 (n=1) | 1.46±1.37 (n=6) |
| PBEB | 1.71±1.77 (n=17) | 3.34±13.01 (n=15) | 6.51E-04±2.85E-04 (n=8) | 1.71E-07±7.87E-07 (n=34) | 18.21±47.71 (n=23) | 2.63±3.45 (n=5) | 1.23±2.54 (n=6) |
| TBECH | 0.18±1.13 (n=2) | 23.81±43.82 (n=5) | 8.55E-04±1.54E-04 (n=3) | 2.85E-08±2.02E-08 (n=7) | 23.31±23.52 (n=8) | 2.42±1.57 (n=2) | 3.90 (n=1) |
Note:The data in the table represent the average concentrations of BFRs in different substrates ± standard deviation; dw is dry matter, and ww is wet matter. |
图9 基于动态物质流分析与多介质环境归趋模拟的中国HBCD的全生命周期排放估算:(a)生产、加工、使用和废物过程的排放;(b)向大气、水和土壤的排放[192]Fig. 9 Estimation of emissions of HBCD in China based on dynamic material flow analysis and multimedia environmental fate models: (a) emissions from production, processing, use and waste, (b) emissions to atmosphere, water and soil, redrawn from Li et al [192] |
图10 中国各地区电镀、消防和农药行业PFOS环境排放量分布[204]Fig. 10 The distribution of environmental releases of PFOS in metal plating, aqueous film forming foams (AFFFs) and sulfluramid in China[204]Note: Northeast China includes Liaoning, Jilin, Heilongjiang Provinces, Central-north China includes Beijing, Tianjin, Hebei, Shanxi, Shaanxi Provinces, Central China includes Henan, Hubei, Hunan Provinces, Southwest China includes Chongqing, Sichuan, Guizhou, Yunnan Provinces, East China includes Shanghai, Jiangsu, Zhejiang, Anhui, Fujian, Jiangxi, Shandong Provinces, South China includes Guangdong, Guangxi, Hainan Provinces. |
表3 全球水环境中各类别抗生素质量浓度水平Table 3 Concentrations of different types of antibiotic in the global water environment (average (minimum maximum)) ng/L |
| Kind | Countries and regions | Macrolides | Quinolones | Sulfonamides | Tetracyclines | β-lactams | Others |
|---|---|---|---|---|---|---|---|
| Effluent water from WWTPs | China | 419 (0.20~6770) | 285 (0.29~6840) | 518 (0.21~ 65400) | 148 (0.56~2210) | 463 (3.18~5000) | 137 (0.70~3050) |
| EU | 239 (13.0~930) | 168 (6.00~640) | 97.2 (7.00~ 950) | 22.8 | — | 46.0 (13.0~102) | |
| India | 55.4 (3.92~187) | 526552 (0.14×10⁷~1.40×10⁷) | 7468 (10.6~ 81100) | — | 29453 (0.22~59500) | 1072 (6.96~3800) | |
| Japan | 209 (0.25~836) | 145 (3.00~819) | 62.4 (0.06~ 470) | 58.6 (58.6~58.6) | — | — | |
| South Korea | 766 (0.20~9089) | — | 72.7 (0.10~ 483) | 575 (0.10~4517) | — | — | |
| Thailand | 15.5 (4.00~42.8) | 45.9 (9.28~ 89.0) | 108 (5.00~ 1499) | — | 34.5 (9.28~97.5) | 10 | |
| USA | 66.8 (1.00~219) | 142 (3.20~900) | 227 (1.00~ 4100) | 111 (15.4~231) | 66.7 (0.21~308) | 126 (4.50~598) | |
| Vietnam | 800 (200~ 2200) | 11414 (600~ 53300) | 3057 (38.0~ 20300) | — | 3800 (2600~5000) | 16711 (100~130400) | |
| Surface water | Australia | 12.8 (1.00~50.0) | 443 (10.0~1500) | 428 (3.00~ 2000) | 219 (3.00~600) | 2095 (90.0~4100) | 2.25 (1.00~4.00) |
| Bangladesh | 2.64 (0.10~16.7) | — | 2.27 (0.04~ 17.2) | — | — | 2.74 (0.05~13.5) | |
| China | 648 (0.01~447000) | 3339 (0.003~ 1793000) | 1071 (0.01~ 893000) | 1371 (0.03~218100) | 17.0 (0.06~300) | 25.6 (0.03~1042) | |
| EU | 48.3 (0.25~793) | 276 (1.50~4390) | 46.3 (0.25~ 544) | — | — | — | |
| India | 109 (0.10~991) | 141948 (0.16~ 6500000) | 383 (0.40~ 4000) | 14.9 | 14.6 (0.18~29.1) | 46.0 (0.02~130) | |
| Indonesia | 71.8 (1.00~399) | — | 88.7 (1.00~ 779) | 3.00 (1.00~8.00) | — | — | |
| Japan | 32.4 (0.002~560) | 52.1 (0.50~ 4068) | 12.1 (0.01~ 151) | — | — | — | |
| Korea | 98.3 (1.10~2190) | 87.6 (20.0~151) | 248 (0.70~ 14850) | 686 (11.3~2750) | — | 38.4 (27.1~53.8) | |
| Malaysia | 78.4 (0.60~166) | 193 (112~267) | 34.7 (1.20~ 102) | — | 2.00 (1.00~3.00) | 20.9 (16.6~23.1) | |
| Singapore | 494 (0.70~1949) | 3496 | 371 (2.60~ 1172) | 4040 (1233~6434) | 3746 | 20730 | |
| Thailand | 1881 (1.00~21442) | 1839 (9.00~ 45600) | 430 (0.76~ 4605) | 1422 (2.00~6290) | — | — | |
| USA | 0.5 (0.0003~15.0) | 75.7 (0.0006~ 1227) | 12.8 (0.004~ 520) | 171 (0.67~690) | 22.9 (2.71~43.1) | 4.94 (0.0021~68.0) | |
| Vietnam | 459 (0.10~55097) | 3947 (0.10~ 85190) | 1746 (0.012~ 252082) | 94.5 (0.90~900) | 556 (10.0~5051) | 25.0 (3.00~83.0) | |
| Groundwater and tap water | China | 63.3 (0.01~2910) | 15.2 (0.10~368) | 3.09 (0.02~120) | 10.9 (0.03~127) | — | 5.62 (0.13~36.7) |
| EU | 7.2 | 29.6 (1.00~ 77.2) | 6.1 | — | — | — | |
| India | 0.17 (0.11~0.24) | 726 (0.05~ 14000) | 14.7 (0.22~ 55.0) | 0.18 | — | 0.09 | |
| Japan | — | — | 12.1 (4.40~ 29.0) | — | — | — | |
| USA | — | 81.4 (1.09~ 1740) | 26.8 (2.48~ 178) | — | — | — |
Note:The data in the table represents "average (minimum - maximum)". |
表4 常见的数据库清单信息Table 4 Available database and lists for emerging contaminant |
| database | quantity/types | website |
|---|---|---|
| NORMAN | 111769 | www.norman-network.com/?q=node/236 |
| REACH2017 | 68679 | zenodo.org/record/4248826 |
| US EPA Chemicals Dashboard | ~800 000(311 sub-lists) | comptox.epa.gov/dashboard/chemical_lists |
| IECSC | 45612 | www.mee.gov.cn/gkml/hbb/bgg/201301/t20130131_245810.htm |
| TSCA | 86718 | www.epa.gov/tsca-inventory/how-access-tsca-inventory |
| Tox21 | 7632 | ncats.nih.gov/tox21 |
| ToxCast | 5231 | comptox.epa.gov/dashboard/chemical_lists/CHEMIN |
表5 常见转化产物清单生成平台Table 5 Available software to generate transformation products |
| software | predicted transformation categories | website |
|---|---|---|
| EAWAG-PPS | microbial metabolism | eawag-bbd.ethz.ch/predict/ |
| enviPath | microbial metabolism | envipath.org/ |
| Biotransformer | microbial and mammalian metabolism | biotransformer.ca |
| Meteor Nexus | mammalian metabolism | www.lhasalimited.org/ |
| CTS | microbial metabolism,abiotic transformation | qed.epa.gov/cts/ |
| QSAR Toolbox | microbial and mammalian metabolism、abiotic transformation | qsartoolbox.org/ |
表6 室内暴露实验测定的不同碳链全氟羧酸在鱼不同组织中的生物浓缩因子(log BCF)Table 6 Bioconcentration factors of PFCAs of different carbon chains in different tissues of fish as measured by indoor exposure experiments |
Compounds | Silver carp | Grass carp | Rainbow trout | Fathead minnow | ||||||||
|---|---|---|---|---|---|---|---|---|---|---|---|---|
| Muscle | Liver | Kidney | Blood | Bile | Muscle | Liver | Kidney | Blood | Bile | |||
| PFBA | 1.5 | 2.0 | 1.9 | 2.3 | 1.7 | 1.7 | 2.1 | 2.2 | 2.7 | 1.7 | ||
| PFPeA | 1.0 | 1.8 | 1.8 | 1.8 | 2.5 | 1.1 | 1.4 | 1.9 | 1.8 | 2.0 | -0.2 | |
| PFHxA | 1.7 | 2.6 | 2.8 | 2.5 | 2.5 | 1.4 | 2.7 | 2.9 | 2.6 | 2.5 | -0.2 | |
| PFHpA | 1.8 | 2.6 | 2.8 | 2.8 | 2.7 | 2.1 | 2.6 | 2.8 | 2.8 | 2.8 | -0.2 | |
| PFOA | 1.3 | 1.7 | 1.7 | 2.1 | 2.0 | 1.2 | 1.8 | 1.9 | 2.4 | 2.1 | 0.6 | 0.3 |
| PFNA | 2.8 | 3.5 | 3.5 | 3.9 | 3.6 | 2.5 | 3.5 | 3.6 | 4.1 | 3.7 | ||
| PFDA | 3.4 | 4.1 | 4.2 | 4.5 | 3.6 | 3.6 | 4.4 | 4.5 | 5.1 | 3.9 | 2.7 | |
| PFUnDA | 3.4 | |||||||||||
| PFDoDA | 3.8 | 5.1 | 5.2 | 5.5 | 4.2 | 4.1 | 5.3 | 5.5 | 6.0 | 4.4 | 4.3 | |
| PFTrDA | 4.1 | 5.3 | 5.5 | 5.7 | 4.4 | 4.2 | 5.4 | 5.6 | 6.1 | 4.6 | ||
| PFTeDA | 3.8 | 5.0 | 5.1 | 5.4 | 4.6 | 3.7 | 4.9 | 5.1 | 5.6 | 4.8 | 4.4 | |
表7 多介质模型汇总Table 7 Summary of multimedia models |
| Model Name | Steady state/ Dynamic | Method | Scale | Existing studies applications | Medium | Source of literature |
|---|---|---|---|---|---|---|
| QWASI | Dynamic | Fugacity | Regional scale (lake and river systems) | Polycyclic aromatic hydrocarbons, antibiotics, per- and polyfluoroalkyl substances, microplastics | Air, water, soil, sediment | 627⇓⇓⇓⇓⇓⇓~634 |
| MUM(SO-MUM) | Dynamic | Fugacity | Regional scale (urban system) | Polychlorinated biphenyls, polybrominated diphenyl ethers, phthalates, organophosphate esters | Air, upper air, soil, vegetation, surface water, sediment, organic film | 635⇓⇓⇓⇓~640 |
| MUM-Fate | Steady state | Fugacity | Regional scale (urban system) | Polycyclic aromatic hydrocarbons | Low-layer and upper-air, surface water, sediments, soil, vegetation, and organic films covering impervious surfaces | 641 |
| BETR/BETR-Urban-Rural/BETR North America/BETR Global/Evn-BETR | Steady-state/dynamic | Fugacity | Global, continental, and regional scales | Toxaphene, γ-hexachlorocyclohexane (lindane), polybrominated diphenyl ethers, polycyclic aromatic hydrocarbons, hexachlorobenzene, decabromodiphenyl ether, polychlorinated biphenyls, perfluorooctane sulfonate, pentadecafluorooctanesulfonic acid, decamethylcyclopentasiloxane (D5) | Air (high-altitude, low-altitude), vegetation, soil, freshwater, freshwater sediment, seawater, marine sediment (BETR-UR urban soil, rural soil, urban air, rural air) | 642⇓⇓⇓⇓⇓⇓⇓⇓~651 |
| Globo-POP | Dynamic | Fugacity | Global scale | Toxicfens, polychlorinated biphenyls, polybrominated diphenyl ethers, DDT, α-hexachlorocyclohexane | Air, water, soil, sediment | 652⇓~654 |
| POPsME | Dynamic | Fugacity | Regional scale | Polycyclic aromatic hydrocarbons, polychlorinated dibenzo-p-dioxins/dibenzofurans | Air, water, soil, sediment | 655,656 |
| ChemRange | Steady state | Fugacity | Global scale | Polychlorinated biphenyls | Air, soil, water | 657,658 |
| ChemCAN | Steady state | Fugacity | Regional scale | 2,2',5,5'-Tetrachlorobiphenyl (PCB 52), tetrachloroethylene, polychlorinated biphenyls, α-hexachlorocyclohexane, benzene [apyrene, hexachlorobenzene, atrazine | Air, water, soil, sediment | 659 |
| CHEMFrance | Steady state | Fugacity | regional scale | γ-hexachlorocyclohexane (lindane), atrazine | Air, surface water, soil, bed sediments, groundwater, coastal water | 660⇓⇓~663 |
| CliMoChem | Dynamic | Fugacity | Global scale | Polychlorinated biphenyls, carbon tetrachloride, α-hexachlorocyclohexane, endrin, atrazine | Air, water, soil | 657,664⇓ ~666 |
| ChimERA | Dynamic | Fugacity | Universal model | Polychlorinated biphenyls (PCBs), polybrominated diphenyl ethers (PBDEs) | Water, sediment, large plants, total suspended particulates, dissolved organic matter | 667,668 |
| EQC | Steady state | Fugacity | Regional scale | Polychlorinated biphenyls, hexachlorobenzene | Air, soil, water, sediment | 669 |
| TaPL3 | Steady state | Fugacity | regional scale | Polychlorinated biphenyls (PCBs), hexachlorobenzene (HCB) | Air, soil, water, sediment | 670 |
| CoZMo-POP 2 | Dynamic | Fugacity | regional scale | POPs | Air, forest canopy, forest soil, soil, water, sediment | 671,672 |
| NEM (based on CoZMo-POP 2 and BETR-Global) | Dynamic | Fugacity | Global scale | Polychlorinated biphenyls | Air, water, soil, sediment, vegetation | 673 |
| G-CIEMS | Dynamic | Fugacity | continental scale | Benzene, dioxin, 1,3-butadiene, etc. Herbicide | Air, fresh water, forest canopy, soils under seven land-use types, sea water, and sediments | 674,675 |
| PeCHREM | Dynamic | Fugacity | continental scale | Pesticide | Air, water, soil | 676,677 |
| DynAPlus | Dynamic | Fugacity | Regional scale | Insecticide, fungicide | Air, waste, soil, water | 678,679 |
| CHEMGL | Steady state/ Dynamic | Fugacity | continental and regional scales | Atrazine, benzopyr [a]pyrene, benzene, hexachlorobenzene | Stratosphere, troposphere, air boundary layer, surface water and sediments, soil, vegetation, groundwater | 680 |
| SoilFug | Dynamic | Fugacity | regional scale | Herbicides (acetochlor, terbutryn, and thiobencarb) and insecticides (atrazine, carbofuran, dimethoate, isoproturon, γ-hexachlorocyclohexane (lindane), semiamidines and trifluralin) | Soil and surface water | 681⇓~683 |
| SoilPlus | Dynamic | Fugacity | Universal model | Pesticide | Air, soil, water | 684,685 |
| RSEMM | Dynamic | Fugacity | Regional scale (Beijing-Tianjin river system) | Antibiotics | Air, water, soil, sediment | 686 |
| SMURF | Steady state | Fugacity | Regional scale (urban system) | Polybrominated diphenyl ethers, phthalates | Air, water, soil, sediments, urban surfaces, indoor air, indoor vertical surfaces including ceiling and floor | 687,688 |
| IMPACT North America/IMPACT 2002 | Steady state | Fugacity | continental and regional scales | Pentachlorodibenzofuran, polycyclic aromatic hydrocarbons, hexachlorobenzene | Air, water, soil, sediment, vegetation | 689 |
| Pangea | Steady state | Concentration | continental scale | Triclosan, anionic surfactant linear alkylbenzene sulfonate, preservative methyl paraben for personal care products, skin conditioner decamethylcyclopentasiloxane | Air, freshwater sediment, seawater, freshwater, natural land, and farmland | 690,691 |
| SimpleBox (updated to v4.0) | Steady state/ Dynamic | concentration | Global, continental, and regional scales | Polychlorinated biphenyls, α-hexachlorocyclohexane, benzo[apyrene | Air, freshwater and seawater, freshwater and seawater sediments, natural, agricultural and other soils | 692⇓⇓~695 |
| SimpleBox4Nano/SimpleBox4Plastic(SB4P) | Dynamic | Concentration | Global, continental, and regional scales | Nanoplastics and microplastics | Air, surface water, sediment, soil | 696 |
| ELPOS | Steady state | concentration | Regional scale | Polybrominated diphenyl ethers, polycyclic aromatic hydrocarbons, polychlorinated biphenyls | Air, soil, water, vegetation, sediment | 697 |
| SESAMe/SESAMe-Veg | Steady state | Concentration | continental and regional scales | PPCPs, organophosphates, benzene [apyrene, acenaphthene, triclosan, dibenzofuran | Air, fresh water, sediments, three soils, and two vegetation types | 698⇓⇓~701 |
| MAMI | Dynamic | Activity | General-purpose model | Pesticide (2,4-dichlorophenoxyacetic acid), aromatic amine aniline, antibiotics (trimethoprim, TMP) | Air, three types of soil, fresh water, sea water, fresh water sediment, and sea water sediment | 702 |
表8 传统有机磷酸酯(T-OPEs)基本信息Table 8 Basic information of conventional OPEs(T-OPEs) |
| classification | English name | Chinese name | abbreviation | CAS | scheme |
|---|---|---|---|---|---|
| Alkanes OPES | Trimethyl phosphate | Trimethyl phosphate | TMP | 512-56-1 | 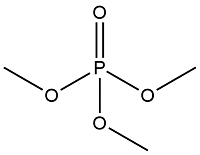 |
| Triethyl phosphate | Triethyl phosphate | TEP | 78-40-0 | 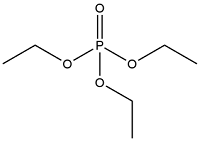 | |
| Tripropyl phosphate | Tricresyl phosphate | TPrP | 513-08-6 | 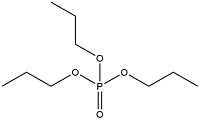 | |
| Triisopropyl Phosphate | Triisopropyl phosphate | TIPP | 513-02-0 |  | |
| Alkanes OPES | Tributyl phosphate | Tributyl phosphate | TnBP | 126-73-8 |  |
| Triisobutyl phosphate | Triisobutyl phosphate | TIBP | 126-71-6 |  | |
| Tris(2-butoxyethyl) phosphate | Tris(2-butoxyethyl) phosphate | TBOEP | 78-51-3 |  | |
| Tris(2-ethylhexyl) phosphate | Tris(2-ethylhexyl) phosphate | TEHP | 78-42-2 | 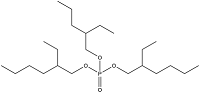 | |
| Chlorination OPEs | Tris(2-chloroethyl) phosphate | Tris(2-chloroethyl) phosphate | TCEP | 115-96-8 | 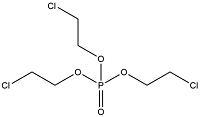 |
| Tris(2-chloroethyl) phosphate | Tris(2-chloroethyl) phosphate | TCEP | 115-96-8 |  | |
| Tri(2-chloroisopropyl) phosphate | Tris-(2-chloroisopropyl) phosphate | TCIPP | 13674-84-5 | 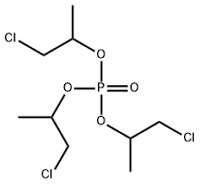 | |
| Tris(1,3-dichloro-2-propyl) phosphate | Tris(1,3-dichloro-2-propyl) phosphate | TDCIPP | 13674-87-8 | 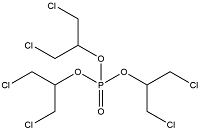 | |
| Aromatic OPEs | Triphenyl phosphate | Triphenyl phosphate | TPhP | 115-86-6 |  |
| Tritolyl phosphate | Tricresyl phosphate | TCrP | 1330-78-5 |  | |
| 2-Ethylhexyl diphenyl phosphate | Diphenyl isoctyl phosphate | EHDPP | 1241-94-7 |  |
表9 新型有机磷酸酯(NOPEs)基本信息Table 9 Basic information of novel OPEs (NOPEs) |
| Classification | English name | Chinese name | abbreviation | CAS number | scheme |
|---|---|---|---|---|---|
| 2,2-Bis(chloromethyl)trimethylene bis(bis(2-chloroethyl) phosphate) | Bis[(2-chloroethyl) phosphate] of 2,2-bis(hydroxymethyl)-1,3-propanediol | V6 | 38051-10-4 |  | |
| Halogenated OPEs | Tris(2,3-dibromopropyl) phosphate | Tris-(2,3-dibromopropyl) phosphate | TDBPP | 126-72-7 | 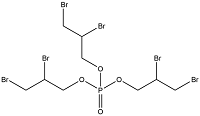 |
| Tris(tribromoneopenthyl)phosphate | Tris(tr bromoneopentyl)phosphate | TTBP | 19186-97-1 | 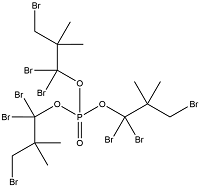 | |
| Cresyl diphenyl phosphate | Diphenyl p-tolyl phosphate | CDP | 26444-49-5 | 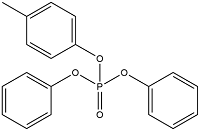 | |
| Aromatic OPEs | 2-Isopropylphenyl Diphenyl Phosphate | Diphenyl phosphate of 2-isopropylphenyl | IPDP | 64532-94-1 | 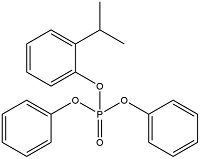 |
| Naphthalen-2-yl diphenyl phosphate | Phosphoric acid 2-naphthyl diphenyl ester | NAPHP | 18872-49-6 | 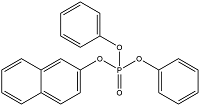 | |
| tert-butylphenyl diphenyl phosphate | Tertiary butylated diphenyl phosphate | BPDP | 56803-37-3 | 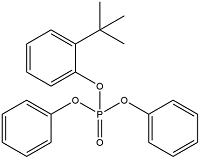 | |
| Isodecyl diphenyl phosphate | Isodecyl phenylphosphate | IDPP | 29761-21-5 | 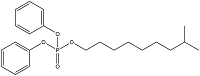 | |
| Bis(2-ethylhexyl) phenyl phosphate | Diphenyl bis(2-ethylhexyl) phosphate | BEHPP | 16368-97-1 | 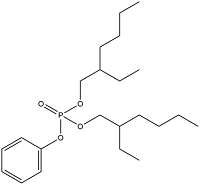 | |
| 2-Biphenylylphenyl phosphate | Phosphoric acid 2-phenyldiphenyl ester | BPDPP | 132-29-6 | 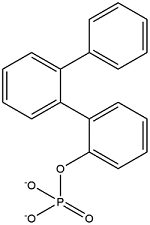 | |
| Bis(2-isopropylphenyl) Phenyl Phosphate | Diphenyl(2-isopropylphenyl) phosphate | RBDPP | 69500-29-4 | 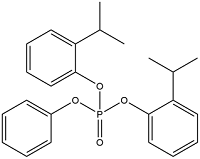 | |
| Bis(4-Tert-Butylphenyl) Phenyl Phosphate | Diphenyl(4-tert-butylphenyl)phosphate | B4TBPPP | 115-87-7 | 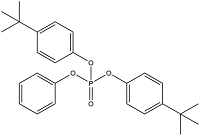 | |
| Tris(2-isopropylphenyl) phosphate | Tris(2-propylphenyl) phosphate | TIPPP | 64532-95-2 | 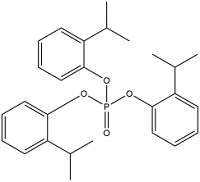 | |
| Tri-(4-Tert-Butylphenyl) Phosphate | Tris( p - tert - butylphenyl ) phosphate | TBPP | 78-33-1 |  | |
| Resorcinol bis(diphenylphosphate) | Resorcinol tetrakis (diphenyl phosphate) | RDP | 57583-54-7 |  | |
| Tris(2,4-di-tert-butylphenyl) phosphate | Tris(2,4-di-tert-butylphenyl)phosphate | TDtBPP | 95906-11-9 |  | |
| Bisphenol-A bis (diphenyl phosphate) | Bisphenol A bis(diphenyl phosphate) | BPA-BDPP | 5945-33-5 |  |
表10 2018—2023年有机磷酸酯在室内粉尘和大气环境中的分布情况Table 10 Distribution of OPEs in indoor dust and atmospheric environments, 2018—2023 |
| environmental medium | country or region | minimum value | maximum value | main OPEs | ref | |
|---|---|---|---|---|---|---|
| indoor dust | China | Guangzhou | 3040 ng/g | 47240 ng/g | TDCIPP, TEHP, TCIPP, TPhP, EHDPP, BPA-BDPPa | 857 |
| Northeastern region | 700 ng/g | 9536 ng/g | TEP, TEHP, TCEP, TCIPP, TDCIPP, EHDPP | 858 | ||
| East China Region | 293 ng/g | 7150 ng/g | TEHP, TCEP, TCIPP, TDCIPP | |||
| North China Region | 958 ng/g | 7915 ng/g | TEHP, TCEP, TDCIPP, TCIPP | |||
| South and Central China | 702 ng/g | 8900 ng/g | TEHP, TCEP, TCIPP | |||
| Northwest region | 364 ng/g | 5060 ng/g | TCEP, TCIPP, TDCIPP, TPhP | |||
| Southwest China | 900 ng/g | 3700 ng/g | TCEP, TCIPP, TDCIPP | |||
| Greece | 2034 ng/g | 189962 ng/g | TDCIPP, TCIPP, TBOEP, TPhP | 859 | ||
| United Kingdom | 19911 ng/g | 1099519 ng/g | EHDPP, TCEP, TBOEP, TPhP, TCIPP, TDCIPP | 860 | ||
| Nepal | 153 ng/g | 12100 ng/g | TCIPP, TPhP, EHDPP | 861 | ||
| Global | China | 149 ng/g | 4740 ng/g | TCEP, TPhP | 862 | |
| Columbia | 54.6 ng/g | 8130 ng/g | TBOEP, TCIPP, TPhP | |||
| Greece | 1690 ng/g | 90200 ng/g | TnBP, TBOEP, TCEP, TCIPP, | |||
| India | 52.5 ng/g | 9650 ng/g | TBOEP, TEHP, TDCIPP | |||
| Japan | 7720 ng/g | 238000 ng/g | TBOEP, TCEP, TCIPP, TDCIPP, | |||
| South Korea | 3090 ng/g | 249000 ng/g | TBOEP, TCEP, TCIPP, TPhP, IDDPa | |||
| Kuwait | 633 ng/g | 44400 ng/g | TBOEP, TCEP, TCIPP, TDCIPP, | |||
| Pakistan | 49.4 ng/g | 473 ng/g | TBOEP, TPhP | |||
| Romania | 775 ng/g | 54900 ng/g | TnBP,TBOEP, TCEP, TCIPP, TPhP | |||
| Saudi Arabia | 791 ng/g | 35000 ng/g | TBOEP, TCEP, TCIPP, TDCIPP, TPhP | |||
| United States | 1930 ng/g | 101000 ng/g | TBOEP, TCEP, TCIPP, TDCIPP, TPhP | |||
| Vietnam | 228 ng/g | 79600 ng/g | TBOEP, TCIPP, TPhP, RDPa | |||
| United States | 22690 ng/g | 736300 ng/g | TBOEP, TDCIPP, TCIPP, TPhP, BPDPPa | 857 | ||
| atmosphere | China | 1228 ng/g | 612668 ng/g | TPhP, TCEP, TCIPP, TDBPP | 863 | |
| Northeastern region | 257 ng/g | 2630 ng/g | TCEP, TCIPP, TDCIPP | 858 | ||
| East China Region | 99.8 ng/g | 5960 ng/g | TCEP, TCIPP, TDCIPP, TPhP | |||
| North China Region | 140 ng/g | 4070 ng/g | TCEP, TCIPP | |||
| South and Central China | 154 ng/g | 5700 ng/g | TCEP, TCIPP, TDCIPP, TnBP | |||
| Northwest region | 120 ng/g | 1030 ng/g | TCEP, TCIPP, TDCIPP | |||
| Southwest China | 147 ng/g | 972 ng/g | TCEP, TCIPP, TEHP | |||
| Hong Kong | 1294 pg/m3 | 8481 pg/m3 | TCIPP, TDCIPP, TnBP, TBOEP | 864 | ||
| Guangzhou | 4.01 ng/m3 | 75.2 ng/m3 | TCIPP, TPhP | 865 | ||
| Taiyuan | 3.1 ng/m3 | 544 ng/m3 | TCEP, TCIPP, TBP | |||
| Guangzhou | 262 pg/m3 | 421914 pg/m3 | TCEP, TCIPP, TnBP, RDPa | 866 | ||
| Pearl River Delta | 91 pg/m3 | 2055 pg/m3 | TCEP, TCIPP, TnBP,TDCIPP | 867 | ||
| United States of America | The Great Lakes | 41.2 pg/m3 | 1320 pg/m3 | TCIPP, TnBP, TEHP, TCEP | 868 | |
| United States of America | New York | 1320 pg/m3 | 20700 pg/m3 | TCEP, TCIPP, TDCIPP, TPhP, EHDPP | 869 | |
| Antarctica | 164.82 pg/m3 | 3501.79 pg/m3 | TCIPP, TCEP | 870 | ||
| Arctic | 231.56 pg/m3 | 1884.25 pg/m3 | TCIPP, TCEP | 871 | ||
Note:a for NOPEs |
表11 2018—2023年OPEs在水环境及生物体中的蓄积情况Table 11 Accumulation of OPEs in aquatic environment and organisms, 2018—2023 |
| medium | country or region | minimum concentration | maximum concentration | main OPEs | ref | ||
|---|---|---|---|---|---|---|---|
| Water environment | |||||||
| Surface water | China | 602 ng/L | 9030 ng/L | TEP, TCIPP | 884 | ||
| the middle and lower reaches of the Yellow River | 97.66 ng/L | 2433 ng/L | TEP, TCEP, TCIPP, TDCIPP | 885 | |||
| Taihu Lake | 100 ng/L | 1700 ng/L | TEP | 886 | |||
| Nanjing | 4.36 ng/L | 195269 ng/L | TDCIPP, TCEP, TDBPP | 887 | |||
| Hong Kong | 58.8 ng/L | 3090 ng/L | TCIPP, TBOEP | 888 | |||
| Yangtze River Basin | 27.9 ng/L | 2531 ng/L | TEP, TCIPP, TCEP | 889 | |||
| Tibet | 46.45 ng/L | 1744.73 ng/L | TCEP, TCIPP | 890 | |||
| Chongqing | 24.8 ng/L | 65 ng/L | TnBP, TCIPP, TCEP, TBOEP | 891 | |||
| Chengdu | 19.1 ng/L | 533 ng/L | TCEP, TCIPP, TBOEP | 892 | |||
| United States of America | 35 ng/L | 290 ng/L | TDCIPP, TBOEP, TPhP | 880 | |||
| Arctic Ocean | 6 pg/L | 440 pg/L | TCEP, TCIPP | 924 | |||
| Vietnam | 46 ng/L | 3644 ng/L | TCIPP | 881 | |||
| Canada | 2.9 ng/L | 67 ng/L | TEHP, TCIPP, TCEP | 883 | |||
| Mediterranean Sea | 9 ng/L | 1013 ng/L | TCIPP, TCEP | 882 | |||
| Sediment | China | Taihu Lake | 12.8 ng/g(dw) | 9250 ng/g(dw) | TEHP, TDtBPPa, TCIPP | 894,895 | |
| Liao River | 19.7 ng/g(dw) | 234 ng/g(dw) | TnBP, TBOEP | 896 | |||
| the middle and lower reaches of the Yellow River | 47.33 ng/g(dw) | 234 ng/g(dw) | TCEP, TCIPP, TEP | 885 | |||
| Pearl River estuary | 23.5 ng/g(dw) | 187 ng/g(dw) | TCEP, TCIPP, TPhP | 897 | |||
| Nigeria | 13.1 ng/g(dw) | 2110 ng/g(dw) | TBOEP | 893 | |||
| Organism | |||||||
| Aquatic life Matter | China | South China Sea | Plankton | 660 ng/g(dw) | 922 ng/g(dw) | TCIPP, TCEP, TBOEP | 898 |
| Taihu Lake | Plankton | 9.4 ng/g(dw) | 10.8 ng/g(dw) | TEHP, TPhP, TCrPa | 899 | ||
| Laizhou Bay | Benthopelagic fish | 833 ng/g(dw) | 3150 ng/g(dw) | Alkane-type OPEs | 900 | ||
| Mesopelagic fish | 296 ng/g(dw) | 2120 ng/g(dw) | Alkane-based OPEs | ||||
| Pearl River Delta | Shrimp | 32.1 ng/g(dw) | 102 ng/g(dw) | TCIPP, TBOEP, TDCIPP | 902 | ||
| Crab | 30.3 ng/g(dw) | 88.4 ng/g(dw) | TCIPP, TBOEP, TDCIPP, EHDPP | ||||
| Fish | 8.35 ng/g(dw) | 40.9 ng/g(dw) | TCIPP, TBOEP, TDCIPP, TCP | ||||
| Plankton | 660 ng/g(dw) | 922 ng/g(dw) | TCIPP, TCEP, TBOEP | ||||
| Taihu Lake | Grass carp | 1.61 ng/g(ww) | 7.66 ng/g(ww) | TDtBPPa | 904 | ||
| Crucian carp | 2.11 ng/g(ww) | 13.2 ng/g(ww) | TDtBPPa | ||||
| Common carp | 0.833 ng/g(ww) | 6.95 ng/g(ww) | TDtBPPa | ||||
| Bighead carp | 2.87 ng/g(ww) | 7.75 ng/g(ww) | TDtBPPa | ||||
| Silver carp | 3.7 ng/g(ww) | 32.3 ng/g(ww) | TDtBPPa, TBOEP | ||||
| Canada | The Great Lakes | Lake trout | 122 ng/g(ww) | 905 | |||
| Antarctica | Cod | 173 ng/g(lw) | TCEP, TDCIPP | 906 | |||
| Dolphin | 907 | ||||||
| Muscle | 69.5 ng/g(lw) | 2939 ng/g(lw) | TBOEP, IDPPa | ||||
| Liver | 9.7 ng/g(lw) | 712 ng/g(lw) | TBOEP, EHDPP, IDPPa | ||||
| Spain | Kidney | nd | 789 ng/g(lw) | TBOEP | |||
| Adipose tissue | 27.2 ng/g(lw) | 2450 ng/g(lw) | TCIPP, TBOEP | ||||
| Brain | nd | 24729 ng/g(lw) | TCIPP,TBOEP,TnBP,IDPPa,IPPPa | ||||
| Western Indian Ocean | Dolphin | 1630 ng/g(lw) | 31861 ng/g(lw) | TBOEP | 908 | ||
| Iceland | Rorqual | 31.9 ng/g(lw) | 10232 ng/g(lw) | IPPPa, TnBP, TPPO | 909 | ||
| China | Pearl River Delta | Snakehead fish | 50 ng/g(lw) | 829 ng/g(lw) | TEHP, TCIPP, TCEP | 901 | |
| Tilapia | 145 ng/g(lw) | 1086 ng/g(lw) | TEHP, TCIPP, TCEP | ||||
| Schilbe mystus | 133 ng/g(lw) | 2321 ng/g(lw) | TEHP, TCIPP, TCEP | ||||
| North Canal River | Loach | 309 ng/g(lw) | 1973 ng/g(lw) | TCIPP, TCEP, TnBP | 903 | ||
| Crucian carp | 274 ng/g(lw) | 1042 ng/g(lw) | TCIPP,TCEP,TnBP,TEHP,TPhP | ||||
| Ricefish | 265 ng/g(lw) | 1586 ng/g(lw) | TnBP, TCIPP, TEHP | ||||
| Lives wildlife Matter | China | Upper and middle reaches of the Yangtze River | Egret-Egg | 18 ng/g(ww) | 185 ng/g(ww) | TnBP, TIBPa, TCIPP | 912 |
| United States of America | The Great Lakes | Bald Eagle | 913 | ||||
| Egg | 4.76 ng/g(ww) | 760 ng/g(ww) | TCIPP, TnBP, TPhP | ||||
| Serum | 2.68 ng/g(ww) | 16.9 ng/g(ww) | TCIPP, TnBP | ||||
| Latin America and Uganda | Primate feces | 78 ng/g(lw) | 1200 ng/g(lw) | TBOEP, TCIPP | 914 | ||
| Human body | China | Hangzhou | Maternal serum | 3.3 ng/mL | 51.4 ng/mL | TCEP, TCIPP, TPhP | 918 |
| Mianyang | 1.66 ng/mL | 23.8 ng/mL | TnBP, TCEP, TPhP | ||||
| Hubei | Maternal blood | 1.06 ng/mL | 59.6 ng/mL | TCrP, TIBP, TnBP, TCIPP | 919 | ||
| Umbilical cord blood | nd | 45.5 ng/mL | TCrP, TIBP, TnBP, TCIPP | ||||
| Jinan | Serum of the elderly | 0.923 ng/mL | 26.55 ng/mL | TnBP, TPhP, TCIPP | 921 | ||
| Beijing | Breast milk | 14.2 ng/mL | 59.2 ng/mL | EHDPP, TPhP, V6a | 922 | ||
| United States of America | 0.67 ng/mL | 7.83 ng/mL | TIBPa, TnBP, TBOEP | 923 | |||
Note:a are NOPEs |
图29 2023年之前发表的纳入和排除研究的流程图。在Web of Science上用于搜索的关键词包括“花粉、花蜜或蜂蜜”和“新型烟碱类化合物”,研究数量显示在括号中Fig. 29 Flow diagram of included and excluded studies published prior to 2023.Keywords used to search in the Web of Science included“Pollen, Nectar, or Honey”and “Neonicotinoid”. The numbers of studies are shown in parentheses |
表12 7种新型烟碱类化合物的CAS号、化学结构式、无可见有害作用水平(LOAEL)及相对应的相对效价因子(RPF)Table 12 CAS numbers, Chemical structures, No observed adverse effect levels (LOAELs) and Relative potency factors (RPF) of 7 neonicotinoid insecticides |
| CAS Number | Neonicotinoid | Chemical structure | LOAEL/[mg/(kg·d)] | RPF | |
|---|---|---|---|---|---|
| 135410-20-7 | Acetamiprid (ACE) | Acetamiprid |  | 17.5 | 0.97 |
| 210880-92-5 | Clothianidin (CLO) | thiamethoxam |  | 31.2 | 0.54 |
| 165252-70-0 | Dinotefuran (DIN) | Dinotefuran |  | 991 | 0.001 |
| 138261-41-3 | Imidacloprid (IMI) | Imidacloprid |  | 16.9 | 1.00 |
| 111988-49-9 | Thiacloprid (THIAC) | Thiamethoxam |  | 2.5 | 6.76 |
| 153719-23-4 | Thiamethoxam (THIAM) | Thiamethoxam |  | 1.8 | 9.39 |
| 105843-36-5 | Imidaclothiz (IMID) | Chlorfenapyr |  | — | 1.00 |
表13 在全球范围内研究中不同蜜源作物花粉中六种新型烟碱类农药残留概述及IMIRPF值Table 13 Overview of neonicotinoids in pollen reported in the peer-review literature and the calculated IMIRPF |
| Location | N sample7 | Compound (Mean or Range) | LOQ8/ (ng/g) | IMIRPF9/ (ng/g) | ref10 | |||||||
|---|---|---|---|---|---|---|---|---|---|---|---|---|
| Continent | Country | IMI1 | THIAM2 | ACE3 | CLO4 | THIAC5 | DIN6 | |||||
| Asia | China | 22 | 20.12 | -11 | 4.36 | 3.93 | — | 9.41 | 0.6~1.5(LOD) | 26.48 | 1053 | |
| China | 483 | 20.3 | 39.6 | ND | ND | ND | ND | 0.47~2.13 | 392.14 | 1025 | ||
| China | 69 | ND~3.2 | ND~2.03 | ND~3.26 | ND~0.28 | ND~1.56 | ND~2.9 | 0.031~0.074 | 0~36.12 | 1016 | ||
| Thailand | 6 | 22 | — | — | — | — | — | 1 | 22.00 | 1054 | ||
| 3 | ND12 | — | — | — | — | — | (LOD) | 0.00 | ||||
| 11 | 3.9 | — | — | — | — | — | 3.90 | |||||
| Africa | Egypt | 33 | 6.15 | 12.35~15.50 | 13.63 | 4.53 | — | 7.61 | 0.1~2.1 | 137.79~167.37 | 1055 | |
| Europe | U.K. | 13 | ND | ≤0.1213 | — | ≤0.12 | 0.06±0.22 | — | 0.12~0.48 | 0.5814 | 1021 | |
| 13 | ND | ≤0.12 | — | 0.16±0.58 | 0.15±0.36 | — | 1.27 | |||||
| 19 | ≤0.16 | 0.58±1.64 | — | ≤0.10 | 1.47±4.41 | — | 15.42 | |||||
| 23 | ≤0.16 | 4.96±11.29 | — | ≤0.12 | 0.08±0.31 | — | 47.15 | |||||
| 7 | 0.31±0.82 | ≤0.12 | ≤0.04 | ND | 1.34±3.52 | — | 9.54 | |||||
| 13 | ND | ≤0.12 | ND | ND | ND | — | 0.17 | |||||
| 11 | ND | ND | ≤0.04 | ND | ≤0.04 | — | 0.05 | |||||
| 11 | 1.13±3.34 | ≤0.12 | 0.14±0.42 | ND | ≤0.04 | — | 1.48 | |||||
| 22 | ≤0.16 | ≤0.12 | ≤0.04 | ND | ≤0.04 | — | 0.24 | |||||
| U.K. | 11 | <0.36 | 5.7 | <0.02 | 3.8 | 19 | — | 0.07~2.2 | 184.07 | 1023 | ||
| 8 | <0.36~<1.1 | 2.8 | <0.02 | <0.72 | 0.6 | — | 30.46~30.57 | |||||
| 10 | <0.36 | 0.13 | <0.02 | 0.5 | 0.3 | — | 3.58 | |||||
| 25 | 0.2 | 0.15 | <0.02~<0.07 | <0.72~<2.2 | 0.9 | — | 7.75~7.88 | |||||
| 19 | <0.36~<1.1 | <0.12~<0.36 | <0.02 | <0.72 | <0.07 | — | 0.36~0.80 | |||||
| U.K. | 18 | 6.9±16 | 11.0±16 | 0.45±0.23 | 11.0±9.3 | 0.78±1.1 | — | 0.14~5.9 | 121.84 | 1056 | ||
| Greece | 10 | 72 | ND | ND | 6.1~69.04 | ND | — | 0.2~0.6 | 75.29~109.28 | 1057 | ||
| 4 | 73.9 | 14.4 | ND | 308.3~1273 | <0.4 | — | 376.00~896.94 | |||||
| Germany | 16 | ND | — | ND | ND | 2 | — | 0.1~2.0 | 13.52 | 1058 | ||
| 39 | ND | — | 3.42 | ND | 42.37 | — | 289.74 | |||||
| 24 | ND | — | 2.08 | 0.425 | 99.8 | — | 676.90 | |||||
| 22 | ND | — | ND | ND | 18.13 | — | 122.56 | |||||
| 30 | ND | — | ND | ND | 43.18 | — | 291.90 | |||||
| 20 | 0.11 | — | ND | ND | 57.4 | — | 388.13 | |||||
| 9 | ND | — | ND | ND | 3.24 | — | 21.90 | |||||
| 20 | ND | — | 1.76 | ND | 24.94 | — | 170.30 | |||||
| 12 | 0.17 | — | ND | 0.24 | 55.18 | — | 373.32 | |||||
| 19 | ND | — | ND | ND | 21.94 | — | 148.31 | |||||
| 27 | ND | — | ND | ND | 26.68 | — | 180.36 | |||||
| 16 | ND | — | 0.13 | ND | ND | — | 0.13 | |||||
| 27 | ND | — | ND | ND | 17.7 | — | 119.65 | |||||
| Ireland | 12 | — | — | — | <0.13 | ND | — | 0.07~0.29 | 0.02 | 1033 | ||
| 8 | — | — | — | ND | 4.43±0.06 | — | 29.95 | |||||
| Italian | 238 | 2 | 2 | — | — | — | — | 0.25 | 20.78 | 999 | ||
| 152 | 2 | 1 | — | — | — | — | 11.39 | |||||
| 164 | 2 | 1 | — | — | — | — | 11.39 | |||||
| Italy | <67 | 17.9~32 | ND | 10.5~33.1 | ND | 6±2 | — | 5.69~6.12 | 104.67~64.11 | 1059 | ||
| Luxembourg | 154 | 0.44~0.79 | 0.36~0.84 | — | 0.39~1.40 | 0.57~133.05 | — | 0.28~0.42 | 7.88~908.85 | 1060 | ||
| Poland | 53 | 3.1 | ND | — | — | 61.3 | — | 0.8~8.9 | 417.49 | 1061 | ||
| N. Am15 | Canada | 6 | 4.96 | — | — | — | — | — | 0.02~0.063 | 4.96 | 1062 | |
| 6 | 18.4 | — | — | — | — | — | (LOD) | 18.40 | ||||
| Canada | 86 | 6.0±7.2 | 6.5±2.0 | 9.9±9.2 | — | 1.4 | — | ND | 86.10 | 1063 | ||
| USA | 219 | <0.1~43.1 | <0.1~2.5 | <0.1~4.36 | <0.1~8.09 | <0.1~40.8 | <0.1~4.94 | 0.1 | 0.28~350.99 | 1021 | ||
| USA | 38 | 2.5 | 53.9 | ND | 17.3 | — | — | 2 | 517.96 | 1064 | ||
| 35 | 3.9 | ND | ND | ND | — | — | (LOD) | 3.90 | ||||
| 31 | 2.9 | 3.9 | 1.6 | 4.4 | — | — | 43.45 | |||||
| USA | 170 | 0.41±0.05 | 3.65±0.36 | — | 0.80±0.05 | — | — | 0.33 | 35.12 | 1065 | ||
| 144 | 1.37±0.17 | 2.30±0.13 | — | 1.24±0.08 | — | — | 23.64 | |||||
| USA | 13 | 0.2~2.2 | ND | ND | ND | 0.1~0.3 | ND | 0.1 | 0.88~4.23 | 1032 | ||
| USA | 25 | 1.2 | 2.1 | 14.3 | — | — | ND | 0.2~0.5 | 34.79 | 1066 | ||
| 24 | 1.1 | 2.6 | 2.1 | — | — | 0.4 | 27.55 | |||||
| USA | 32 | ND | ND | 27 | ND | ND | — | 0.5~20 | 26.19 | 1067 | ||
| USA | 275 | 1.66 | — | 1.09 | — | 0.52 | — | 1~2 | 6.23 | 1068 | ||
| 273 | 8.6 | — | ND | — | ND | — | 1 | 8.60 | ||||
| 190 | 5.79 | — | ND | — | 1.1 | — | 13.23 | |||||
| 124 | 2.8 | — | ND | — | ND | — | 2.80 | |||||
| USA | 7 | 0.4~2.3 | ND | ND | ND | ND | ND | 0.1~0.5 | 0.40~2.30 | 1069 | ||
| Oceania | New Zealand | 6 | 0.2~1.2 | ND | ND | 0.2~2.6 | 0.1~3.3 | ND | 0.1~0.5 | 0.98~24.91 | 1069 | |
Note:1.Imidacloprid; 2. Thiamethoxam; 3. Acetamiprid; 4. Clothianidin; 5. Thiacloprid; 6. Dinotefuran; 7. Number of samples; 8. Limit of Quantitation; 9. Imidacloprid equivalent relative potency factor(ng/g); 10. Reference; 11. Not mentioned in the references cited; 12. No detected; 13. Less than limit of quantitation (LOQ); 14. Calculated using 1/2LOD for data less than LOQ; 15. North America. |
表14 在全球范围内文献中报道的花蜜中六种新型烟碱类农药残留概述及IMIRPF值Table 14 Overview of neonicotinoids in nectar reported in the peer-review literature and the calculated IMIRPF. |
| Location | N sample | Compound (Mean or Range) | LOQ/ (ng/g) | IMIRPF/(ng/g) | ref | ||||||
|---|---|---|---|---|---|---|---|---|---|---|---|
| Continent | Country | IMI | THIAM | ACE | CLO | THIAC | DIN | ||||
| Asia | China | 34 | 2.40 | ND | 7.81 | 2.16 | ND | 2.83 | 0.6~1.5 | 11.14 | 1053 |
| China | 391 | 30.3 | 31.2 | 16.9 | — | — | — | 0.80~2.37 | 339.66 | 1025 | |
| Europe | U.K. | 8 | ND | ≤0.10 | ND | ND | ND | — | 0.08~0.4 | 0.14 | 1021 |
| 7 | ND | 0.26±0.68 | ND | ND | ND | — | 2.44 | ||||
| 14 | ≤0.14 | ≤0.10 | ND | ND | ND | — | 0.17 | ||||
| 13 | ND | 0.2±0.51 | ND | ND | ND | — | 1.88 | ||||
| 5 | ≤0.10 | 0.76±1.52 | ND | ND | ND | — | 7.15 | ||||
| 13 | ND | ≤0.10 | ND | ND | ND | — | 0.14 | ||||
| 10 | ND | ≤0.10 | ND | ND | ND | — | 0.14 | ||||
| 12 | ND | ND | ≤0.14 | ND | 0.05±0.13 | — | 0.36 | ||||
| 19 | ND | ≤0.10 | ≤0.14 | ND | 0.09±0.15 | — | 0.77 | ||||
| Europe | Ireland | 12 | — | — | — | < 0.09~0.95 | ND | — | 0.09 | 0.01~0.51 | 1033 |
| 8 | — | — | — | < 0.09 | ND | — | 0.01 | ||||
| N. Am | USA | 224 | 0.85 | 1 | 1.08 | ND | 0.52 | — | 1~2 | 14.80 | 1068 |
| 264 | 0.53 | ND | ND | ND | ND | — | (LOD) | 0.53 | |||
| 193 | 0.62 | ND | ND | ND | ND | — | 0.62 | ||||
| 87 | ND | ND | ND | ND | ND | — | 0.00 | ||||
表15 在全球范围内文献中报道的蜂蜜中6种新型烟碱类农药残留概述及IMIRPF值Table 15 Overview of neonicotinoids in honey reported in the peer-review literature and the calculated IMIRPF |
| Location | N sample | Compound (Mean or Range) | LOQ/ (ng/g) | IMIRPF/ (ng/g) | ref | ||||||||
|---|---|---|---|---|---|---|---|---|---|---|---|---|---|
| Continent | Country | IMI | THIAM | ACE | CLO | THIAC | DIN | ||||||
| Asia | Azerbaijan | 1 | <0.03 | <0.02 | <0.008 | <0.03 | <0.002 | — | 0.008~0.03 | 0.04 | 1000 | ||
| Burma | 2 | 0.021~0.135 | <0.02~0.092 | <0.008~0.084 | <0.03~0.044 | <0.002 | — | 0.008~0.03 | 0.05~1.11 | ||||
| China | 3 | <0.03~0.151 | <0.02~0.298 | <0.008~0.89 | <0.03 | <0.002~0.094 | — | 0.008~0.03 | 0.04~4.45 | ||||
| China | 639 | 5.01 | 1.75 | 4.78 | 4.36 | 0.896 | — | 0.1~0.15 | 34.49 | 1040 | |||
| China | 483 | 1.8~21.5 | 2.0~55.9 | 2.0~64.2 | ND | ND | — | 0.67~2.22 | 22.52~608.68 | 1025 | |||
| China | 10 | ND~2.59 | ND~0.63 | ND | ND~0.14 | ND | ND~1.71 | 0.031~0.074 | 8.58 | 1016 | |||
| India | 3 | <0.03~0.171 | <0.02~0.044 | <0.008~0.109 | <0.03 | <0.002 | — | 0.008~0.03 | 0.04~0.69 | 1000 | |||
| Indonesia | 6 | <0.03~0.037 | <0.02~0.046 | <0.008 | <0.03 | <0.002 | — | 0.008~0.03 | 0.04~0.47 | ||||
| Iran | 2 | 0.081~0.089 | <0.02 | <0.008~0.057 | <0.03 | <0.002 | — | 0.008~0.03 | 0.11~0.18 | ||||
| Israel | 2 | 2.516~2.652 | <0.02 | 0.011~0.443 | <0.03 | 0.064~0.375 | — | 0.008~0.03 | 2.99~5.65 | ||||
| Israel | 2 | 0.7~0.8 | ND | 0.2 | ND | ND | ND | 0.1~0.5 | 0.89~0.99 | 1069 | |||
| Japan | 3 | 0.030~2.198 | <0.02~1.195 | 0.125~21.786 | 0.018~1.829 | <0.002~0.002 | — | 0.008~0.03 | 0.19~35.55 | 1000 | |||
| Lebanon | 2 | 0.037~0.041 | <0.02~0.020 | 0.019~0.231 | <0.03 | <0.002 | — | 0.008~0.03 | 0.09~0.46 | ||||
| Malaysia | 1 | 0.095 | <0.02 | <0.008 | <0.03 | <0.002 | — | 0.008~0.03 | 0.13 | ||||
| Nepal | 2 | 0.047~0.635 | 0.026~0.095 | <0.008~0.524 | <0.03 | <0.002 | — | 0.008~0.03 | 0.30~2.04 | ||||
| Philippines | 1 | <0.03 | <0.02 | <0.008 | <0.03 | <0.002 | — | 0.008~0.03 | 0.04 | ||||
| Saudi Arabia | 2 | 0.086~0.148 | <0.02~0.061 | 0.045~0.405 | <0.03 | <0.002 | — | 0.008~0.03 | 0.16~1.12 | ||||
| Sri Lanka | 1 | <0.03 | <0.02 | <0.008 | <0.03 | <0.002 | — | 0.008~0.03 | 0.04 | ||||
| Thailand | 2 | 0.182~0.383 | <0.02~0.117 | 0.049~0.501 | <0.03 | <0.002 | — | 0.008~0.03 | 0.26~1.97 | ||||
| Turkey | 2 | <0.03~0.124 | <0.02 | 0.080~0.788 | <0.03 | <0.002~0.660 | — | 0.008~0.03 | 0.11~5.38 | ||||
| Vietnam | 1 | 0.079 | 0.111 | <0.008 | <0.03 | <0.002 | — | 0.008~0.03 | 1.13 | ||||
| Yemen | 2 | <0.03 | <0.02~0.099 | <0.008~0.041 | <0.03 | <0.002 | — | 0.008~0.03 | 0.04~0.98 | ||||
| Africa | Burkina Faso | 1 | <0.03 | <0.02 | <0.008 | 0.099 | 0.003 | — | 0.008~0.03 | 0.11 | |||
| Cameroon | 2 | <0.03 | 0.067~0.598 | <0.008 | <0.03 | <0.002 | — | 0.008~0.03 | 0.64~5.63 | ||||
| Central African Republic | 1 | <0.03 | <0.02 | <0.008 | <0.03 | <0.002 | — | 0.008~0.03 | 0.04 | ||||
| Egypt | 2 | <0.03~0.159 | <0.02 | <0.008~0.102 | <0.03 | <0.002 | — | 0.008~0.03 | 0.04~0.29 | ||||
| Egypt | 45 | 0.5~1.7 | ND~18.8 | 1.7~4.9 | ND | ND | — | 0.1~2 | 178.68~192.38 | 1070 | |||
| Egypt | 37 | 0.87 | 18.84 | 4.5 | ND | — | 0.57 | 0.1~2.1 | 182.14 | 1055 | |||
| Eritrea | 1 | <0.03 | <0.02 | <0.008 | <0.03 | <0.002 | — | 0.008~0.03 | 0.04 | 1000 | |||
| Ethiopia | 1 | <0.03 | 0.046 | <0.008 | <0.03 | <0.002 | — | 0.008~0.03 | 0.44 | ||||
| Ghana | 2 | <0.03~0.029 | <0.02~0.027 | <0.008 | <0.03 | <0.002 | — | 0.008~0.03 | 0.04~0.29 | ||||
| Ivory Coast | 1 | <0.03 | 0.097 | <0.008 | <0.03 | <0.002 | — | 0.008~0.03 | 0.92 | ||||
| Kenya | 3 | <0.03 | <0.02~0.080 | <0.008 | <0.03 | <0.002~0.003 | — | 0.008~0.03 | 0.04~0.78 | ||||
| Madagascar | 3 | <0.03 | <0.02~0.033 | <0.008 | <0.03 | <0.002 | — | 0.008~0.03 | 0.04~0.32 | ||||
| Morocco | 3 | <0.03~0.104 | <0.02 | <0.008~0.066 | <0.03 | <0.002 | — | 0.008~0.03 | 0.04~0.20 | ||||
| Mozambique | 2 | <0.03~0.096 | <0.02 | <0.008 | <0.03 | <0.002 | — | 0.008~0.03 | 0.04~0.13 | ||||
| Nigeria | 1 | <0.03 | 0.211 | <0.008 | <0.03 | <0.002 | — | 0.008~0.03 | 1.99 | ||||
| Guinea | 1 | <0.03 | <0.02 | <0.008 | <0.03 | <0.002 | — | 0.008~0.03 | 0.04 | ||||
| Malawi | 1 | 0.328 | 0.142 | <0.008 | 0.091 | <0.002 | — | 0.008~0.03 | 1.71 | ||||
| Senegal | 2 | <0.03 | 0.136~0.411 | <0.008 | <0.03 | <0.002 | — | 0.008~0.03 | 1.29~3.87 | ||||
| South Africa | 2 | 2.388~2.445 | <0.02 | <0.008 | <0.03 | <0.002 | — | 0.008~0.03 | 2.42~2.48 | ||||
| Tanzania | 2 | <0.03~0.166 | <0.02 | <0.008 | <0.03 | <0.002 | — | 0.008~0.03 | 0.04~0.20 | ||||
| Tunisia | 1 | 0.072 | <0.02 | 0.139 | <0.03 | 0.5 | — | 0.008~0.03 | 3.62 | ||||
| Uganda | 1 | <0.03 | 0.047 | <0.008 | <0.03 | <0.002 | — | 0.008~0.03 | 0.45 | ||||
| Europe | Austria | 32 | ND | <0.6 | 2.2~15.2 | ND | 5.0~27.4 | ND | 0.6~2.0 | 36.78~200.81 | 1071 | ||
| 9 | ND | ND | ND | ND | <0.6~2.1 | ND | 0.6~2.0 | 0.61~14.20 | |||||
| Belgium | 1 | 0.280 | 0.266 | 2.898 | 0.134 | 15.458 | — | 0.008~0.03 | 110.16 | 1000 | |||
| Bulgaria | 2 | <0.03 | <0.02~0.033 | <0.008~0.128 | <0.03 | <0.002~0.259 | — | 0.008~0.03 | 0.04~2.19 | ||||
| Croatia | 1 | 0.075 | 0.03 | 0.015 | <0.03 | 0.194 | — | 0.008~0.03 | 1.69 | ||||
| Cyprus | 1 | <0.03 | <0.02 | 0.056 | <0.03 | 0.087 | — | 0.008~0.03 | 0.68 | ||||
| Czech Republic | 2 | 0.054~0.055 | 0.083~0.252 | 0.864~1.126 | 0.029~0.037 | 1.307~5.874 | — | 0.008~0.03 | 10.52~43.24 | ||||
| England | 2 | <0.03~0.0168 | <0.02~0.350 | <0.008~0.512 | <0.03~0.216 | <0.002 | — | 0.008~0.03 | 0.04~3.92 | ||||
| Finland | 1 | <0.03 | <0.02 | <0.008 | <0.03 | <0.002 | — | 0.008~0.03 | 0.04 | ||||
| France | 12 | <0.03~0.301 | <0.02~0.038 | <0.008~0.445 | <0.03 | <0.002~0.770 | — | 0.008~0.03 | 0.04~6.30 | ||||
| Georgia | 1 | 0.021~0.135 | <0.02 | 0.013 | <0.03 | 0.012 | — | 0.008~0.03 | 0.15~0.26 | ||||
| Germany | 2 | <0.03 | <0.02 | <0.008~4.579 | 0.197~0.951 | 0.647~46.767 | — | 0.008~0.03 | 4.51~321.13 | ||||
| Greece | 3 | <0.03~0.029 | <0.02 | <0.008 | <0.03 | <0.002 | — | 0.008~0.03 | 0.04~0.06 | ||||
| Greece | 5 | ND | ND | ND | ND | ND | — | 0.4~1.1 | 0.00 | 1057 | |||
| 1 | ND | ND | ND | ND | ND | — | 0.00 | ||||||
| Hungary | 1 | <0.03 | <0.02 | 0.688 | 0.051 | 3.378 | — | 0.008~0.03 | 23.56 | 1000 | |||
| Irish | 30 | 11 | ND | ND | <3 | <3 | ND | 3 | 14.29 | 1041 | |||
| Italy | 4 | <0.03~1.199 | ND~0.021 | <0.008~0.080 | <0.03 | <0.002~1.677 | — | 0.008~0.03 | 0.01~12.81 | 1000 | |||
| Latvia | 1 | <0.03 | 0.136 | <0.008 | 0.421 | 0.142 | — | 0.008~0.03 | 2.47 | ||||
| Liechstenstein | 1 | <0.03 | 0.035 | <0.008 | 0.421 | <0.002 | — | 0.008~0.03 | 0.56 | ||||
| Lithuania | 1 | <0.03 | 0.291 | <0.008 | 0.197 | 0.019 | — | 0.008~0.03 | 2.97 | ||||
| Norway | 1 | 0.074 | <0.02 | <0.008 | <0.03 | 0.647 | — | 0.008~0.03 | 4.48 | ||||
| Poland | 2 | 0.05~0.153 | 0.087~1.420 | 1.583~29.312 | <0.03~0.128 | 0.704~25.340 | — | 0.008~0.03 | 7.16~213.29 | ||||
| Portugal | 3 | <0.03~0.149 | ND~<0.02 | <0.008 | <0.03 | <0.002~0.012 | — | 0.008~0.03 | 0.01~0.26 | ||||
| Macedonia | 1 | <0.03 | <0.02 | <0.008 | <0.03 | <0.002 | — | 0.008~0.03 | 0.04 | ||||
| Romania | 2 | 0.081~0.104 | <0.02~0.030 | 0.380~0.442 | <0.03 | 0.001~0.066 | — | 0.008~0.03 | 0.49~0.82 | ||||
| Russia | 6 | <0.030.108 | <0.02~0.048 | <0.008~0.087 | <0.03 | <0.002~0.006 | — | 0.008~0.03 | 0.04~0.69 | ||||
| Slovakia | 2 | <0.03 | <0.02~0.390 | <0.008 | <0.03~0.106 | 0.157~8.263 | — | 0.008~0.03 | 1.1~59.58 | ||||
| Slovenia | 1 | <0.03 | <0.02 | <0.008 | <0.03 | 0.010 | — | 0.008~0.03 | 0.10 | ||||
| Slovenia | 60 | — | ND | ND | — | <0.005~0.018 | — | 0.005 | 0.01~0.12 | 1072 | |||
| Slovenia | 51 | ND | ND | <0.008~2.0 | ND | <0.06~9.6 | — | 0.19~2.84 | 0.06~66.84 | 1073 | |||
| Spain | 7 | <0.03~0.529 | ND~0.065 | <0.008~0.255 | <0.03 | <0.002~0.026 | — | 0.008~0.03 | 0.01~1.56 | 1000 | |||
| Switzerland | 3 | <0.03 | <0.02~0.123 | <0.008~0.008 | <0.03~0.327 | <0.002 | — | 0.008~0.03 | 0.04~1.35 | ||||
| U.K. | 21 | 0.05 | 0.1 | — | 0.28 | — | — | 0.10~0.38 | 1.14 | 1074 | |||
| 109 | 0.03 | 0.04 | — | 0.11 | — | — | 0.06~0.17 | 0.47 | |||||
| U.K. | 22 | <0.1 | ND | <0.01~0.70 | <0.02~0.74 | ND | ND | 0.01~0.1 | 0.02~1.09 | 1075 | |||
| Ukraine | 1 | 0.036 | <0.02 | <0.008 | <0.03 | 0.997 | — | 0.008~0.03 | 6.81 | 1000 | |||
| N. Am | Canada | 7 | <0.03~0.043 | 0.125~1.280 | <0.008~0.061 | 0.069~0.932 | <0.002~0.060 | — | 0.008~0.03 | 1.22~13.03 | |||
| Curaçao | 1 | 0.035 | <0.02 | 0.016 | <0.03 | <0.002 | — | 0.008~0.03 | 0.08 | ||||
| Mexico | 3 | <0.03~0.610 | <0.02~0.040 | <0.008~0.021 | <0.03 | <0.002 | — | 0.008~0.03 | 0.04~1.01 | ||||
| United States | 15 | <0.03~6.325 | <0.02~2.674 | <0.008~0.034 | <0.03~0.917 | <0.002 | — | 0.008~0.03 | 0.04~31.96 | ||||
| USA | 8 | 0.1~1.3 | 0.4 | ND | 0.1~0.5 | ND | ND | 0.1~0.5 | 3.91~10.73 | 1069 | |||
| USA | 53 | <0.1~14.7 | <0.1~0.5 | <0.1~0.3 | <0.1 | <0.1~0.1 | <0.1~14.5 | 0.1 | 0.28~20.38 | 1017 | |||
| Oceania | Australia | 7 | <0.03~0.091 | <0.02~0.045 | <0.008 | <0.03 | <0.002~0.190 | — | 0.008~0.03 | 0.04~1.80 | 1000 | ||
| Fiji | 1 | <0.03 | <0.02 | <0.008 | <0.03 | <0.002 | — | 0.008~0.03 | 0.04 | ||||
| France (New Caledonia) | 1 | <0.03 | <0.02 | <0.008 | <0.03 | <0.002 | — | 0.008~0.03 | 0.04 | ||||
| New Zealand | 4 | <0.03~0.071 | <0.02~0.344 | <0.008~0.034 | <0.03 | <0.002~0.018 | — | 0.008~0.03 | 0.04~3.46 | ||||
| Niue | 1 | <0.03 | <0.02 | <0.008 | <0.03 | <0.002 | — | 0.008~0.03 | 0.04 | ||||
| S. Am | Peru | 3 | <0.03~1.618 | <0.02~0.103 | <0.008~2.573 | <0.03 | <0.002~0.003 | — | 0.008~0.03 | 0.04~5.10 | |||
| Uruguay | 1 | 0.076 | 0.091 | 0.009 | <0.03 | 0.023 | — | 0.008~0.03 | 1.10 | ||||
| Argentina | 4 | <0.03~0.398 | <0.02~0.077 | <0.008~0.016 | <0.03~0.032 | <0.002~0.200 | — | 0.008~0.03 | 0.04~2.51 | ||||
| Brazil | 8 | <0.03~1.114 | <0.02~0.282 | <0.008 | <0.03~0.048 | <0.002 | — | 0.008~0.03 | 0.04~3.79 | ||||
| Chile | 2 | <0.03 | <0.02~0.271 | <0.008 | <0.03 | <0.002 | — | 0.008~0.03 | 0.04~2.55 | ||||
| Colombia | 1 | <0.03 | <0.02 | <0.008 | <0.03 | <0.002 | — | 0.008~0.03 | 0.04 | ||||
| Costa Rica | 2 | <0.03 | <0.02 | <0.008 | <0.03 | <0.002 | — | 0.008~0.03 | 0.04 | ||||
| Peru | 3 | <0.03~1.618 | <0.02~0.103 | <0.008~2.573 | <0.03 | <0.002~0.003 | — | 0.008~0.03 | 0.04~5.10 | ||||
| Uruguay | 1 | 0.076 | 0.091 | 0.009 | <0.03 | 0.023 | — | 0.008~0.03 | 1.10 | ||||
图30 2023年之前出版的纳入本综述数据分析的论文在每个出版年份中的数量分布图。图中,P表示花粉,H表示蜂蜜,N表示花蜜Fig. 30 The distribution of the number of the number of peer-review literatures published before 2023 that were included in the data analysis of this review is shown. In the figure, P means pollen, H means honey, and N means nectar. |
图31 在世界范围内所研究的花粉、蜂蜜和花蜜中新型烟碱类化合物的总分布。图中括号内数字分别表示各洲花粉、蜂蜜和花蜜的样本量。参考文献及数据在Table 13~15中。地图审批号:GS(2014)2081,引用时仅进行颜色的改动未对洲边界线进行改动Fig. 31 Distributions of total neonicotinoid insecticides in pollen, honey, and nectar reported in studies conducted worldwide. Which (n=a:b:c) means (n=number of pollen samples: number of honey samples: number of nectar samples).References were included in Tables 13~15 |
表16 PPCPs 在分子水平的毒理效应Table 16 Toxicity effect of PPCPs in molecular level |
| Classification | Species | PPCPs chemicals and effective concentration | Toxicity effect | ref |
|---|---|---|---|---|
| Enzyme effect | Clams | Caffeine (50 μg/L) | AChE acetylcholinesterase activity decreased by 56% | 1076 |
| Carbamazepine (0. 1 μg/L) | AChE acetylcholinesterase activity decreased by 56% | |||
| Clams | Fluoxetine (1 μg/L & 5 μg/L) | Acetylcholinesterase (AChE) activity decreased significantly | 1077 | |
| Groundwater microorganism | Tetracycline (10 μg/L) | Decreased denitrifying enzyme activities at the protein level | 1078 | |
| Daphnia magna | Indomethacin (1 mg/L); Ibuprofen (1 mg/L) | Reduced feeding rate and modulated activities of key enzymes like Alkalineand acid phosphatases, lipase, peptidase, β-galactosidase, and glutathione Stransferase | 1079 | |
| Chlorella vulgaris, Desmodesmus armatus. | Bisoprolol (100 mg/L), Ketoprofen (100 mg/L) | Regulation of antioxidant enzyme activity and chlorophyll content | 1080 | |
| Male rabbits | Codeine (4 mg/kg) | Elevated testicular enzymes inhibit testosterone levels and circulation in the testicles | 1083 | |
| Rat | Tramadol (40mg /kg); Codeine (80 mg/kg) | Induces malondialdehyde/nitrite production and superoxide dismutase (SOD) deficiency | 1082 | |
| Vigna radiata | Levofloxacin (≥50 mg/L) | The activity of nitrate reductase decreased significantly, and the activity of antioxidant oxidase increased | 1084 | |
| Mytilus galloprovincialis | Propranolol (11 μg/L); Acetaminophen (23 & 403 μg/L) | Modulates antioxidant enzyme activity | 1081 | |
| Protein synthesis induction | Vallisneria natans | Sulfadiazine (-) | Alternation of α- and β-D-glucopyranose polysaccharides and the increased content of autoinducer peptides and N-acylated homoserine lactones | 1102 |
| Human ovarian granulosa cells | Triclosan (0~10 μmol/L) | TCS increased estradiol and progesterone levels with upregulated steroidogenesis gene expression | 1087 | |
| Groundwater microorganism | Tetracycline (10 μg/L) | Decreased the concentration of electron donors (nicotinamide adenine dinucleotide, NADH), electron transport system activity, at the protein level | 1078 | |
| Rat | Oxytetracycline (200 mg/kg) | Erum urea and creatinine increased significantly, and creatinine clearance decreased | 1103 | |
| Chlorococcum sp | Triclosan (100 μmol/L) | Affect algae primarily by inhibiting fatty acid synthesis and causing protein aggregation | 1088 | |
| Medaka (Oryzias latipes) | Methylparaben (630 μg/L & 10 μg/L) | Induction of significant vitellogenin in male medaka at 630 μg/L, the expression levels of genes encoding proteins such as choriogenin and vitellogenin increased in concentrations (10 μg/L) | 1085 | |
| Danio rerio | Galaxolide (HHCB) (0.005 mmol/L) | Cause an increase in total triiodothyronine (TT3) and a significant decrease in total tetraiodothyronine (TT4) | 1086 | |
| DNA damage | Danio rerio | Ethylparaben (20 mg/L) | Inhibition of gene expression related to myocardial contraction | 1095 |
| Oxidative stress and antioxidation | Human | Sulfamethoxazole (40 μmol/L) | Significantly reduced the low level of TAthione, resulting in decreased immunity | 1096 |
| Rat | Triclocarban (300 nmol/L) | Non-protein mercaptan (glutathione) was significantly reduced | 1097 | |
| Amino acid | Tonalid (500 μmol/L) | Acts as a photosensitizer to significantly increase photo-induced oxidative damage to amino acids. | 1100 | |
| Rat hepatocytes | Acetaminophen (10 mmol/L 24 h) | Decreased the levels of both intracellular ATP and GSH, and GSH-conjugated APAP (APAP-GSH) were formed. | 1098 | |
| Mytilus galloprovincialis | Propranolol (11 μL); Acetaminophen (23 & 403 μg/L) | Induces oxidative stress | 1081 | |
| Brachionus rotundiformis | Acetaminophen, oxytetracycline | Production of reactive oxygen species (ROS) and increased glutathione S-transferase activity trigger oxidative stress | 1099 | |
| Danio rerio | Fluoxetine (5、16 and 40 ng/L) | Resulted in elevated levels of protein carbonyl content (PCC) and hydrogen peroxide (HPO) in various organs of Danio rerio, including the liver, gut, brain, and gills, following oxidize proteins and alter their functionality by forming new low molecular weight aggregates through oxidative stress. | 1101 | |
| Others | Rat | Benzophenone-2 (100 mg/kg) | Significant reduction in testosterone levels and an increase in 17β-estradiol levels in the blood | 1089 |
| Rat | Benzophenone-2 | Reduces circulation of triiodothyronine (T3) and thyroxine (T4) | 1090 | |
| Gobiocypris rarus | Alprazolam (10 ng/L) | Interfering effect of GPC, CHOP, Met and other neurosubstances | 1092 | |
| Lorazepam (100 ng/L) | Interfering effect of Cho, 5-HT, Trp, 5-HIAA and other neurosubstances | |||
| Oryzias latipes | Fluoxetine (100~500 μg/L 28 d exposure) | Affects estradiol concentrations in fish. | 1091 | |
| Chlorella pyrenoidosa | Diclofenac (>100 mg/L) | Alteration of chlorophyll a, lipid accumulation, and antioxidant enzyme function, thereby affecting growth | 1094 | |
| Mytilus galloprovincialis | Ibuprofen (250 ng/L) | Affects the arachidonic pathway | 1093 |
表17 PPCPs 在细胞和亚细胞水平的毒理效应Table 17 Toxicity effect of PPCPs in cellular and subceullar level |
| Classification | Organism | Species | PPCPs chemicals and Effective concentration | Toxicity effect | ref |
|---|---|---|---|---|---|
| Cellular level | Mammal | Human | Catecholamines | Damage heart muscle cells and increase the risk of heart attack | 1104 |
| Aminophenylsulfone (0.5 mmol/L) | Cause epidermal keratinocyte death | 1096 | |||
| Caffeine (1 mmol/L) | Abrogates the cell cycle arrest and increases cell death | 1105 | |||
| Musk xylene (10, 100, and 1000 μg/L) | Cause some irregular fusiform, protuberances and multinucleated cells, indefinite cell proliferation, ability of anchorage-independent proliferation and increase of migration and invision | 1106 | |||
| Rat | 17β-Estradiol (10~50 mg/kg) | Central lobular hepatocyte hypertrophy | 1107 | ||
| Fish | Danio rerio | Caffeine (25 μmol/L) | Induced significant hair cell damage during gestation period | 1108 | |
| Enrofloxacin (10 μg/L, 100 μg/L) | Significant reductions in macrophage and neutrophil populations and biomarkers of immunosuppressive effects | 1109 | |||
| Tetracycline (100 μg/L) | Neutrophil counts were significantly reduced in offspring zebrafish | 1110 | |||
| Grass carp | Enrofloxacin (50, 100 and 200 μg/mL) | Increased the lactic dehydrogenase release and malondialdehyde concentration, induced cell apoptosis, reduced the mitochondrial membrane potential | 1120 | ||
| Algae | Chlorella vulgaris, Desmodesmus | Chlorella vulgaris, desmodesmus (100 mg/L) | Regulation of cell morphology | 1080 | |
| Raphidocelis subcapitata | Sulfamethoxazole (8.3 μmol/L) | Inhibited growth by causing a decrease in cellular energy allocation (CEA) | 1112 | ||
| Microalgae | PPCPs | Cause the stress in microalgal cells, thereby altering cellular composition | 1111 | ||
| Invertebrate | Clam | Amoxicillin (400 μg/L) | Cause extracellular acidosis | 1113 | |
| Corbicula fluminea | Sulfamethoxazole (1, 10 and 100 μg/L) | Enhance cell apoptosis | 1114 | ||
| Manila Clam | Caffeine (15 μg/L); Ibuprofen (10 μg/L); Carbamazepine (1 μg/L); Neomycin (1 μg/L) | Decrease in blood cell viability | 1115 | ||
| Subcellular level | Mammal | Male rabbits | Codeine (4 mg/kg) | Testicular DNA breakage and caspase-dependent apoptosis | 1083 |
| Rat | Tramadol (40 mg /kg); Codeine (80 mg/kg) | The activity of mitochondrial respiratory chain complex I was inhibited in the prefrontal cortex and midbrain of mice | 1082 | ||
| Human | Homosalate (1000 μmol/L) | Induced micronucleus formation and cleavage inducing to cells | 1116 | ||
| Triclosan (1~10 μg/mL) | Depolarizes the mitochondria and increases the rate of glucose consumption in the cells, inducing metabolic acidosis | 1117 | |||
| Plant | Duckweed | Diclofenac (1, 10, 100 and 1000 μmol/L) | Induced oxidative stress in isolated duckweed chloroplasts | 1121 | |
| Algae | Chlorella spp | Triclosan (≥0.2 mg/L) | Inhibiting the increase of photosynthetic pigment content in Chlorella cells | 1118 | |
| Invertebrate | Tetrahymena thermophilus | Triclosan (1000 μg/L) | Damaged cell membrane and affected the lysosomal activity | 1121 |
表18 PPCPs 在组织器官水平的毒理效应Table 18 Toxicity effect of PPCPs in tissue and organ level |
| Organism | Species | PPCPs chemicals and effective concentration | Toxicity effect | ref |
|---|---|---|---|---|
| Mammal | Human | 4-octylphenol (1000 μg/L) | After 1~22 days of exposure, the average testicular size decreased slightly but significantly. | 1122 |
| Rat | Benzophenone 2 (BP-2) (1000 mg/kg) | Increased uterine weight | 1123 | |
| 17β-Estradiol (10~50 mg/kg) | Diffuse Pituitary hyperplasia; breast hyperplasia: increased number of cystic follicles in the ovaries; endometrial andendometrial glandular hypertrophy | 1107 | ||
| 17β-Estradiol (-) | Uterine response: increased uterine weight due to water retention and cell proliferation | 1124 | ||
| Triclosan (30~250 mg/kg) | Decreased fatty acid synthase activity in liver and adipose tissue, inhibited fatty acid synthesis, and lowered triglyceride of serum, liver and adipose tissue | 1125 | ||
| Propranolol and atenolol (5, 10, and 20 μg/mL) | Induction of reactive oxygen species and mitochondrial damage to cardiac tissue | 1128 | ||
| Tetracycline (28.6 mg/kg) | Causing testicular dysfunction and spermatogenesis disorders in animals and humans | 1149 | ||
| Mesalazine (25, 50 and 100 μmol/L) | Triggers overproduction of mitochondrial ROS, releases cytochrome c, and causes cardiotoxic effects | 1129 | ||
| Galaxolide fragrance (HHCB) (150 mg/kg) | The liver became swollen | 1126 | ||
| Toxalide fragrance (AHTN) (100 mg/kg) | Increased liver weight and liver injury was formed | 1127 | ||
| Birds | Domestic fowl | Diclofenac (9.8 mg/kg) | Showed signs of gout with deposits of urates in the kidney, liver, heart and spleen | 1130 |
| Fish | Danio rerio | Triclosan (40~400 μg/L) | Increased pericardial effusion and changes in heart structure in fish | 60 |
| PPCPs (10 μg/L) | The similar histomorphological changes in the gut tissues of male and female fish in terms of considerably reduced VL length and size | 1139 | ||
| PPCPs (acetaminophen, carbamazepine, gemfibrozil and venlafaxine) (0.5 μg/L and 10 μg/L) | Significant decrease in embryo yield, increased oocyte atresia in female ovaries, and histological changes in kidneys | 1138 | ||
| Astemizole (1, 4, 10 and 20 μmol/L) | Occurred blood cell accumulation, pericardial edema and no blood flow in the whole body | 1136 | ||
| PPCPs (1 and 10 μg/L) | Ibuprofen and erythromycin exhibited the highest bioaccumulation in the brain tissues of female fish | 1137 | ||
| Erythromycin (0.1, 1, 10 and 100 μg/L) | Thyroid disruption | 1140 | ||
| Sulfamethoxazole (5.6 μg/L) | Thyroid endocrine disruption | 1141 | ||
| Thifluzamide (0.019, 0.19 and 1.90 mg/L) | Decreased cholesterol and triglyceride levels, induced hepatotoxicity | 1134 | ||
| Rhamdia quelen | Diclofenac (0.2, 2 and 20 μg/L) | Hepatic & gonadal antioxidant defenses | 1131 | |
| Salmo trutta | Diclofenac (0.1~100 μg/L) | Hematopoietic toxicity | 1132 | |
| Salmo trutta | Diclofenac (5~50 μg/L) | Affect the integrity of kidneys and gills. | 1133 | |
| Gasterosteus aculeatus | Naproxen (299 and 1232 μg/L) | Increased renal hematopoietic hyperplasia | 1143 | |
| Oncorhynchus mykiss | Toxalide fragrance (AHTN) (854 and 8699 μg/kg) | Lipid peroxidation in caudal kidney tissue | 1144 | |
| Cyprinodon variegatus | Triclosan (20, 50 and 100 μg/L) | Thyroid disruption | 1142 | |
| Plant | Cucumber | PPCPs (acetaminophen, caffeine, Mirton, atenolol, trimethoprim, carbamazepine, diazepam, gemfibrozil, primidone, sulfamethoxazole, phenytoin sodium, diclofenac, naproxen, ibuprofen and atorvastatin, triclosan and triclocarban) (50 μg/L; 5 μg/L and 50 μg/L) | Increase of leaf necrosis; Root activity decreased by 15.4% and 28.2% | 1145 |
| Wheat | Oxytetracycline (0.01~0.08 mmol/L) | The fresh weights of wheat roots decreased. | 1146 | |
| barley | Tetracycline (10, 100, and 200 mg/L) | Down-regulated genes related to homologous recombination in the root meristem zone and inhibited the mitosis index | 1147 | |
| Corn | Sulfadiazine (10 mg/kg) | Promoted abnormal root apical orientation in maize | 1148 | |
| Willows | Sulfadiazine (200 mg/kg) | A large increase in the number of lateral roots |
表19 PPCPs在个体水平的毒理效应Table 19 Toxicity effect of PPCPs in individual level |
| Effects | Toxicity | Organism | Species | PPCP chemicals and effective concentration | Toxicity effect | ref |
|---|---|---|---|---|---|---|
| Sublethal effect | Acute toxicity | Algae | Pseudokirchneriella subcapitata | Methyl-paraben (80000 μg/L 72 h); Ethyl-paraben (52000 μg/L 72 h); n-propyl-paraben (36000 μg/L 72 h); i-propyl-paraben (48000 μg/L 72 h); n-butyl-paraben (9500 μg/L 73 h); i-butyl-paraben (4000 μg/L 73 h); Benzyl-paraben (1200 μg/L 74 h) | EC50 in growth inhibition | 1085⇓⇓⇓⇓⇓⇓⇓⇓⇓⇓⇓⇓⇓⇓⇓⇓⇓⇓⇓⇓⇓⇓⇓⇓⇓⇓⇓⇓⇓⇓⇓⇓⇓⇓⇓⇓⇓⇓⇓⇓⇓⇓⇓⇓⇓⇓⇓⇓⇓⇓⇓⇓⇓⇓⇓⇓⇓⇓⇓⇓⇓⇓⇓⇓~ 1150 |
| Chlorella vulgaris | Acetophenone (1000 μg/L); Benzophenone (6.855 mg/L 96 h); Diethyltoluamide (270.72 mg/L 96 h) | EC50 in growth inhibition/EC50 | 1152,1153 | |||
| Anabaena sp. | Erythromycin (0.022 mg/L 72 h); Ciprofloxacin (0.01 mg/L) | EC50 | 1154,1155 | |||
| P. subcapitata | Ciprofloxacin (2.97 mg/L 72 h) | EC50 | 1156 | |||
| Erythromycin (0.35 mg/L 72 h) | EC50 | 1154 | ||||
| Dunaliella tertiolecta | Carbamazepine (53.2 mg/L) | EC50 in growth inhibition | 1157 | |||
| Phaeodactylum tricornutum | Nano-TiO2 (167.71 mg/L) | EC50 in growth inhibition | 1158 | |||
| Ulva pertusa | Isobutylparaben (15650 μg/L 96 h) | EC50 in sporulation inhibition | 1151 | |||
| Synechococcus sp. | Erythromycin (0.23 mg/L 144 h) | EC50 | 1159 | |||
| Invertebrate | Daphnia magna | Methyl-paraben (34000 μg/L 48 h); Ethyl-paraben (7400 μg/L 48 h); n-propyl-paraben (2000 μg/L 48 h); i-propyl-paraben (3500 μg/L 48 h); n-butyl-paraben (1900 μg/L 48 h); i-butyl-paraben (3300 μg/L 48 h); Benzyl-paraben (2100 μg/L 48 h) | EC50 in the number of immobilized bodies | 1085, 1150 | ||
| Tetracycline (617.2 mg/L 48 h); Diclofenac (68.0 mg/L); Ibuprofen (101.2 mg/L); Naproxen (166.3 mg/L); Erythromycin (0.94 mg/L 48 h) | EC50 | 1160⇓~ 1162 | ||||
| Ceriodaphnia dubia | Erythromycin (0.22 mg/L 7 d); Propranolol (1.51 mg/L) | EC50 | 1163,1164 | |||
| Brachionus calyciflorus | Propranolol (2.59 mg/L) | EC50 | 1164 | |||
| Fish | Danio rerio | Ciprofloxacin (100 mg/L) | EC50 | 1165 | ||
| Pimephales promelas | Ciprofloxacin (>100 mg/L) | EC50 | ||||
| Floating plant | Lemna gibba | Chlortetracycline (114 μg/L); Lomefloxacin (38 μg/L); Sulfamethoxazole (37 μg/L) | EC25 in growth inhibition | 1166 | ||
| Reproductive toxicity | Fish | Juvenile | Estradiol (0.05~0.5 mg/kg) | Affects spawning | 1167 | |
| Diclofenac (10 mg/L) | Reduced egg hatchability | 1168 | ||||
| Ibuprofen (0.0001 mg/L) | Reduced hatchability, yolk proteins content | 1169 | ||||
| Pimephales promelas | Fluoxetine (1 μg/L) | Impacted mating behavior in male fish, specifically nest building and defending | 1171 | |||
| Fadrozole (2 μg/L 21 d exposure) | Decline in reproduction rate | 1172 | ||||
| Dicentrarchus | Estradiol (10 mg/kg) | Affect reproduction | 1170 | |||
| Invertebrate | Daphnia magna | Propranolol (0.128 mg/L) | Reduce the fecundity and reproductive rate | 1173 | ||
| Chironomus riparius | Carbamazepine (0.625 mg/kg 28 d exposure) | Inhibit pupa to be formed | 1174 | |||
| Developmental toxicity | Plant | Lactuca sativa | Erythromycin (0.1~300 mg/kg) | Inhibition of bud development | 1175 | |
| Solanum lycopersicum | Sulfadiazine (0.1~300 mg/kg) | Inhibition of bud development | ||||
| Brassica rapa chinensis | Chlortetracycline (2.5~20 mg/kg) | Inhibition of bud development | 1176 | |||
| Oenanthe javanica | Oxytetracycline (0.5~10 mg/kg) | Inhibition of plant height | 1177 | |||
| Fish | Danio rerio | Musk xylene (33 μg/L) | Significant impact in early life stages | 1178 | ||
| Muscone (33 μg/L) | Reduced fish mass and length of females and reduced fecundity | 1179 | ||||
| Amitriptyline (0.001~1000 μg/L) | Inhibition of growth and development; alteration of ACTH concentration level | 1180 | ||||
| Pimephales promelas | Propranolol (3.4 mg/L) | Reduced body weight and egg hatchability | 1181 | |||
| Algae | Scenedesmus obliquus | Ibuprofen (107.91 mg/L); aspirin (103.05 mg/L); ketoprofen (4.03 mg/L) | Inhibition of algal growth | 1182 | ||
| Amphibian species | Bufo americanus. | Acetaminophen (100 μg/L 28 d exposure) | Survival rates are affected | 1183 | ||
| Endocrine disruption | Invertebrate | Mytilus spp. | Gemfibrozil (1000 μg/L) | Endocrine disruption | 1184 | |
| Fish | Danio rerio | Galaxolide(-) | Endocrine disruption | 1086 | ||
| Neurotoxicity | Fish | Oryzias latipes | Acetaminophen (30 + 30 mg/kg, 4 h apart) | Decline in memory, learning ability and cognitive flexibility | 1186 | |
| Gambusia affinis | Fluoxetine (0.05~5 μg/L) | Sleeping time expanded | 1187 | |||
| Mammal | mice | Triclosan (1000 mg/kg, 2000 mg/kg, 4000 mg/kg) | Cause certain behavioral disorders in mice | 1185 | ||
| Amphibian species | Rana pipiens | Acetaminophen (1 μg/L 14 d of exposure) | Behavior affected | 1183 | ||
| Cardiovascular toxicity | Mammal | Human | Caffeine (-) | Correlation with cardiovascular disease (CVD) | 1188 | |
| Beagle dogs | Sibutramine (30 mg/kg) | Increasing Heart Rate and Blood Pressure in Beagles | 1189 | |||
| Lethal effect | Fish | Medaka (Oryzias latipes) | Methyl-paraben (63000 μg/L 96 h); Ethyl-paraben (14000 μg/L 96 h); n-propyl-paraben (4900 μg/L 96 h); i-propyl-paraben (4500 μg/L 96 h); n-butyl-paraben (3100 μg/L 96 h); i-butyl-paraben (4600 μg/L 96 h); Benzyl-paraben (730 μg/L 96 h) | LC50 in lethality | 1085, 1150 | |
| Danio rerio | Galaxolide (0.037 mmol/L 96 hpf); Tetracycline (406.0 mg/L 96 h); Diethyltoluamide (109.67 mg/L 96 h); Benzophenone (14.73 mg/L 96 h) | LC50 in lethality | 1086, 1153, 1160 | |||
| Carassius auratus | Ttetracycline (322.8 mg/L 96 h) | LC50 in lethality | 1160 | |||
| Invertebrate | Daphnia magna | Diethyltoluamide (40.74 mg/L 24 h); Cefoperazone (141.11 mg/L); Amoxicillin (129.3 mg/L); Aztreonam (29.3 mg/L); Benzophenone (7.63 mg/L 24 h) | LC50 in lethality | 1190 | ||
| Lumbriculus variegatus | Benzylidene-camphor (44.2 μmol/L) | Substantial reduction in fertility and significant increase in mortality | 1191 |
表20 PPCPs 在种群、群落和生态系统水平的毒理效应Table 20 Toxicity effect of PPCPs in population, community and ecosystem level |
| Classification | Species or community | PPCPs chemicals and effective concentration | Toxicity effect | ref |
|---|---|---|---|---|
| Population | Gammarus fasciatus,Psephenus herricki | Cimetidine(0.07~70 μg/L) | Reduced growth and biomass of G. fasciatus, low survivorship of P.herricki when exposed to high concentrations | 1192 |
| Millepora complanata,Stylophora pistillata,Acropora sp. | Sunscreen UV filter (10~100 μg/L 2~48 h) | Induction of coral bleaching | 1193 | |
| Algal | Triclosan(400 and 200 ng/L) | Algal growth toxicity | 1194 | |
| Crustacean | Triclosan(600 and 340 ng/L) | Crustacean reproduction toxicity | 1195 | |
| Fish,alge,daphnid | Caffeine(232 μg/L ) | RQ value of caffeine against algae was calculated to be very high, i.e., 5800, whereas against fish and daphnid, it was 25.4 and 8.2, respectively | 1196 | |
| Physa pomilia | 17α-ethynylestradiol (1.0 μg/L or 100 μg/L); Fluoxetine (1.0 μg/L or 100 μg/L) | Lower population growth rate | 1198 | |
| Perca fluviatilis) | Oxazepam (1.8 μg/L) | Alters behavior and feeding rate of wild Perca fluviatilis at concentrations encountered in effluent-influenced surface waters | 1199 | |
| Perca fluviatilis,Coenagrion hastulatum | Oxazepam (2 μg/L) | Increased predator activity of perch, no behavioral effects on mayflies (direct) | 1200 | |
| Danio rerio | Triadimefon(0.25 μg/mL,0.5 μg/mL) | Triazolone at 0.25 μg/mL had an inhibitory effect on zebrafish population and growth;The zebrafish population appeared to be androgynous after treatment at a concentration of 0.5 μg/mL | 1201 | |
| Community | Stream benthic communities | Amphetamine(1 μg/L) | Suppression of gross primary production on autotrophic biofilms, compositional shift of bacterial and biofilm communities, increased dipteran (stream insect) emergence | 1202 |
| Triclosan(0.1~10 μg/L) | Increase in abundance of triclosan resistant bacteria and stimulation of periphyton growth | 1203 | ||
| Benthic bacterial communities | Triclosan(17.3 μg/g) | Triclosan Exposure Increases Triclosan Resistance and Influences Taxonomic Composition of Benthic Bacterial Communities | 1204 | |
| Algal and invertebrate benthic communities | Fluoxetine(20 μg/L); Citalopram(20 μg/L) | Suppression of primary productivity and community respiration on biofilms (algae). Increased stream insect emergence | 1205 | |
| Algae | Caffeine(5 μg/L); Acetaminophen(5 μg/L); Diclofenac(5 μg/L) | Decreased biofilm (algal) biomass (indirect) | 1206 | |
| Helisoma trivolvis,Elimia livescens | Carbamazepine(2000 ng/L) | Change biomass | 1207 | |
| Ammonia-oxidizing Archaea | Enrofloxacin(1 μg/L) | Reducing the abundance of ammonia-oxidizing archaea in a lake system | 1208 | |
| Sediment bacterial community | Ciprofloxacin(200 μg/L) | Altering the composition of sediment bacterial communities and reducing the ability to metabolize pyrene | 1209 | |
| Chlorella vulgaris,Microcystis | Ser-HCL(25~200 μg/L) | Altered the composition of photosynthetic community | 1224 | |
| Algae | Nano-TiO2 | Decrease the abundance of Acutodesmus dimorphus, Gomphonema clavatum, and Gomphonema lagenula, and increase the abundance of Oscillatoria and Chaetophora sp. | 1210 | |
| Phytoplankton | Norfloxacin | Norfloxacin can inhibit community formation and thus reduce phytoplankton abundance. These changes can disrupt trophic relationships between zooplankton and plants | 1211 | |
| Soil microbial community | Sulfamethoxazole | When 100 mg/kg sulfamethoxazole was added for 7 d, the soil microbial population density decreased significantly (p<0.05), and the utilisation rate of sugars decreased by 20.4% | 1212 | |
| Sulfamethazine; Sulfamethoxazole;Chlortetracycline;Tetracycline;Tylosin | The maximum inhibition of soil microbial respiration by sulfadiazine, sulfamethoxazole, chlortetracycline, tetracycline, tylosin, and methicillin reached 34.3%, 34.4%, 2.71%, 3.08%, 7.13%, and 38.1% | 1213 | ||
| Difloxacin | Soil denitrification rates were inhibited by 10 mg/kg of difloxacin, and this inhibition lasted for more than 30 days, suggesting that the presence of difloxacin altered the function of the soil microbial community | 1214 | ||
| Oxytetracycline | 5 μmol/L oxytetracycline or 20 μmol/LCu alone can reduce the diversity of soil microbial populations by about 25% and 15%, respectively | 1215 | ||
| Ecosystem | Amphetamine;Methamphetamine; Ketamine;Ephedrine; Cocaine;Benzoylecgonine; Methadone;Morphine; Heroin;Codeine; Methcathinone, etc | 11 drugs and their metabolites were detected in the water samples, with RQs ranging from 0 to 0.047 | 1217 | |
| Enoxacin;Chloramphenicol; Lincomycin, etc | RQ value of enrofloxacin was >1, which was at high ecological risk, while the RQ values of chloramphenicol and lincomycin were >0.1 | 1218 | ||
| Enoxacin;Ciprofloxacin; Sulfamethoxazole, etc | RQ values of enrofloxacin, ciprofloxacin, and sulfamethoxazole were >1, which showed high ecological risks to aquatic organisms | 1219 | ||
| Gale Musk,;Tuna Musk | Relevant studies have shown that the biodegradation coefficients of Galle musk and Tuna musk are 0.071 and 0.023, respectively | 1220 | ||
| Xylene Musk;Ketone Musk | The bioconcentration factors (BCF) for xylene musk, ketone musk and galax musk were 3800, 760 and 1584, respectively | 1221 | ||
| Germicides;Disinfectants | Germicides and disinfectants are widely added to all types of household cleaning products and can enter the food chain from the environment and accumulate in plants, animals and humans | 1225 | ||
| Sulfadimethoxine(50 μg/kg) | 50 μg/kg sulfadimethoxine reduces soil nitrification | 1222 | ||
| Caffeine;Carbamazepine; Ibuprofen | Three pharmaceuticals posed risk to aquatic organisms, with PI values of 10.3, 1.3, and 0.3, respectively. The maximum RQ value for caffeine was 10.3, RQ values of carbamazepine and ibuprofen ranged from 0.63~1.86, 0.25~1.48, respectively | 1223 |
图34 SEEM模型预测能力。注:NHANES生物监测数据推断的摄入率与SEEM元模型预测之间的相关性;虚线表示同一性(完美预测变量),而实线表示中位数的最小二乘回归(灰色阴影区域表示标准误差)Fig.34 SEEM model predictive capacity. Note: This figure illustrates the correlation between intake rates inferred from NHANES biomonitoring data and predictions made by the SEEM meta-model. The dashed line represents identity (perfect prediction variable), while the solid line denotes the median least squares regression (with the gray shaded area indicating standard error) |
图35 基于生理的全身药代动力学模型。注:Qpul、Qca、Qre、Qbo、Qmu、Qsp、Qha、Qhv、Qgu、Qth、Qsk、Qfa分别代表流向肺、心脏、肾脏、骨骼、肌肉、脾脏、肝脏、肝静脉、肠道、胸腺、皮肤和脂肪的血流量。输入部位可以是身体的任何部位。此模型只展示了肝脏和肾脏的清除过程,而某些药物或污染物也可以在其他部位发生清除[1229]。Fig.35 Physiologically-based whole-body pharmacokinetic model. This model illustrates blood flow to various organs including the lungs (Qpul), heart (Qca), kidneys (Qre), bones (Qbo), muscles (Qmu), spleen (Qsp), liver (Qha), hepatic vein (Qhv), intestines (Qgu), thymus (Qth), skin (Qsk), and fat (Qfa). The site of entry can be any part of the body. The model exclusively shows clearance processes in the liver and kidneys, though clearance of certain drugs or pollutants may also occur at other sites[1229]. |
| Item | Mouse | Rat | Monkey | Human |
|---|---|---|---|---|
| Ventilation | ||||
| Alveolar/[L/(h·kg)] | 29.0 | 15.0 | 15.0 | 15.0 |
| Blood flows | ||||
| Total/[L/(h·kg)] | 16.5 | 15.0 | 15.0 | 15.0 |
| Muscle/unitless, the same below | 0.18 | 0.18 | 0.18 | 0.18 |
| Skin | 0.07 | 0.08 | 0.06 | 0.06 |
| Fat | 0.03 | 0.06 | 0.05 | 0.05 |
| Liver (arterial) | 0.035 | 0.03 | 0.065 | 0.07 |
| Gut (portal) | 0.165 | 0.18 | 0.185 | 0.19 |
| Other organs | 0.52 | 0.47 | 0.46 | 0.45 |
| Tissue volumes | ||||
| Body weight/kg | 0.02 | 0.3 | 4.0 | 80.0 |
| Body water/unitless, the same below | 0.65 | 0.65 | 0.65 | 0.65 |
| Plasma | 0.04 | 0.04 | 0.04 | 0.04 |
| RBCs | 0.03 | 0.03 | 0.03 | 0.03 |
| Muscle | 0.34 | 0.36 | 0.048 | 0.33 |
| Skin | 0.17 | 0.195 | 0.11 | 0.11 |
| Fat | 0.10 | 0.07 | 0.05 | 0.21 |
| Liver | 0.046 | 0.037 | 0.027 | 0.023 |
| Gut tissue | 0.031 | 0.033 | 0.045 | 0.045 |
| Other organs | 0.049 | 0.031 | 0.039 | 0.039 |
图36 PFAS的动力学曲线与动力学参数。通过模型模拟的小鼠1 mg/kg单次暴露后的PFHxS(A)、PFOS(B)和PFOA(C)在小鼠血浆中的浓度-时间曲线,以及PFAS达到峰值的时间(Tmax)(D)、最大浓度(Cmax)(E)、消除半衰期(T1/2)(F)和生物有效性(G)。相对Cmax(经口或经皮或经鼻Cmax与静脉注射Cmax的比值)与生物有效性(H)之间的线性拟合,虚线表示95%置信区间[1246]Fig.36 Kinetic Curves and Parameters for PFAS. Concentration-time curves for PFHxS (A), PFOS (B), and PFOA (C) in mouse plasma following a single 1 mg/kg exposure, modeled to show the time to peak concentration (Tmax) (D), maximum concentration (Cmax) (E), elimination half-life (T1/2) (F), and bioavailability (G). A linear fit between relative Cmax (the ratio of oral, dermal, or nasal Cmax to intravenous Cmax) and bioavailability (H) is shown, with dashed lines representing the 95% confidence interval[1246] |
图38 人体内暴露浓度预测模型(HExpPredict)的构建Fig. 38 Construction of the human exposure prediction model (HExpPredict) |
图39 人体内暴露浓度预测模型(HExpPredict)的预测能力Fig. 39 Predictive capacity of the human exposure prediction model (HExpPredict) |
表22 机器学习模型的预测能力Table 22 Predictive capacity of machine learning models |
| Model Types | Training Set (n = 172) | Test Set (n = 44) | ||||||
|---|---|---|---|---|---|---|---|---|
| RMSE | MAE | MAPE | R2 | RMSE | MAE | MAPE | R2 | |
| Random Forest | 1.66 | 1.28 | 0.29 | 0.80 | 2.07 | 1.56 | 0.23 | 0.72 |
| Artificial Neural Networks | 2.83 | 2.13 | 0.39 | 0.41 | 3.07 | 2.56 | 0.35 | 0.39 |
| Support Vector Machine | 3.52 | 2.81 | 0.69 | 0.08 | 3.79 | 3.22 | 0.47 | 0.06 |
表23 随机森林模型对不同种污染物的预测能力Table 23 Predictive capacity of the random forest model for different pollutants |
| Classtimes | N | RMSE | Mean RMSE |
|---|---|---|---|
| PCBs | 86 | 0.64 | 0.91 |
| PAHs | 10 | 0.70 | |
| PAEs | 5 | 0.71 | |
| Dioxins | 11 | 0.73 | |
| PFCs | 8 | 0.83 | |
| OPFRs | 7 | 0.85 | |
| VOCs | 15 | 0.86 | |
| PBDEs | 31 | 0.94 | |
| PPCPs | 29 | 1.18 | |
| OCPs | 14 | 1.68 |
表24 公共毒理学数据库及毒性终点的最佳表现机器学习模型Table 24 Best performing machine learning models for public toxicology databases and toxicity endpoints |
| Toxicity Endpoints | Database Name | Machine Learning Model Ref |
|---|---|---|
| Cardiac Toxicity (hERG Binding) | PubChem bioassay, CHEMBL bioactivity | 1255⇓⇓⇓~1259 |
| Acute Oral Toxicity (LD50) | Li et al. set, admetSAR, MDL Toxicity, EPA Toxicity Estimation Software Tool, SuperToxic | 1260,1261 |
| Hepatotoxicity (DILI) | Liver Toxicity Knowledge Base (LTKB), LiverTox, Hepatox | 1262,1263 |
| Nuclear Receptor and Stress Response | Tox21 | 1264⇓⇓~1267 |
| Mutagenicity | Ames data collection | 1268⇓~1270 |
| Carcinogenicity | Carcinogenic Potency Database (CPDB) | 1271 |
| General Toxicity | TOXNET, Toxin and Toxin Target Database (T3DB), SIDER | 1260, 1272,1273 |
图48 (A)多溴联苯醚及其羟基化代谢物对雌激素相关受体γ(ERRγ)的结构依赖性活性研究,(B)分子对接得到的化合物与ERRγ结合口袋中配体的结合构象[1352]Fig. 48 (A) Structure-dependent activity of polybrominated diphenyl ethers and their hydroxylated metabolites on estrogen-related receptor γ (ERRγ), (B) Binding conformations of the compounds with ligands in the ERRγ binding pocket obtained by molecular docking[1352] |
| [1] |
|
| [2] |
|
| [3] |
|
| [4] |
|
| [5] |
|
| [6] |
|
| [7] |
|
| [8] |
|
| [9] |
|
| [10] |
China outlines plan to control new pollutants[EB/OL]. [2024-07-01]. https://english.www.gov.cn/policies/latestreleases/202205/24/content_WS628cd024c6d02e533532b3e1.html.
|
| [11] |
|
| [12] |
|
| [13] |
|
| [14] |
|
| [15] |
|
| [16] |
|
| [17] |
|
| [18] |
|
| [19] |
|
| [20] |
|
| [21] |
|
| [22] |
|
| [23] |
Agency, U. E. U. S. E. P. CompTox chemistry Dashboard PFAS Master list of PFAS Sub-stances, 2023-11-24, 2021.
|
| [24] |
|
| [25] |
|
| [26] |
|
| [27] |
|
| [28] |
|
| [29] |
|
| [30] |
|
| [31] |
|
| [32] |
UNEP. An amendment to Annex A adopted by the Conference of the Parties to the Stockholm Convention on Persistent Organic Pollutants at its sixth meeting. SC-6/13: Listing of hexabromocyclododecane. Secretariat of the Stockholm Convention. Stockholm, Sweden, 2013.
|
| [33] |
UNEP. Persistent Organic Pollutants Review Committee to list hexabromodiphenyl ether and eptabromodiphenyl ether in Annex A of the Convention. Stockholm, Sweden, 2009.
|
| [34] |
|
| [35] |
Announcement on issuing the "List of priority controlled chemicals (the first batch)"[EB/OL]. [2024-07-01]. http://www.mee.gov.cn/gkml/hbb/bgg/201712/t20171229_428832.htm.
|
| [36] |
|
| [37] |
|
| [38] |
|
| [39] |
|
| [40] |
|
| [41] |
|
| [42] |
|
| [43] |
|
| [44] |
(陈玛丽, 刘青坡, 施华宏. 环境与健康杂志, 2008, 25(10): 937.).
|
| [45] |
|
| [46] |
|
| [47] |
|
| [48] |
|
| [49] |
|
| [50] |
|
| [51] |
|
| [52] |
|
| [53] |
|
| [54] |
|
| [55] |
|
| [56] |
|
| [57] |
EPA. Short-Chain Chlorinated Paraffins (SCCPs) and Other Chlorinated Paraffins Action Plan. EPA, 2009.
|
| [58] |
|
| [59] |
|
| [60] |
(宋博宇, 白露, 黎娟, 高鹏, 张彩丽, 高洁玉, 王亚韡. 环境科学研究, 2022, 35(9): 2077.).
|
| [61] |
|
| [62] |
|
| [63] |
|
| [64] |
|
| [65] |
|
| [66] |
|
| [67] |
(王亚韡, 傅建捷, 江桂斌. 环境化学, 2009, 28:1.).
|
| [68] |
|
| [69] |
IARC. Chlorinated paraffins. 1990: 55.
|
| [70] |
IPCS. Chlorinated paraffins (EHC 181, 1996). 1996.
|
| [71] |
|
| [72] |
|
| [73] |
|
| [74] |
|
| [75] |
|
| [76] |
|
| [77] |
|
| [78] |
|
| [79] |
|
| [80] |
UNEP. Chlorinated paraffins with carbon chain lengths in the range C14-17 and chlorination levels at or exceeding 45 percent chlorine by weight.UNEP, 2022.
|
| [81] |
|
| [82] |
|
| [83] |
(周庆祥, 江桂斌. 科技术语研究, 2001, 3(3): 12.).
|
| [84] |
|
| [85] |
|
| [86] |
|
| [87] |
|
| [88] |
|
| [89] |
|
| [90] |
(江桂斌. 科学新闻, 1999,(34): 14.).
|
| [91] |
|
| [92] |
|
| [93] |
|
| [94] |
|
| [95] |
|
| [96] |
|
| [97] |
|
| [98] |
|
| [99] |
|
| [100] |
|
| [101] |
|
| [102] |
|
| [103] |
|
| [104] |
|
| [105] |
|
| [106] |
|
| [107] |
|
| [108] |
|
| [109] |
|
| [110] |
|
| [111] |
|
| [112] |
|
| [113] |
|
| [114] |
|
| [115] |
|
| [116] |
|
| [117] |
|
| [118] |
|
| [119] |
|
| [120] |
|
| [121] |
|
| [122] |
|
| [123] |
|
| [124] |
|
| [125] |
|
| [126] |
|
| [127] |
|
| [128] |
(潘寻, 苏都, 宋光明, 贲伟伟. 生态毒理学报, 2017, 12(5): 184.).
|
| [129] |
|
| [130] |
|
| [131] |
|
| [132] |
(秦秦, 宋科, 孙丽娟, 孙雅菲. 生态环境学报, 2019, 28(5): 1046.).
|
| [133] |
|
| [134] |
|
| [135] |
|
| [136] |
|
| [137] |
|
| [138] |
|
| [139] |
|
| [140] |
|
| [141] |
|
| [142] |
|
| [143] |
|
| [144] |
|
| [145] |
|
| [146] |
|
| [147] |
|
| [148] |
|
| [149] |
|
| [150] |
|
| [151] |
|
| [152] |
|
| [153] |
|
| [154] |
|
| [155] |
|
| [156] |
|
| [157] |
|
| [158] |
|
| [159] |
|
| [160] |
|
| [161] |
(朱永官, 欧阳纬莹, 吴楠, 苏建强, 乔敏. 中国科学院院刊, 2015, 30(4): 509.).
|
| [162] |
|
| [163] |
|
| [164] |
|
| [165] |
|
| [166] |
|
| [167] |
|
| [168] |
|
| [169] |
|
| [170] |
Emerging contaminants: a one health perspective[EB/OL]. [2024-07-01]. https://www.sciencedirect.com/science/article/pii/S266667582400050X?via%3Dihub.
|
| [171] |
Emerging contaminants and biological effects in Arctic wildlife[EB/OL]. [2024-07-01]. https://www.sciencedirect.com/science/article/pii/S0169534721000239.
|
| [172] |
We need a “Keeling Curve” approach for contaminants of emerging concern[EB/OL]. [2024-07-01]. https://pubs.acs.org/doi/full/10.1021/acs.est.3c10630.
|
| [173] |
IPEN. Industrial chemicals[EB/OL]. [2024-07-01]. https://ipen.org/toxic-priorities/industrial-chemicals.
|
| [174] |
FAMIC. Basic knowlegde of agricultural chemicals[EB/OL]. 2014. [2024-07-01]. https://www.acis.famic.go.jp/eng/chishiki/01.htm.
|
| [175] |
|
| [176] |
|
| [177] |
|
| [178] |
|
| [179] |
|
| [180] |
|
| [181] |
(杨峻, 张文君. 农药科学与管理, 2011, 32(10): 6.).
|
| [182] |
|
| [183] |
(提博雯, 王杰, 刘建国, 胡建信. 环境科学研究, 2016, 29(8): 1241.).
|
| [184] |
(杨益军. 农药科学与管理, 2019, 40(1): 18.).
|
| [185] |
UNEP. UNEP/POPS/POPRC.19/4: Draft risk profile: chlorpyrifos. United Nations Environment Programme, 2023.
|
| [186] |
|
| [187] |
|
| [188] |
|
| [189] |
|
| [190] |
|
| [191] |
|
| [192] |
|
| [193] |
|
| [194] |
|
| [195] |
|
| [196] |
|
| [197] |
|
| [198] |
|
| [199] |
|
| [200] |
UNEP. UNEP/POPS/POPRC.2/17/Add.5: Report of the Persistent Organic Pollutants Review Committee on the work of its second meeting. United Nations Environment Programme, 2006.
|
| [201] |
|
| [202] |
|
| [203] |
|
| [204] |
|
| [205] |
UNEP. UNEP/POPS/POPRC.12/11/Add.2: Additional information relating to the draft risk management evaluation for Pentadecafluorooctanoic acid (PFOA, Perfluorooctanoic acid), its salts and PFOA-related compounds. United Nations Environment Programme, 2016.
|
| [206] |
|
| [207] |
|
| [208] |
UNEP. UNEP/POPS/POPRC.14/6/Add.1: Report of the Persistent Organic Pollutants Review Committee on the work of its fourteenth meeting. United Nations Environment Programme, 2018.
|
| [209] |
OECD. OECD existing chemicals database[EB/OL]. 2021.[2024-07-01]. https://hpvchemicals.oecd.org/ui/Search.aspx.
|
| [210] |
ECHA. 2-(2H-benzotriazol-2-yl)-4,6-ditertpentylphenol registration dossier[EB/OL]. 2020.[2024-07-01]. https://echa.europa.eu/es/substance-information/-/substanceinfo/100.043.062.
|
| [211] |
UNEP. UNEP/POPS/POPRC.17/13/Add.3: Risk profile for UV-328. United Nations Environment Programme, 2022.
|
| [212] |
|
| [213] |
|
| [214] |
GREM. Antibiotic usage and consumption. In 2023.
|
| [215] |
USFDA. 2020 summary report on antimicrobials sold or distributed for use in food-producing animals. US Food and Drug Administration, 2021.
|
| [216] |
|
| [217] |
国务院食品安全办等五部门关于印发《畜禽水产品抗生素、禁用化合物及兽药残留超标专项整治行动方案》的通知[EB/OL].[2024-07-01]. www.jgj.moa.gov.cn/zfjg/201904/t20190418_6186117.htm.
|
| [218] |
|
| [219] |
|
| [220] |
ESAC. Antimicrobial consumption in the EU/EEA (ESAC-Net): annual epidemiological report 2021. European Centre for Disease Prevention Control: Stockholm, Sweden, 2022.
|
| [221] |
|
| [222] |
|
| [223] |
|
| [224] |
|
| [225] |
WHO. WHO report on surveillance of antibiotic consumption: 2016-2018 early implementation. World Health Organization, 2018.
|
| [226] |
|
| [227] |
|
| [228] |
|
| [229] |
|
| [230] |
|
| [231] |
|
| [232] |
|
| [233] |
|
| [234] |
The Danish Environmental Protection Agency. List I: Substances identified as endocrine disruptors at EU level[EB/OL]. 2023.[2024-07-01]. https://edlists.org/the-ed-lists/list-i-substances-identified-as-endocrine-disruptors-by-the-eu.
|
| [235] |
United States Environmental Protection Agency. Status of endocrine disruptor screening program (EDSP) list 1 screening conclusions[EB/OL]. 2023.[2024-07-01]. https://www.regulations.gov/document/EPA-HQ-OPP-2023-0474-0001.
|
| [236] |
|
| [237] |
|
| [238] |
|
| [239] |
|
| [240] |
Pollution, T. I. P. o. C. Overview Report II: An Overview of Current Scientific Knowledge on the Life Cycles, Environmental Exposures, and Environmental Effects of Select Endocrine Disrupting Chemicals (EDCs) and Potential EDCs, 2017.
|
| [241] |
|
| [242] |
OECD. OECD existing chemicals database[EB/OL]. 2023. [2024-07-01]. https://hpvchemicals.oecd.org/UI/AllChemicals.aspx.
|
| [243] |
|
| [244] |
(林泳峰, 阮挺, 江桂斌. 中国科学: 化学, 2018, 48(10): 1151.).
|
| [245] |
(阮挺, 江桂斌. 中国科学院院刊, 2020, 35(11): 1328.).
|
| [246] |
|
| [247] |
|
| [248] |
|
| [249] |
|
| [250] |
|
| [251] |
|
| [252] |
|
| [253] |
|
| [254] |
|
| [255] |
|
| [256] |
|
| [257] |
|
| [258] |
|
| [259] |
|
| [260] |
|
| [261] |
|
| [262] |
|
| [263] |
|
| [264] |
|
| [265] |
|
| [266] |
|
| [267] |
|
| [268] |
|
| [269] |
|
| [270] |
|
| [271] |
|
| [272] |
|
| [273] |
|
| [274] |
|
| [275] |
|
| [276] |
|
| [277] |
|
| [278] |
|
| [279] |
|
| [280] |
|
| [281] |
|
| [282] |
|
| [283] |
|
| [284] |
|
| [285] |
|
| [286] |
|
| [287] |
|
| [288] |
|
| [289] |
|
| [290] |
|
| [291] |
|
| [292] |
|
| [293] |
|
| [294] |
|
| [295] |
|
| [296] |
|
| [297] |
|
| [298] |
|
| [299] |
|
| [300] |
|
| [301] |
|
| [302] |
|
| [303] |
|
| [304] |
|
| [305] |
|
| [306] |
|
| [307] |
|
| [308] |
|
| [309] |
|
| [310] |
|
| [311] |
|
| [312] |
|
| [313] |
|
| [314] |
|
| [315] |
|
| [316] |
|
| [317] |
|
| [318] |
|
| [319] |
|
| [320] |
|
| [321] |
|
| [322] |
|
| [323] |
|
| [324] |
|
| [325] |
|
| [326] |
|
| [327] |
|
| [328] |
|
| [329] |
|
| [330] |
|
| [331] |
|
| [332] |
|
| [333] |
|
| [334] |
|
| [335] |
|
| [336] |
|
| [337] |
|
| [338] |
|
| [339] |
|
| [340] |
|
| [341] |
|
| [342] |
|
| [343] |
|
| [344] |
|
| [345] |
|
| [346] |
|
| [347] |
|
| [348] |
|
| [349] |
(宋小卫. 中国科学院大学博士论文, 2019.).
|
| [350] |
|
| [351] |
|
| [352] |
|
| [353] |
|
| [354] |
|
| [355] |
|
| [356] |
|
| [357] |
|
| [358] |
|
| [359] |
|
| [360] |
|
| [361] |
|
| [362] |
|
| [363] |
|
| [364] |
|
| [365] |
|
| [366] |
|
| [367] |
|
| [368] |
|
| [369] |
|
| [370] |
|
| [371] |
|
| [372] |
|
| [373] |
|
| [374] |
|
| [375] |
(蒋宛彦含. 兰州大学博士论文, 2020.).
|
| [376] |
|
| [377] |
|
| [378] |
(王佩文. 山东大学硕士论文, 2018.).
|
| [379] |
(管克兰. 中国科学院大学硕士论文, 2020.).
|
| [380] |
(张佩萱. 西安科技大学硕士论文, 2021.).
|
| [381] |
|
| [382] |
|
| [383] |
|
| [384] |
|
| [385] |
|
| [386] |
|
| [387] |
|
| [388] |
|
| [389] |
|
| [390] |
|
| [391] |
(鄢世阳. 大连理工大学硕士论文, 2020.).
|
| [392] |
|
| [393] |
|
| [394] |
|
| [395] |
|
| [396] |
|
| [397] |
(林美卿. 中国科学院大学博士论文, 2020.).
|
| [398] |
|
| [399] |
|
| [400] |
|
| [401] |
|
| [402] |
|
| [403] |
|
| [404] |
|
| [405] |
|
| [406] |
|
| [407] |
|
| [408] |
|
| [409] |
|
| [410] |
(金梦, 刘丽君, 赵波, 闫雅楠, 李彦希, 黎玉清, 韩静磊, 丁紫荣. 环境化学, 2023, 42 (7): 2153.).
|
| [411] |
(方淑红, 岳月, 李成, 印红玲, 孙静, 杨迎春, 叶芝祥. 环境科学学报, 2019, 39(4): 1234.).
|
| [412] |
|
| [413] |
(乔磊, 张汝频, 杨余, 冉勇. 地球化学, 2022, 51(6): 617.).
|
| [414] |
(陈典, 张照荷, 赵微, 李俊, 焦杏春. 岩矿测试, 2022, 41(3): 499.).
|
| [415] |
(黄语, 陈朝辉, 李钰涛, 张辉, 刘伟, 方淑红. 中国环境科学, 2023, 43(10): 5444.).
|
| [416] |
(李金荣, 郭瑞昕, 刘艳华, 陈建秋. 环境化学, 2020, 39(10): 2637.).
|
| [417] |
(王淑婷, 饶竹, 郭峰, 刘成海, 战楠, 王娅南, 彭洁, 杨鸿波. 环境科学, 2021, 42(1): 166.).
|
| [418] |
(李凌云, 高礼, 郑兰香, 李富娟, 陶红, 马兰. 环境科学, 2023, 44(5): 2539.).
|
| [419] |
(熊希瑶, 贺聪聪, 焦啸宇, 王成俊. 中南民族大学学报(自然科学版), 2021, 40(3): 238.).
|
| [420] |
|
| [421] |
|
| [422] |
(熊仕茂, 王秀珍, 罗伟铿, 马艳, 林颖, 王美欢, 郑晶. 环境化学, 2021, 40(12): 3803.).
|
| [423] |
|
| [424] |
|
| [425] |
|
| [426] |
|
| [427] |
(薛保铭, 杨惟薇, 王英辉, 黄闻宇, 李平阳, 张瑞杰, 黄魁. 中国环境科学, 2013, 33(9): 1664.).
|
| [428] |
(刘昔, 王智, 王学雷, 李珍, 杨超, 厉恩华, 位慧敏. 环境科学, 2019, 40(5): 2094.).
|
| [429] |
|
| [430] |
|
| [431] |
(陈贤, 张彩杰, 杨桂朋, 张婧, 刘梦. 环境科学, 2020, 41(1): 194.).
|
| [432] |
|
| [433] |
(曹美苑, 李鰼橙, 黄柏文. 公共卫生与预防医学, 2020, 6(3): 90.).
|
| [434] |
|
| [435] |
|
| [436] |
|
| [437] |
|
| [438] |
|
| [439] |
|
| [440] |
(廖雨枫, 王正, 潘旸, 李爱民. 环境科学, 2024, 45(3):1561.
|
| [441] |
|
| [442] |
(胡哲. 华中农业大学硕士论文, 2016.).
|
| [443] |
|
| [444] |
|
| [445] |
|
| [446] |
(肖少可. 广西大学硕士论文, 2021.).
|
| [447] |
|
| [448] |
|
| [449] |
|
| [450] |
|
| [451] |
|
| [452] |
|
| [453] |
|
| [454] |
|
| [455] |
|
| [456] |
|
| [457] |
|
| [458] |
|
| [459] |
|
| [460] |
|
| [461] |
|
| [462] |
|
| [463] |
|
| [464] |
|
| [465] |
|
| [466] |
|
| [467] |
|
| [468] |
|
| [469] |
|
| [470] |
|
| [471] |
|
| [472] |
|
| [473] |
|
| [474] |
|
| [475] |
(马新东. 大连理工大学博士论文, 2014.).
|
| [476] |
|
| [477] |
|
| [478] |
|
| [479] |
|
| [480] |
|
| [481] |
|
| [482] |
|
| [483] |
|
| [484] |
|
| [485] |
|
| [486] |
|
| [487] |
|
| [488] |
|
| [489] |
|
| [490] |
|
| [491] |
|
| [492] |
|
| [493] |
Chemicals strategy for sustainability towards a toxic-free environment[EB/OL]. [2024-07-01]. https://environment.ec.europa.eu/strategy/chemicals-strategy_en.
|
| [494] |
|
| [495] |
|
| [496] |
|
| [497] |
|
| [498] |
|
| [499] |
|
| [500] |
|
| [501] |
|
| [502] |
|
| [503] |
|
| [504] |
|
| [505] |
|
| [506] |
|
| [507] |
|
| [508] |
|
| [509] |
|
| [510] |
|
| [511] |
|
| [512] |
|
| [513] |
|
| [514] |
|
| [515] |
|
| [516] |
|
| [517] |
|
| [518] |
|
| [519] |
|
| [520] |
|
| [521] |
|
| [522] |
|
| [523] |
|
| [524] |
|
| [525] |
|
| [526] |
|
| [527] |
|
| [528] |
|
| [529] |
|
| [530] |
|
| [531] |
|
| [532] |
|
| [533] |
|
| [534] |
|
| [535] |
|
| [536] |
|
| [537] |
|
| [538] |
|
| [539] |
|
| [540] |
|
| [541] |
|
| [542] |
|
| [543] |
|
| [544] |
|
| [545] |
|
| [546] |
|
| [547] |
|
| [548] |
|
| [549] |
|
| [550] |
|
| [551] |
|
| [552] |
|
| [553] |
|
| [554] |
|
| [555] |
|
| [556] |
|
| [557] |
|
| [558] |
|
| [559] |
|
| [560] |
|
| [561] |
|
| [562] |
|
| [563] |
|
| [564] |
|
| [565] |
|
| [566] |
|
| [567] |
|
| [568] |
|
| [569] |
|
| [570] |
|
| [571] |
|
| [572] |
|
| [573] |
|
| [574] |
|
| [575] |
|
| [576] |
|
| [577] |
|
| [578] |
|
| [579] |
|
| [580] |
|
| [581] |
|
| [582] |
|
| [583] |
|
| [584] |
|
| [585] |
|
| [586] |
|
| [587] |
|
| [588] |
|
| [589] |
|
| [590] |
|
| [591] |
|
| [592] |
|
| [593] |
|
| [594] |
|
| [595] |
|
| [596] |
|
| [597] |
|
| [598] |
|
| [599] |
|
| [600] |
|
| [601] |
|
| [602] |
|
| [603] |
|
| [604] |
|
| [605] |
|
| [606] |
|
| [607] |
|
| [608] |
|
| [609] |
|
| [610] |
|
| [611] |
|
| [612] |
|
| [613] |
|
| [614] |
|
| [615] |
|
| [616] |
|
| [617] |
|
| [618] |
|
| [619] |
|
| [620] |
|
| [621] |
|
| [622] |
|
| [623] |
|
| [624] |
|
| [625] |
|
| [626] |
|
| [627] |
|
| [628] |
|
| [629] |
|
| [630] |
|
| [631] |
|
| [632] |
|
| [633] |
|
| [634] |
|
| [635] |
|
| [636] |
|
| [637] |
|
| [638] |
|
| [639] |
|
| [640] |
|
| [641] |
|
| [642] |
|
| [643] |
|
| [644] |
|
| [645] |
|
| [646] |
|
| [647] |
|
| [648] |
|
| [649] |
|
| [650] |
|
| [651] |
|
| [652] |
|
| [653] |
|
| [654] |
|
| [655] |
|
| [656] |
|
| [657] |
|
| [658] |
|
| [659] |
|
| [660] |
|
| [661] |
|
| [662] |
|
| [663] |
|
| [664] |
|
| [665] |
|
| [666] |
|
| [667] |
|
| [668] |
|
| [669] |
|
| [670] |
|
| [671] |
|
| [672] |
|
| [673] |
|
| [674] |
|
| [675] |
|
| [676] |
|
| [677] |
|
| [678] |
|
| [679] |
|
| [680] |
|
| [681] |
|
| [682] |
|
| [683] |
|
| [684] |
|
| [685] |
|
| [686] |
|
| [687] |
|
| [688] |
|
| [689] |
|
| [690] |
|
| [691] |
|
| [692] |
|
| [693] |
|
| [694] |
|
| [695] |
|
| [696] |
|
| [697] |
|
| [698] |
|
| [699] |
|
| [700] |
|
| [701] |
|
| [702] |
|
| [703] |
|
| [704] |
|
| [705] |
|
| [706] |
|
| [707] |
|
| [708] |
|
| [709] |
|
| [710] |
|
| [711] |
|
| [712] |
|
| [713] |
|
| [714] |
|
| [715] |
|
| [716] |
|
| [717] |
|
| [718] |
|
| [719] |
|
| [720] |
|
| [721] |
|
| [722] |
|
| [723] |
|
| [724] |
|
| [725] |
|
| [726] |
USEPA. surface water models to assess exposures[EB/OL]. (2023-11-27)[2024-07-01]. https://www.epa.gov/ceam/surface-water-models-assess-exposures.
|
| [727] |
|
| [728] |
|
| [729] |
|
| [730] |
|
| [731] |
|
| [732] |
|
| [733] |
|
| [734] |
|
| [735] |
|
| [736] |
|
| [737] |
|
| [738] |
|
| [739] |
|
| [740] |
|
| [741] |
|
| [742] |
|
| [743] |
|
| [744] |
|
| [745] |
|
| [746] |
|
| [747] |
|
| [748] |
|
| [749] |
|
| [750] |
|
| [751] |
|
| [752] |
|
| [753] |
|
| [754] |
|
| [755] |
|
| [756] |
|
| [757] |
|
| [758] |
|
| [759] |
|
| [760] |
|
| [761] |
|
| [762] |
|
| [763] |
|
| [764] |
|
| [765] |
|
| [766] |
|
| [767] |
|
| [768] |
|
| [769] |
|
| [770] |
|
| [771] |
|
| [772] |
|
| [773] |
|
| [774] |
|
| [775] |
|
| [776] |
|
| [777] |
|
| [778] |
|
| [779] |
|
| [780] |
|
| [781] |
|
| [782] |
|
| [783] |
|
| [784] |
|
| [785] |
|
| [786] |
|
| [787] |
|
| [788] |
|
| [789] |
|
| [790] |
|
| [791] |
|
| [792] |
|
| [793] |
|
| [794] |
|
| [795] |
|
| [796] |
|
| [797] |
|
| [798] |
|
| [799] |
|
| [800] |
|
| [801] |
|
| [802] |
|
| [803] |
|
| [804] |
|
| [805] |
|
| [806] |
|
| [807] |
|
| [808] |
|
| [809] |
|
| [810] |
|
| [811] |
|
| [812] |
|
| [813] |
|
| [814] |
|
| [815] |
|
| [816] |
|
| [817] |
|
| [818] |
|
| [819] |
|
| [820] |
|
| [821] |
|
| [822] |
|
| [823] |
|
| [824] |
|
| [825] |
|
| [826] |
|
| [827] |
|
| [828] |
|
| [829] |
|
| [830] |
|
| [831] |
|
| [832] |
|
| [833] |
|
| [834] |
|
| [835] |
|
| [836] |
|
| [837] |
|
| [838] |
|
| [839] |
|
| [840] |
|
| [841] |
|
| [842] |
|
| [843] |
|
| [844] |
|
| [845] |
|
| [846] |
|
| [847] |
|
| [848] |
|
| [849] |
|
| [850] |
|
| [851] |
|
| [852] |
|
| [853] |
|
| [854] |
|
| [855] |
|
| [856] |
|
| [857] |
|
| [858] |
|
| [859] |
|
| [860] |
|
| [861] |
|
| [862] |
|
| [863] |
|
| [864] |
|
| [865] |
|
| [866] |
|
| [867] |
|
| [868] |
|
| [869] |
|
| [870] |
|
| [871] |
|
| [872] |
|
| [873] |
|
| [874] |
|
| [875] |
|
| [876] |
|
| [877] |
|
| [878] |
|
| [879] |
|
| [880] |
|
| [881] |
|
| [882] |
|
| [883] |
|
| [884] |
|
| [885] |
|
| [886] |
|
| [887] |
|
| [888] |
|
| [889] |
|
| [890] |
|
| [891] |
|
| [892] |
|
| [893] |
|
| [894] |
|
| [895] |
|
| [896] |
|
| [897] |
|
| [898] |
|
| [899] |
|
| [900] |
|
| [901] |
|
| [902] |
|
| [903] |
|
| [904] |
|
| [905] |
|
| [906] |
|
| [907] |
|
| [908] |
|
| [909] |
|
| [910] |
|
| [911] |
|
| [912] |
|
| [913] |
|
| [914] |
|
| [915] |
|
| [916] |
|
| [917] |
|
| [918] |
|
| [919] |
|
| [920] |
|
| [921] |
|
| [922] |
|
| [923] |
|
| [924] |
|
| [925] |
|
| [926] |
|
| [927] |
|
| [928] |
|
| [929] |
|
| [930] |
|
| [931] |
|
| [932] |
|
| [933] |
|
| [934] |
|
| [935] |
|
| [936] |
|
| [937] |
|
| [938] |
|
| [939] |
|
| [940] |
|
| [941] |
|
| [942] |
|
| [943] |
|
| [944] |
|
| [945] |
|
| [946] |
|
| [947] |
|
| [948] |
|
| [949] |
|
| [950] |
|
| [951] |
|
| [952] |
|
| [953] |
|
| [954] |
|
| [955] |
|
| [956] |
|
| [957] |
|
| [958] |
|
| [959] |
|
| [960] |
|
| [961] |
|
| [962] |
|
| [963] |
|
| [964] |
|
| [965] |
|
| [966] |
Apoidea species-identification guide-Discover Life[EB/OL]. [2024-07-01]. https://www.discoverlife.org/mp/20q?guide=Apoidea_species&flags=HAS.
|
| [967] |
|
| [968] |
|
| [969] |
|
| [970] |
|
| [971] |
|
| [972] |
|
| [973] |
|
| [974] |
|
| [975] |
|
| [976] |
|
| [977] |
|
| [978] |
|
| [979] |
|
| [980] |
|
| [981] |
|
| [982] |
|
| [983] |
|
| [984] |
|
| [985] |
|
| [986] |
|
| [987] |
|
| [988] |
|
| [989] |
|
| [990] |
|
| [991] |
(李昌兴, 刘东东, 高一星, 张静, 张立新. 化学试剂, 2023, 45(3): 29.).
|
| [992] |
|
| [993] |
|
| [994] |
|
| [995] |
|
| [996] |
|
| [997] |
|
| [998] |
|
| [999] |
|
| [1000] |
|
| [1001] |
|
| [1002] |
Assessment of combined exposures to multiple chemicals: report of a WHO/IPCS international workshop on aggregate/cumulative risk assessment[EB/OL]. [2024-07-01]. https://www.who.int/publications/i/item/9789241563833.
|
| [1003] |
|
| [1004] |
|
| [1005] |
|
| [1006] |
|
| [1007] |
|
| [1008] |
|
| [1009] |
|
| [1010] |
|
| [1011] |
|
| [1012] |
|
| [1013] |
|
| [1014] |
|
| [1015] |
|
| [1016] |
|
| [1017] |
|
| [1018] |
|
| [1019] |
|
| [1020] |
|
| [1021] |
|
| [1022] |
|
| [1023] |
|
| [1024] |
|
| [1025] |
|
| [1026] |
|
| [1027] |
|
| [1028] |
|
| [1029] |
|
| [1030] |
(王华堂, 李良斌, 陈海玉, 张学锋, 陈隆达, 赵红霞. 环境昆虫学报, 2022, 44(1): 84.).
|
| [1031] |
|
| [1032] |
|
| [1033] |
|
| [1034] |
|
| [1035] |
|
| [1036] |
(赵兴楠. 东北师范大学博士论文, 2017.).
|
| [1037] |
|
| [1038] |
|
| [1039] |
|
| [1040] |
|
| [1041] |
|
| [1042] |
|
| [1043] |
|
| [1044] |
|
| [1045] |
|
| [1046] |
|
| [1047] |
|
| [1048] |
|
| [1049] |
|
| [1050] |
|
| [1051] |
|
| [1052] |
|
| [1053] |
|
| [1054] |
|
| [1055] |
|
| [1056] |
|
| [1057] |
|
| [1058] |
|
| [1059] |
|
| [1060] |
|
| [1061] |
|
| [1062] |
|
| [1063] |
|
| [1064] |
|
| [1065] |
|
| [1066] |
|
| [1067] |
|
| [1068] |
|
| [1069] |
|
| [1070] |
|
| [1071] |
|
| [1072] |
Baša Č esnik H,
|
| [1073] |
|
| [1074] |
|
| [1075] |
|
| [1076] |
|
| [1077] |
|
| [1078] |
|
| [1079] |
|
| [1080] |
|
| [1081] |
|
| [1082] |
|
| [1083] |
|
| [1084] |
|
| [1085] |
|
| [1086] |
(李明, 尹晓宇, 陈浩, 王欢, 宋磊, 董文静, 赵宝全, 于永利, 董武, 杨景峰. 生态毒理学报, 2020, 15(3):81.).
|
| [1087] |
|
| [1088] |
|
| [1089] |
Broniowska Ż,
|
| [1090] |
|
| [1091] |
|
| [1092] |
(高思越. 浙江大学硕士论文, 2021.).
|
| [1093] |
|
| [1094] |
|
| [1095] |
|
| [1096] |
|
| [1097] |
|
| [1098] |
|
| [1099] |
|
| [1100] |
|
| [1101] |
|
| [1102] |
|
| [1103] |
|
| [1104] |
|
| [1105] |
|
| [1106] |
|
| [1107] |
|
| [1108] |
|
| [1109] |
|
| [1110] |
|
| [1111] |
|
| [1112] |
|
| [1113] |
|
| [1114] |
|
| [1115] |
|
| [1116] |
|
| [1117] |
|
| [1118] |
(伍筱琳, 刘仁沿, 李红霞, 那广水, 姚子伟, 关道明. 海洋通报, 2009, 28(3): 117.).
|
| [1119] |
(白琦锋, 高礼, 袁涛. 环境化学, 2012, 31(5): 720.).
|
| [1120] |
|
| [1121] |
|
| [1122] |
|
| [1123] |
|
| [1124] |
|
| [1125] |
(唐丽, 孙秀发, 张军. 中国药理学与毒理学杂志, 2002, 16(1): 70.).
|
| [1126] |
|
| [1127] |
|
| [1128] |
|
| [1129] |
|
| [1130] |
|
| [1131] |
|
| [1132] |
|
| [1133] |
|
| [1134] |
|
| [1135] |
|
| [1136] |
(吴晓敏, 何秋霞, 韩利文, 袁延强, 杨官娥, 刘可春. 中国药理学通报, 2013, 29(9): 1251.).
|
| [1137] |
|
| [1138] |
|
| [1139] |
|
| [1140] |
|
| [1141] |
|
| [1142] |
|
| [1143] |
|
| [1144] |
|
| [1145] |
|
| [1146] |
|
| [1147] |
|
| [1148] |
|
| [1149] |
|
| [1150] |
|
| [1151] |
|
| [1152] |
|
| [1153] |
|
| [1154] |
|
| [1155] |
|
| [1156] |
|
| [1157] |
|
| [1158] |
|
| [1159] |
|
| [1160] |
|
| [1161] |
|
| [1162] |
|
| [1163] |
Santos L H M L M,
|
| [1164] |
|
| [1165] |
|
| [1166] |
|
| [1167] |
|
| [1168] |
|
| [1169] |
|
| [1170] |
|
| [1171] |
|
| [1172] |
|
| [1173] |
|
| [1174] |
|
| [1175] |
|
| [1176] |
(刘娣. 浙江大学博士论文, 2017.).
|
| [1177] |
(鲍陈燕, 顾国平, 章明奎. 土壤通报, 2016, 47(1): 164.).
|
| [1178] |
|
| [1179] |
|
| [1180] |
|
| [1181] |
|
| [1182] |
|
| [1183] |
|
| [1184] |
|
| [1185] |
|
| [1186] |
|
| [1187] |
|
| [1188] |
|
| [1189] |
|
| [1190] |
(冯琳钧, 许瀚文, 王艺霏, 张雪, 葛艳灵, 黄蓉, 兰静, 葛艳辉. 环境科学与技术, 2020, 43(12): 1.).
|
| [1191] |
|
| [1192] |
|
| [1193] |
|
| [1194] |
|
| [1195] |
Japan, Ministry of the Environment. In Results of Eco-toxicity Tests of Chemicals Conducted by Ministry of the Environment in Japan(March 2023).(2023-03-01)[2024-07-01]. https://www.env.go.jp/en/chemi/page_00001.html.
|
| [1196] |
|
| [1197] |
|
| [1198] |
|
| [1199] |
|
| [1200] |
|
| [1201] |
(刘少颖. 浙江大学博士论文, 2011.).
|
| [1202] |
|
| [1203] |
|
| [1204] |
|
| [1205] |
|
| [1206] |
|
| [1207] |
|
| [1208] |
|
| [1209] |
|
| [1210] |
|
| [1211] |
|
| [1212] |
|
| [1213] |
(刘锋, 应光国, 周启星, 陶然, 苏浩昌, 李旭. 环境科学, 2009, 30(5): 1280.).
|
| [1214] |
|
| [1215] |
|
| [1216] |
|
| [1217] |
|
| [1218] |
(董莞莞, 何欣, 郑洪波, 张瑛, 全燮, 穆海林. 大连理工大学学报, 2020, 60(2):119.).
|
| [1219] |
|
| [1220] |
|
| [1221] |
|
| [1222] |
|
| [1223] |
|
| [1224] |
|
| [1225] |
|
| [1226] |
|
| [1227] |
|
| [1228] |
|
| [1229] |
|
| [1230] |
|
| [1231] |
|
| [1232] |
|
| [1233] |
|
| [1234] |
|
| [1235] |
|
| [1236] |
|
| [1237] |
|
| [1238] |
|
| [1239] |
|
| [1240] |
|
| [1241] |
|
| [1242] |
|
| [1243] |
|
| [1244] |
|
| [1245] |
|
| [1246] |
|
| [1247] |
|
| [1248] |
|
| [1249] |
|
| [1250] |
|
| [1251] |
|
| [1252] |
|
| [1253] |
|
| [1254] |
United States Environmental Protection Agency. Estimation Programs Interface SuiteTM for Microsoft® Windows, v 4.11. United States Environmental Protection Agency, Washington, DC, USA, 2012.
|
| [1255] |
|
| [1256] |
|
| [1257] |
|
| [1258] |
|
| [1259] |
|
| [1260] |
|
| [1261] |
|
| [1262] |
|
| [1263] |
|
| [1264] |
|
| [1265] |
|
| [1266] |
|
| [1267] |
|
| [1268] |
|
| [1269] |
|
| [1270] |
|
| [1271] |
|
| [1272] |
|
| [1273] |
|
| [1274] |
|
| [1275] |
|
| [1276] |
|
| [1277] |
|
| [1278] |
|
| [1279] |
|
| [1280] |
|
| [1281] |
|
| [1282] |
|
| [1283] |
|
| [1284] |
|
| [1285] |
|
| [1286] |
|
| [1287] |
|
| [1288] |
|
| [1289] |
|
| [1290] |
|
| [1291] |
|
| [1292] |
|
| [1293] |
|
| [1294] |
|
| [1295] |
|
| [1296] |
|
| [1297] |
|
| [1298] |
|
| [1299] |
|
| [1300] |
|
| [1301] |
|
| [1302] |
European Food Safety Authority. EFSA Journal, 2012, 10(6): 2743.
|
| [1303] |
|
| [1304] |
|
| [1305] |
|
| [1306] |
|
| [1307] |
|
| [1308] |
|
| [1309] |
|
| [1310] |
|
| [1311] |
ATSDR(Agency for Toxic Substances and Disease Registry). Toxicological profile for perfluoroalkyls. Atlanta.Department of Health and Human services U. S. Public Health Service, 2021[EB/OL]. [2024-07-01]. https://www.atsdr.cdc.gov/ToxProfiles/tp200.pdf.
|
| [1312] |
|
| [1313] |
|
| [1314] |
|
| [1315] |
|
| [1316] |
|
| [1317] |
|
| [1318] |
|
| [1319] |
|
| [1320] |
|
| [1321] |
|
| [1322] |
|
| [1323] |
|
| [1324] |
|
| [1325] |
|
| [1326] |
|
| [1327] |
|
| [1328] |
|
| [1329] |
|
| [1330] |
|
| [1331] |
|
| [1332] |
|
| [1333] |
|
| [1334] |
|
| [1335] |
|
| [1336] |
|
| [1337] |
|
| [1338] |
|
| [1339] |
|
| [1340] |
|
| [1341] |
|
| [1342] |
|
| [1343] |
|
| [1344] |
|
| [1345] |
|
| [1346] |
|
| [1347] |
|
| [1348] |
|
| [1349] |
|
| [1350] |
|
| [1351] |
|
| [1352] |
|
| [1353] |
|
| [1354] |
|
| [1355] |
|
| [1356] |
|
| [1357] |
|
| [1358] |
|
| [1359] |
|
| [1360] |
|
| [1361] |
|
| [1362] |
|
| [1363] |
|
| [1364] |
|
| [1365] |
|
| [1366] |
|
| [1367] |
|
| [1368] |
|
| [1369] |
|
| [1370] |
|
| [1371] |
|
| [1372] |
|
| [1373] |
|
| [1374] |
|
| [1375] |
|
| [1376] |
|
| [1377] |
|
| [1378] |
|
| [1379] |
|
| [1380] |
|
| [1381] |
|
| [1382] |
|
| [1383] |
|
| [1384] |
|
| [1385] |
|
| [1386] |
|
| [1387] |
|
| [1388] |
|
| [1389] |
|
| [1390] |
|
| [1391] |
|
| [1392] |
|
| [1393] |
|
| [1394] |
|
| [1395] |
|
| [1396] |
|
| [1397] |
|
| [1398] |
|
| [1399] |
|
| [1400] |
|
| [1401] |
|
| [1402] |
|
| [1403] |
|
| [1404] |
|
| [1405] |
|
| [1406] |
|
| [1407] |
|
| [1408] |
|
| [1409] |
|
| [1410] |
|
| [1411] |
|
| [1412] |
|
| [1413] |
|
| [1414] |
|
| [1415] |
|
| [1416] |
|
| [1417] |
|
| [1418] |
|
| [1419] |
|
| [1420] |
|
| [1421] |
|
| [1422] |
|
| [1423] |
|
| [1424] |
|
| [1425] |
|
| [1426] |
|
| [1427] |
|
| [1428] |
|
| [1429] |
|
| [1430] |
|
| [1431] |
|
| [1432] |
|
| [1433] |
|
| [1434] |
|
| [1435] |
|
| [1436] |
|
| [1437] |
|
| [1438] |
|
| [1439] |
|
| [1440] |
|
| [1441] |
|
| [1442] |
|
| [1443] |
|
| [1444] |
|
| [1445] |
|
| [1446] |
|
| [1447] |
|
| [1448] |
|
| [1449] |
|
| [1450] |
|
| [1451] |
|
| [1452] |
|
| [1453] |
|
| [1454] |
|
| [1455] |
|
| [1456] |
|
| [1457] |
|
| [1458] |
|
| [1459] |
|
| [1460] |
|
| [1461] |
|
| [1462] |
|
| [1463] |
|
| [1464] |
|
| [1465] |
|
| [1466] |
|
| [1467] |
|
| [1468] |
|
| [1469] |
|
| [1470] |
|
| [1471] |
|
| [1472] |
|
| [1473] |
|
| [1474] |
|
| [1475] |
|
| [1476] |
|
| [1477] |
|
| [1478] |
|
| [1479] |
|
| [1480] |
|
| [1481] |
|
| [1482] |
(刘亚兵, 王小娜, 郭蕊. 现代预防医学, 2022, 49(7): 1333.).
|
| [1483] |
|
| [1484] |
|
| [1485] |
|
| [1486] |
|
| [1487] |
|
| [1488] |
|
| [1489] |
|
| [1490] |
|
| [1491] |
|
| [1492] |
|
| [1493] |
|
| [1494] |
|
| [1495] |
|
| [1496] |
|
| [1497] |
|
| [1498] |
|
| [1499] |
|
| [1500] |
|
| [1501] |
|
| [1502] |
|
| [1503] |
|
| [1504] |
|
| [1505] |
|
| [1506] |
|
| [1507] |
|
| [1508] |
|
| [1509] |
|
| [1510] |
|
| [1511] |
|
| [1512] |
|
| [1513] |
|
| [1514] |
|
| [1515] |
|
| [1516] |
|
| [1517] |
|
| [1518] |
|
| [1519] |
|
| [1520] |
|
| [1521] |
International Agency for Research on Cancer (IARC), World Health Organization (WHO). Agents classified by the IARC Monographs, volumes 1-131. 2022[EB/OL]. [2024-07-01]. https://monographs.iarc.who.int/list-of-classifications.
|
| [1522] |
|
| [1523] |
|
| [1524] |
|
| [1525] |
|
| [1526] |
|
| [1527] |
|
| [1528] |
|
| [1529] |
|
| [1530] |
|
| [1531] |
|
| [1532] |
|
| [1533] |
|
| [1534] |
|
| [1535] |
|
| [1536] |
|
| [1537] |
|
| [1538] |
|
| [1539] |
|
| [1540] |
|
| [1541] |
|
| [1542] |
|
| [1543] |
|
| [1544] |
|
| [1545] |
|
| [1546] |
|
| [1547] |
|
| [1548] |
|
| [1549] |
|
| [1550] |
|
| [1551] |
|
| [1552] |
|
| [1553] |
|
| [1554] |
|
| [1555] |
|
| [1556] |
|
| [1557] |
|
| [1558] |
|
| [1559] |
|
| [1560] |
|
| [1561] |
|
| [1562] |
|
| [1563] |
|
| [1564] |
|
| [1565] |
|
| [1566] |
|
| [1567] |
|
| [1568] |
|
| [1569] |
|
| [1570] |
|
| [1571] |
|
| [1572] |
|
| [1573] |
|
| [1574] |
|
| [1575] |
|
| [1576] |
|
| [1577] |
|
| [1578] |
|
| [1579] |
|
| [1580] |
|
| [1581] |
|
| [1582] |
|
| [1583] |
|
| [1584] |
|
| [1585] |
|
| [1586] |
|
| [1587] |
(林必桂, 于云江, 向明灯, 余乐洹, 李良忠, 鞠勇明, 玉琳. 环境化学, 2016, 35(3): 466.).
|
| [1588] |
|
| [1589] |
|
| [1590] |
|
| [1591] |
|
| [1592] |
|
| [1593] |
|
| [1594] |
|
| [1595] |
|
| [1596] |
|
| [1597] |
|
| [1598] |
|
| [1599] |
|
| [1600] |
|
| [1601] |
|
| [1602] |
|
| [1603] |
|
| [1604] |
|
| [1605] |
|
| [1606] |
|
| [1607] |
|
| [1608] |
|
| [1609] |
|
| [1610] |
|
| [1611] |
|
| [1612] |
|
| [1613] |
|
| [1614] |
|
| [1615] |
|
| [1616] |
(杨莉莉, 申佳, 刘国瑞, 赵晓光, 郑明辉. 科学通报, 2022, 67(3): 278.).
|
| [1617] |
|
| [1618] |
|
| [1619] |
|
| [1620] |
|
| [1621] |
|
| [1622] |
(李道文, 杨宇航, 丁鑫末. 化学与生物工程, 2023, 40(10): 39.).
|
| [1623] |
|
| [1624] |
|
| [1625] |
|
| [1626] |
|
| [1627] |
|
| [1628] |
|
| [1629] |
(蒋村, 孟宪荣, 施维林, 许伟, 张建荣. 环境工程学报, 2019, 13(7): 1720.).
|
| [1630] |
(迟克宇, 李传维, 籍龙杰, 闫利刚, 刘鹏, 李书鹏, 韦云霄. 环境工程学报, 2019, 13(9): 2049.).
|
| [1631] |
(赵涛, 马刚平, 周宇, 李世青. 环境工程, 2017, 35(11): 178.).
|
| [1632] |
(籍龙杰, 陈芒, 张维琦, 李承志, 余韬, 李书鹏, 詹明秀, 焦文涛. 能源环境保护, 2022, 36(5): 46.).
|
| [1633] |
|
| [1634] |
|
| [1635] |
|
| [1636] |
|
| [1637] |
|
| [1638] |
|
| [1639] |
|
| [1640] |
(陈伟. 南昌大学硕士论文, 2023.).
|
| [1641] |
(陈蕾, 王志鹏. 应用化工, 2019, 48(1): 164.).
|
| [1642] |
|
| [1643] |
|
| [1644] |
(高生旺. 中北大学硕士论文, 2017.).
|
| [1645] |
|
| [1646] |
|
| [1647] |
(刘怡璇, 林跃朝, 马伟芳. 化工进展, 2022, 41(S1): 571.).
|
| [1648] |
|
| [1649] |
|
| [1650] |
|
| [1651] |
|
| [1652] |
|
| [1653] |
(俞明锋, 冯罗澍, 籍龙杰, 詹明秀. 能源工程, 2019 (1): 39.).
|
| [1654] |
(桑义敏, 余望, 籍龙杰, 马福俊, 朱玲, 陈梦巧, 谷庆宝, 李发生. 环境工程学报, 2020, 14(11): 2912.).
|
| [1655] |
(徐帅玺. 浙江大学博士论文, 2018.).
|
| [1656] |
|
| [1657] |
|
| [1658] |
|
| [1659] |
|
| [1660] |
(付建英, 陈彤, 吴海龙, 林晓青, 陆胜勇, 李晓东. 化工学报, 2014, 65(9): 3687.).
|
| [1661] |
|
| [1662] |
|
| [1663] |
|
| [1664] |
|
| [1665] |
|
| [1666] |
|
| [1667] |
|
| [1668] |
(余可, 陈蕾. 应用化工, 2022, 51(10): 3005.).
|
| [1669] |
|
| [1670] |
|
| [1671] |
(李秋爽, 於方, 曹国志, 只艳, 林民松. 环境保护, 2021, 49(10): 13.).
|
| [1672] |
(彭政, 姜晨, 余劭坤. 环境保护, 2023, 51(7): 24.).
|
| [1673] |
(阮挺, 江桂斌. 中国科学院院刊, 2020, 35(11): 1328.).
|
| [1674] |
(杨红莲, 袭著革, 闫峻, 张伟. 生态毒理学报, 2009, 4(1): 28.).
|
| [1675] |
(张丛林, 刘宝印, 邹秀萍, 邢颖, 黄宝荣. 环境保护, 2021, 49(10): 20.).
|
| [1676] |
|
| [1677] |
(翟万江. 中国科技产业, 2013 (8): 11.).
|
| [1678] |
|
| [1679] |
(郑兴灿, 张昱, 贲伟伟, 马春萌, 尚巍, 刘静. 给水排水, 2022, 58(6): 26.).
|
| [1680] |
(江镕. 环境, 2023, (8): 19.).
|
| [1681] |
(钱慧敏, 刘艳娜, 姚林林, 曲广波, 史建波, 江桂斌. 环境化学, 2024, 43(2): 1.).
|
| [1682] |
(江桂斌, 宋茂勇. 环境暴露与健康效应. 北京: 科学出版社, 2020.).
|
| [1683] |
'The Second National Pollution Source Census Bulletin ' release meeting[EB/OL]. (2020-06-10) [2024-07-01]. https://www.mee.gov.cn/ywdt/hjywnews/202006/t20200610_783719.shtml.
|
| [1684] |
(王金南. 中国环境监察, 2022 (4): 44.).
|
| [1685] |
(韦正峥, 向月皎, 郭云, 黄炳昭, 蒋玉丹. 环境科学研究, 2022, 35 (2): 443.).
|
| [1686] |
|
| [1687] |
|
| [1688] |
|
| [1689] |
|
| [1690] |
|
| [1691] |
|
| [1692] |
(黄显雷. 生态经济, 2023, 39(8): 5.).
|
| [1693] |
(赵震雄, 张宇轩, 王丽平, 刘瑞志, 汤利. 环境科学研究, 2023, 36(12): 2393.).
|
| [1694] |
(苏贝, 张琳钰, 陈玲, 余静, 吴兵. 安全与环境工程, 2022, 29(5):91.).
|
| [1695] |
(崔芳溪, 张蓬, 曹胜凯, 郑智轩, 朱超, 葛林科. 环境科学学报, 2024, 44(2): 136.).
|
| [1696] |
(王春花, 蒋萍, 胡伟, 王玉秋. 环境与健康杂志, 2011, 28(1): 82.).
|
| [1697] |
|
| [1698] |
|
| [1699] |
(赵佳敏, 孙玉玲, 滕飞, 秦阿宁. 中国环境科学学会.中国环境科学学会2023年科学技术年会论文集(四).中国科学院文献情报中心, 2023: 6.).
|
| [1700] |
(薛颖昊, 张明明, 徐志宇, 冯良山, 孙占祥, 贾涛, 刘东生. 水产科学, 2023, 42(6):1081.).
|
| [1701] |
(苗令占, 邓肖雅, 杨铮, 李婉逸, 侯俊. 中国环境科学, 2023, 43(11): 6156.).
|
| [1702] |
(崔耘赫. 东北农业大学硕士论文, 2023.).
|
| [1703] |
|
| [1704] |
|
| [1705] |
(张耀花. 北京化工大学硕士论文, 2022.).
|
| [1706] |
(姜忠峰, 梁峰, 刘艳伟, 吴丽. 生态经济, 2022, 38(4): 5.).
|
| [1707] |
(赵静, 王燕飞, 蒋京呈, 葛海虹, 菅小东, 林军. 生态毒理学报, 2020, 15(1): 72.).
|
| [1708] |
|
| [1709] |
(王佳钰, 王中钰, 陈景文, 刘文佳, 崔蕴晗, 傅志强, 宋国宝. 科学通报, 2022, 67: 267.).
|
| [1710] |
|
| [1711] |
|
| [1712] |
(王斌, 邓述波, 黄俊, 余刚. 环境化学, 2013, 32(7): 1129.).
|
| [1713] |
(张丛林, 刘宝印, 邹秀萍, 邢颖, 黄宝荣. 环境保护, 2021, 49(10): 20.).
|
| [1714] |
(王蕾, 邢维龙, 范德玲, 石利利. 环境影响评价, 2023, 45(2): 1.).
|
| [1715] |
|
| [1716] |
RAIS. The risk assessment information system[EB/OL]. (2022-11-15)[2024-07-01]. https://rais.ornl.gov/index.html.
|
| [1717] |
(李仓敏, 张丽丽, 郑玉婷, 林军, 胡俊杰. 现代化工, 2019, 39(S1): 1.).
|
| [1718] |
OECD. Assessment of chemicals-OECD[EB/OL]. (2022-11-15)[2024-07-01]. https://www.oecd.org/chemicalsafety/risk-assessment/.
|
| [1719] |
Danish. Danish (Q) SAR Database[EB/OL]. (2022-11-15)[2024-07-01]. https://qsardb.food.dtu.dk/db/index.html.
|
| [1720] |
|
| [1721] |
(温宥越, 于云江, 孙强, 向明灯, 董辰寅, 党垚, 杨剑. 环境科学研究, 2022, 35(11): 2608.).
|
| [1722] |
(吴爱明, 赵晓丽, 冯宇, 赵天慧, 汪浩, 吴丰昌, 陈瑞. 环境科学研究, 2017, 30(4): 636.).
|
| [1723] |
(许立杰, 乔旭. 绿色科技, 2023, 25(2): 166.).
|
| [1724] |
(邹秀萍, 李振玮, 张丛林, 胥彦玲, 黄宝荣, 楼紫阳. 环境生态学, 2022, 4(2/3): 111.).
|
| [1725] |
|
| [1726] |
(孟小燕, 黄宝荣. 环境保护, 2023, 51(7): 9.).
|
/
| 〈 |
|
〉 |
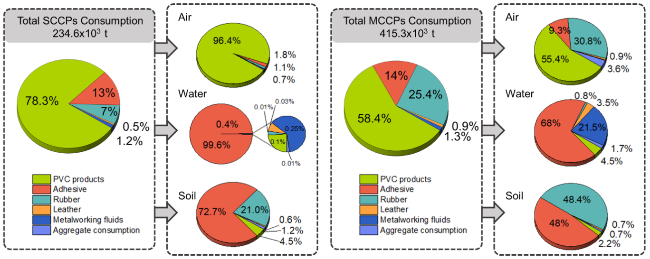
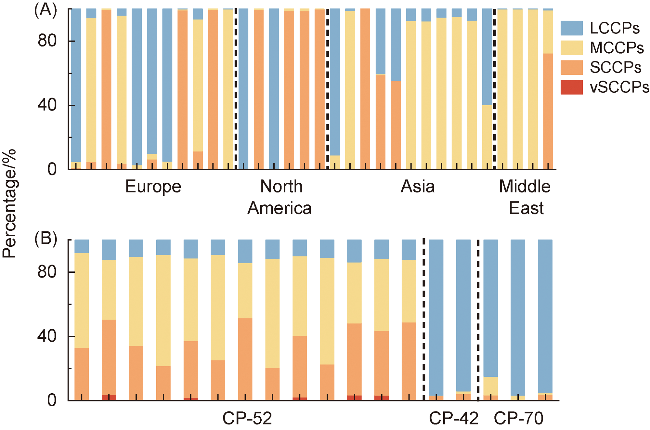
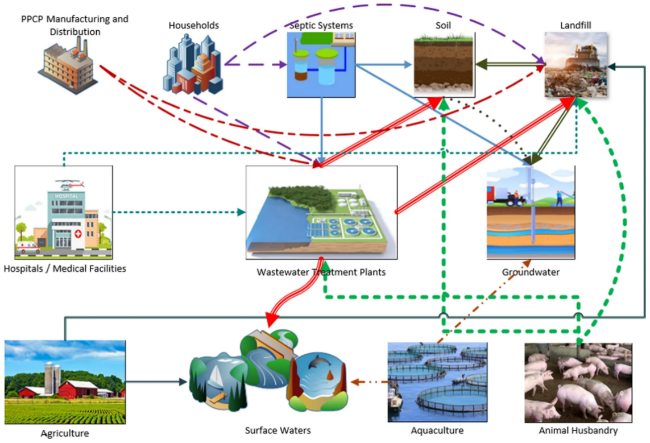
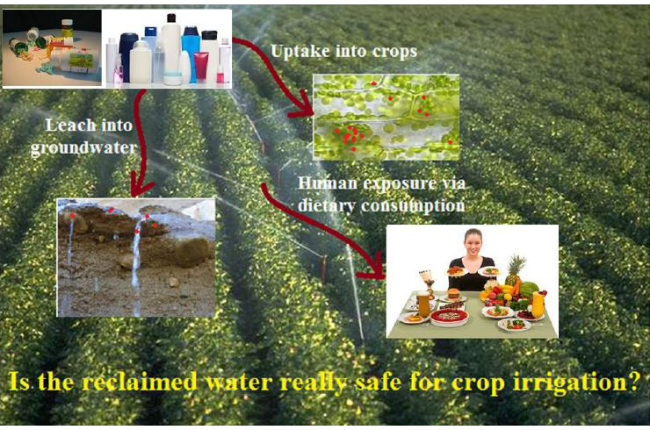
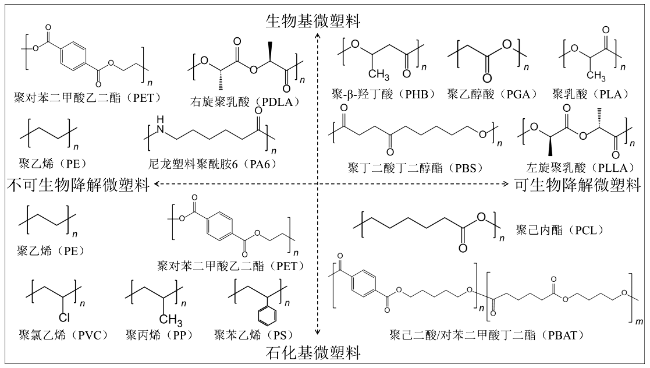
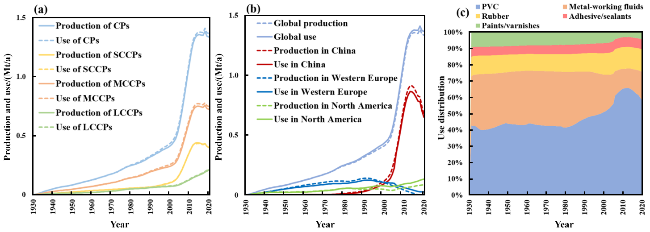
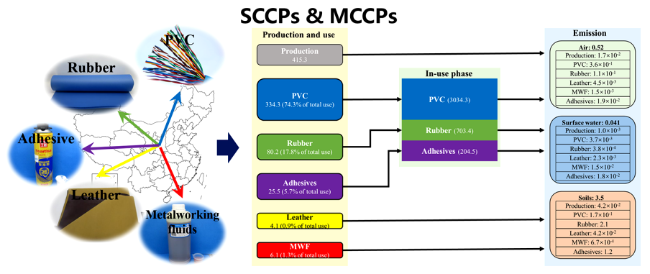
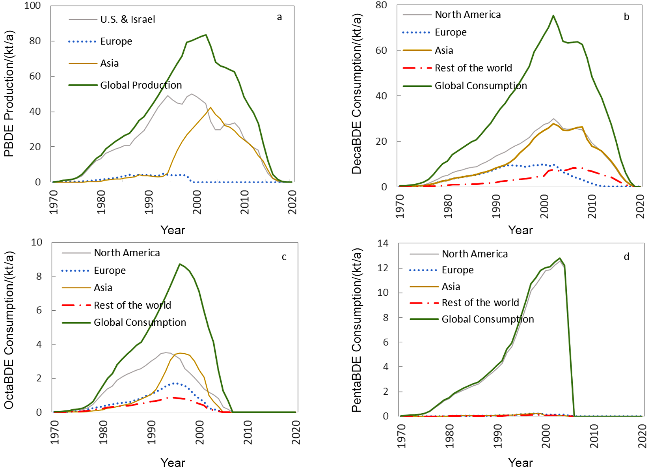
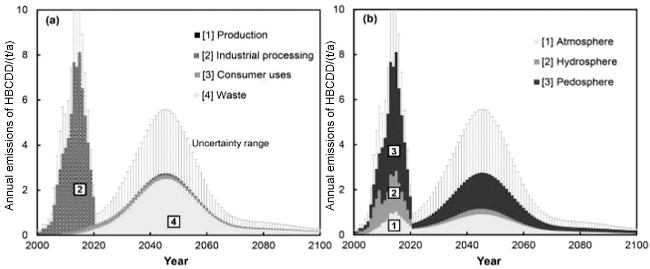
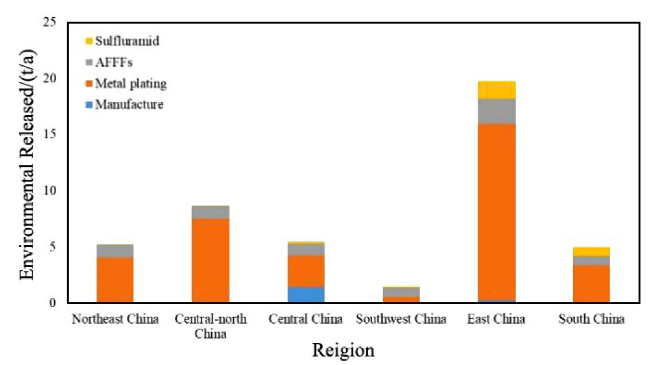
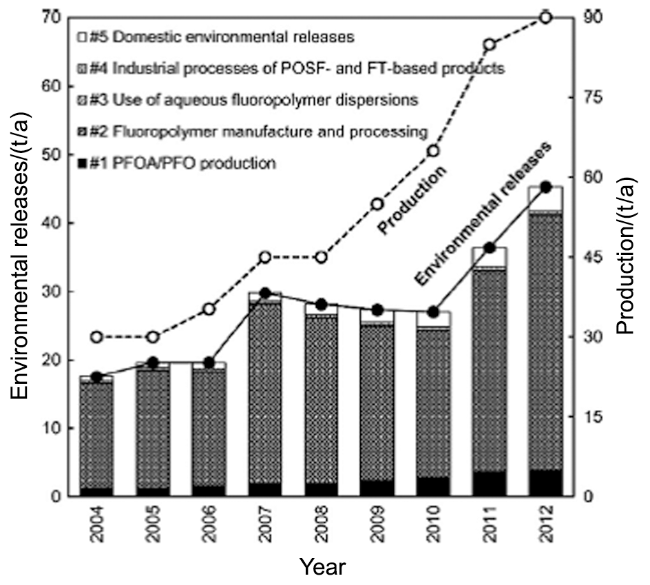
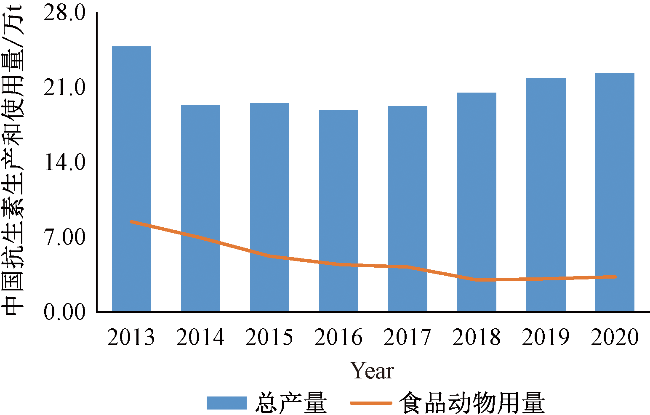
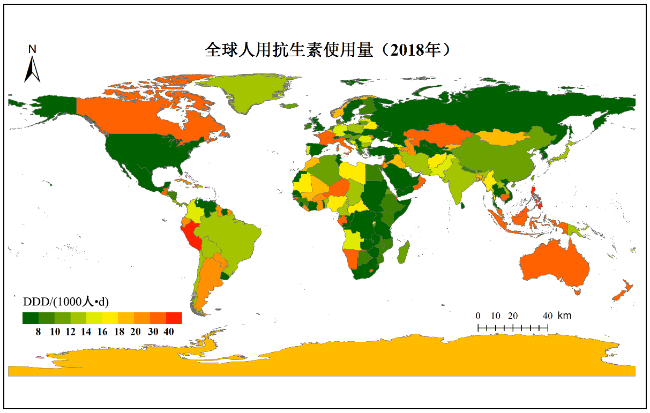
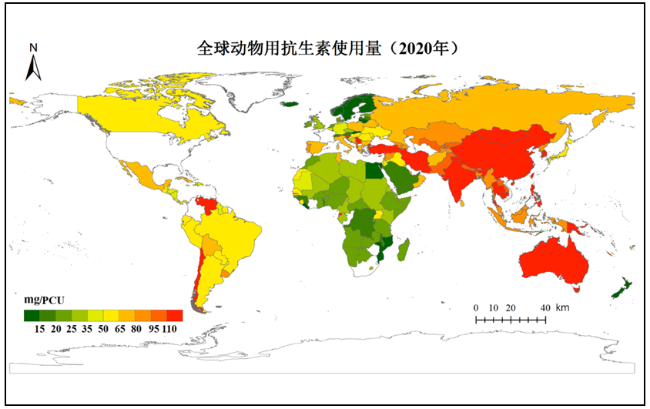
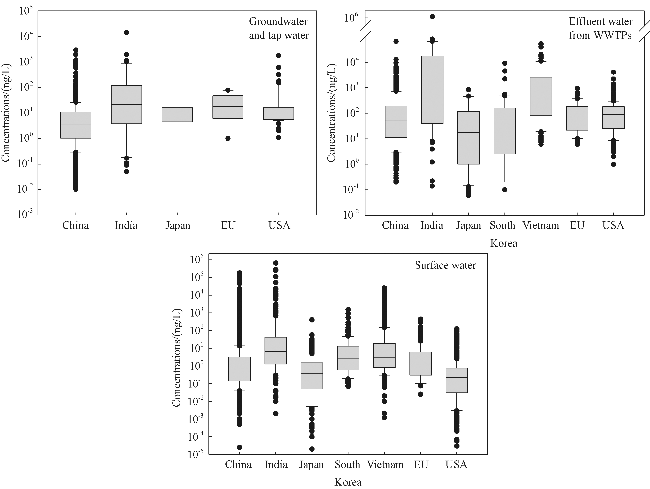
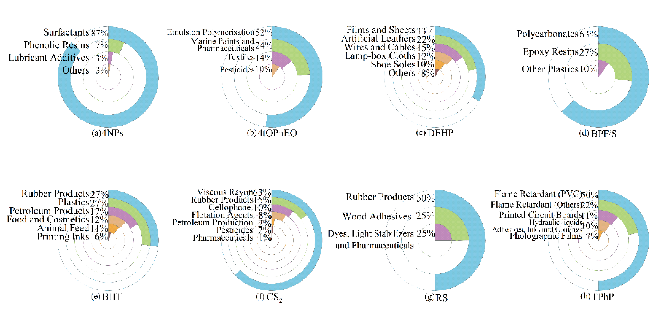
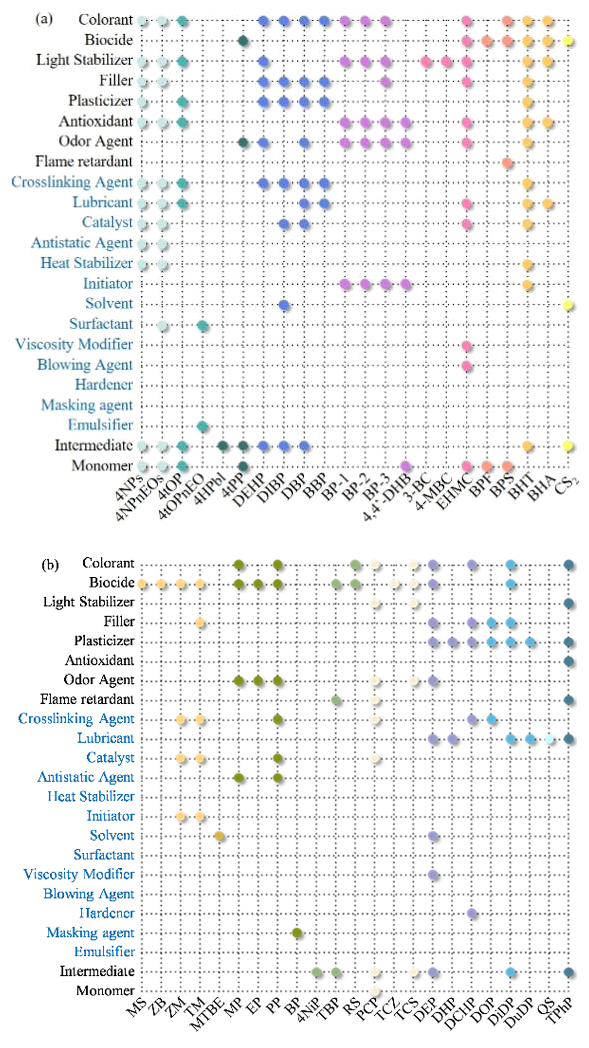
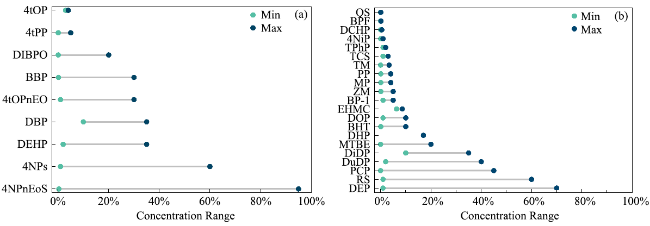
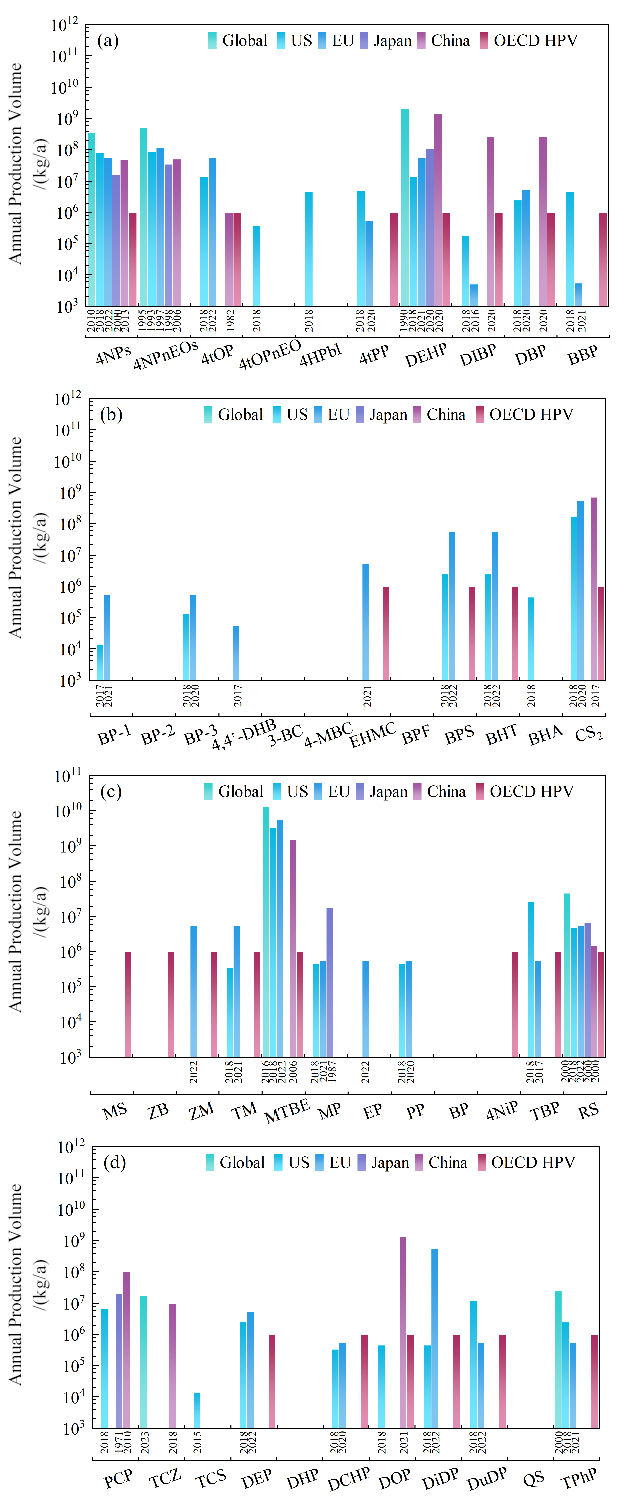
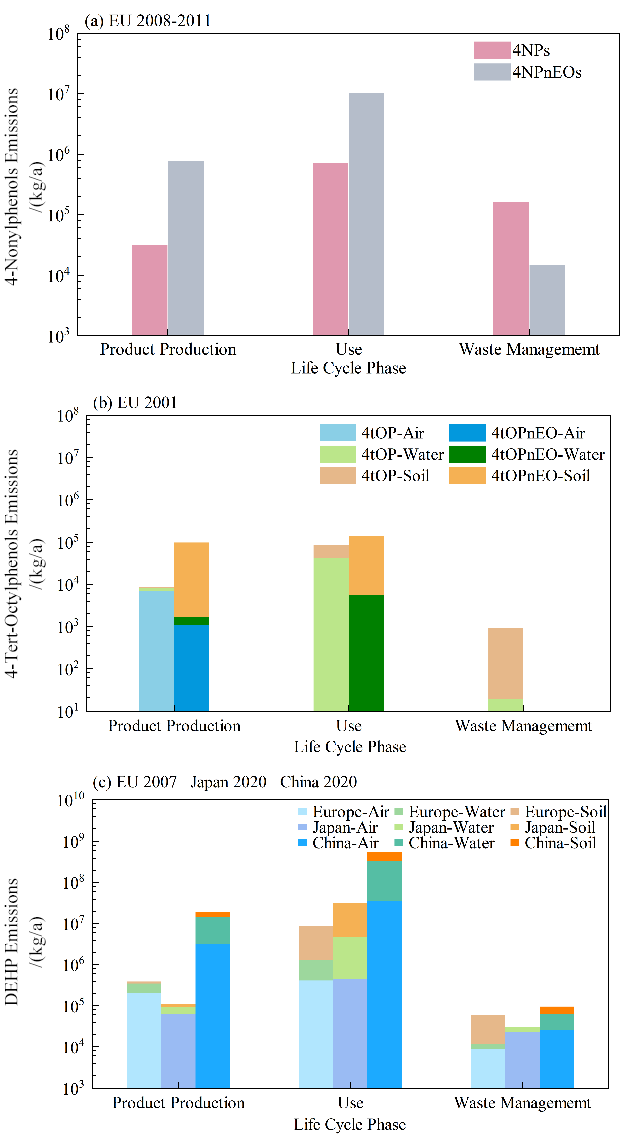
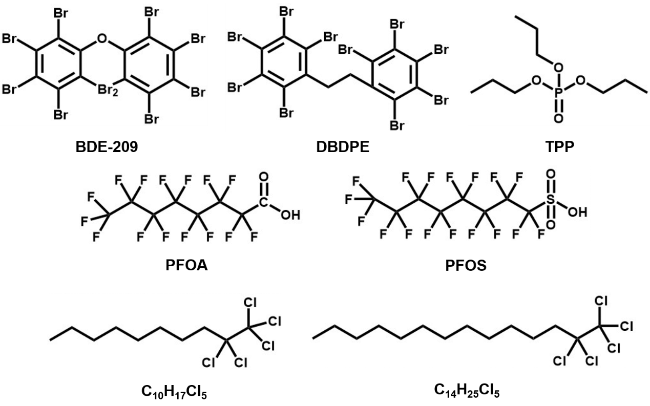
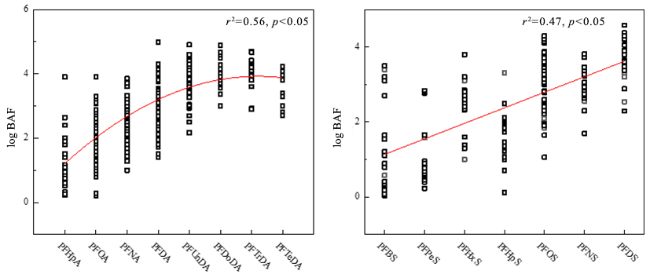
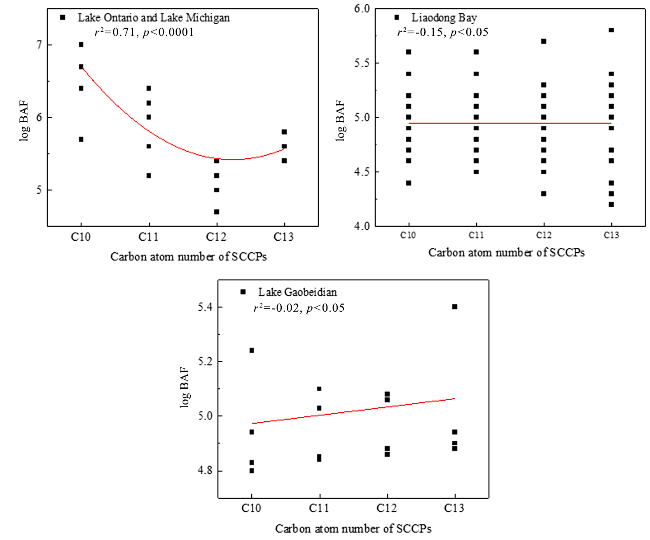
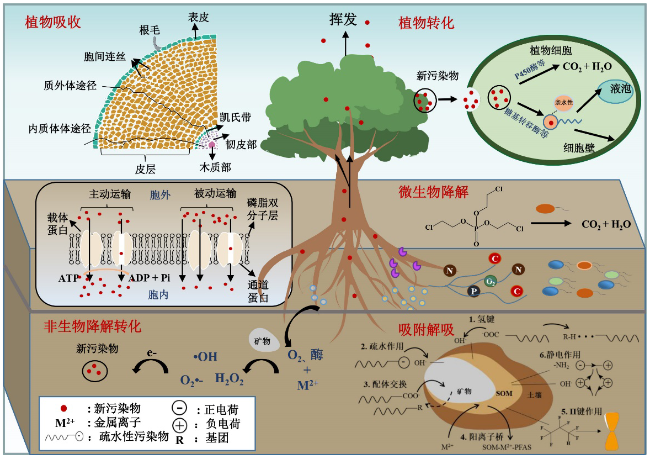
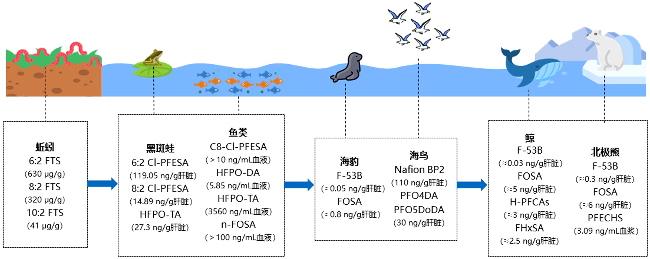
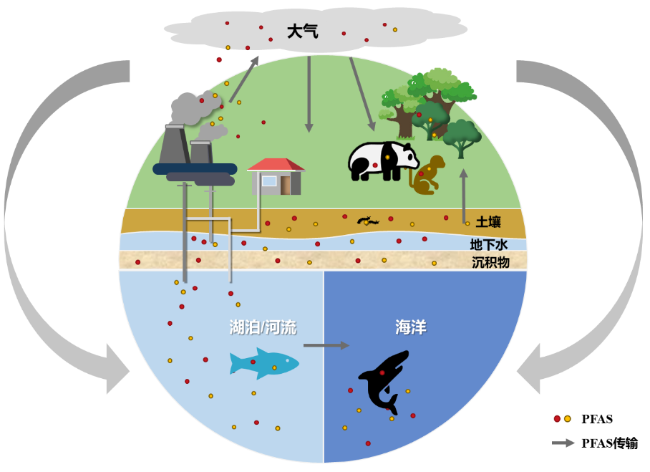
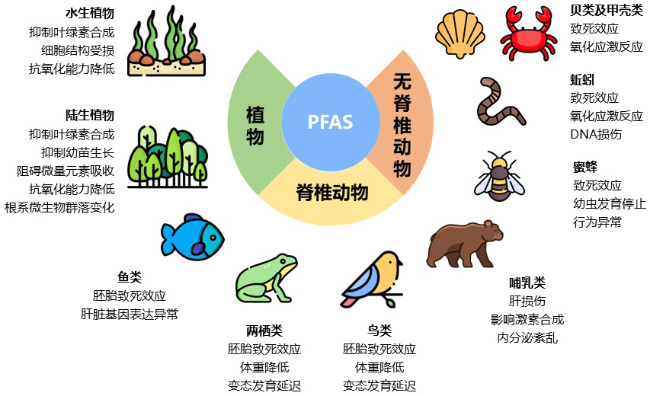
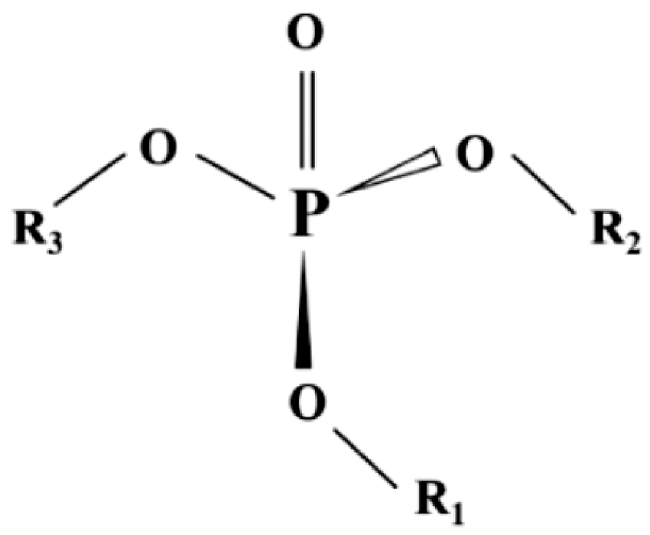
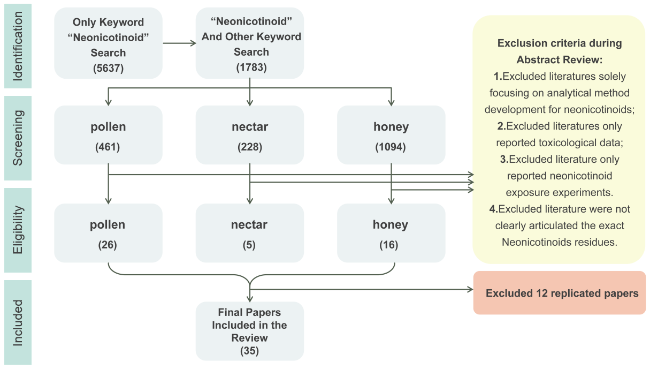
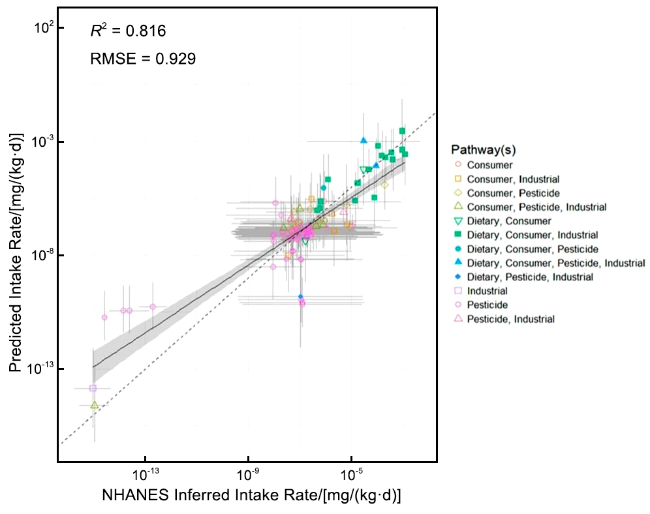
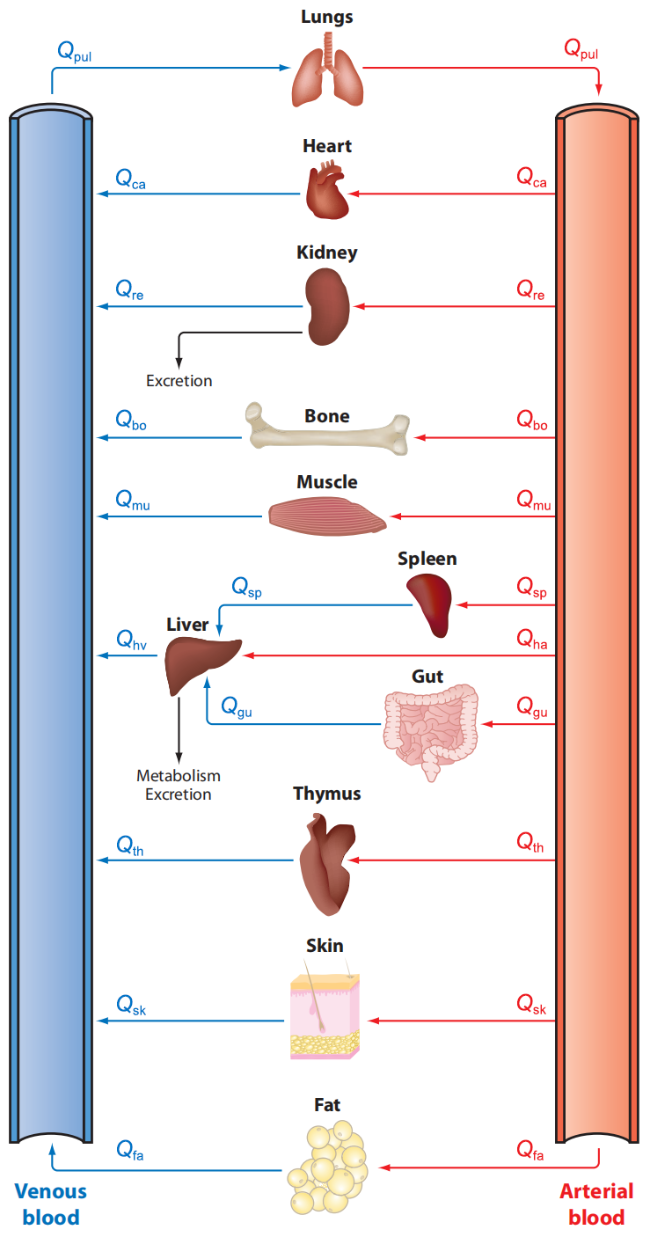
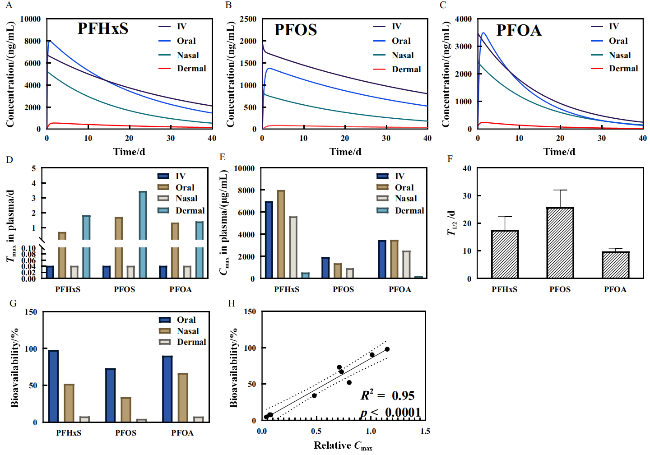
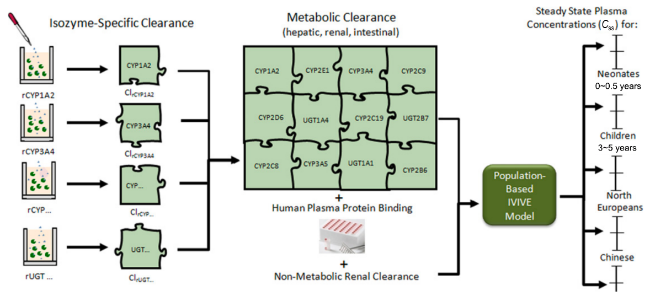
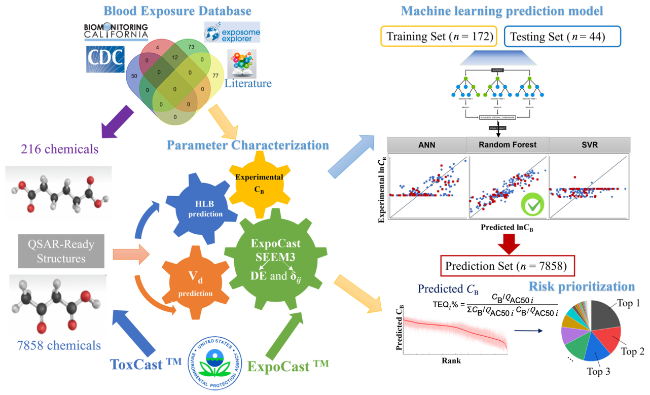
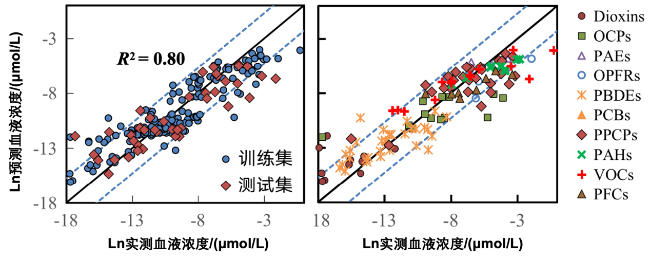
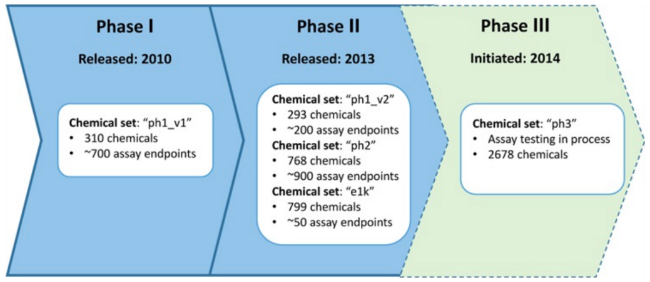
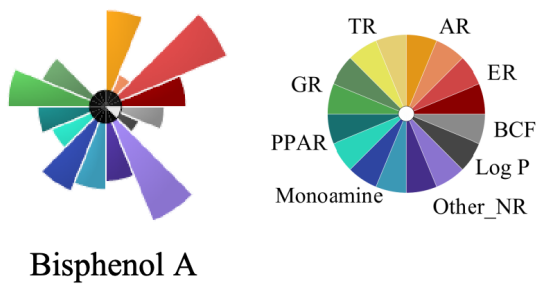
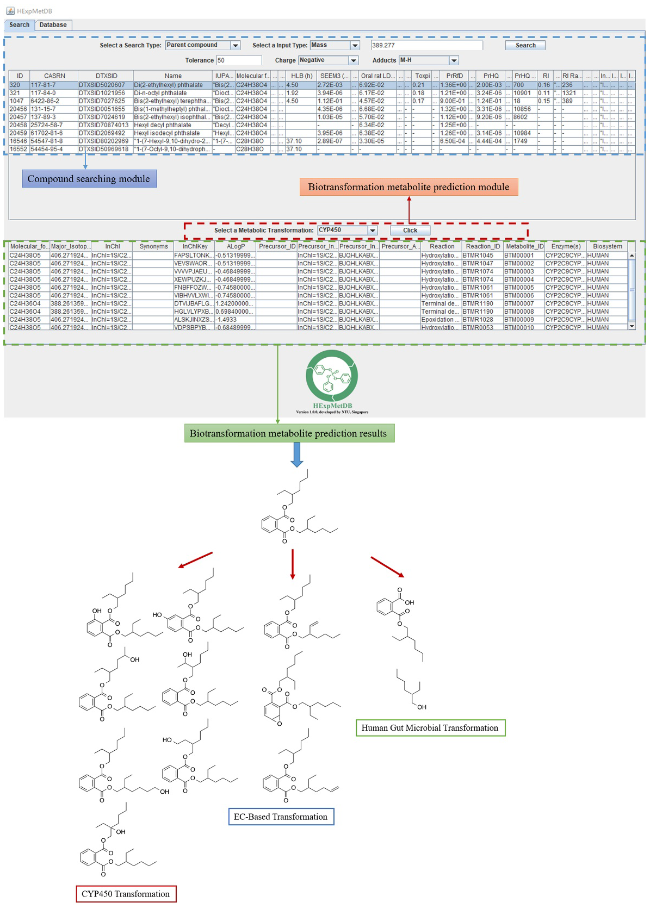
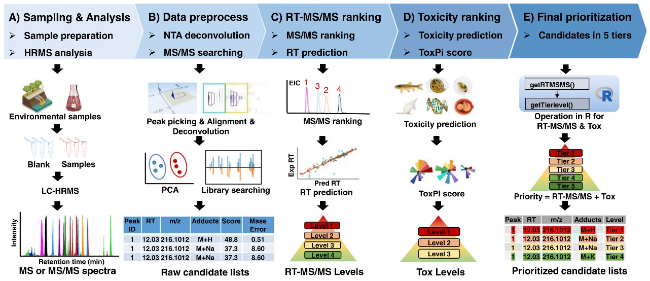
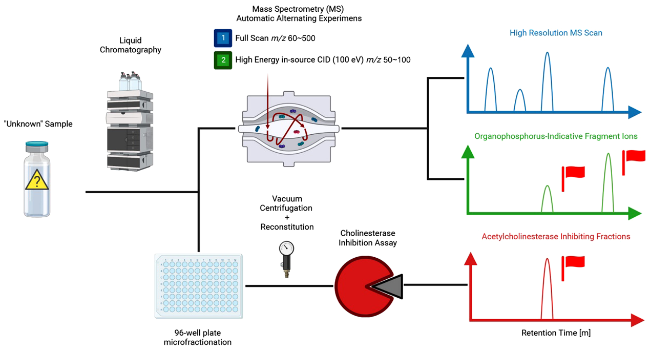
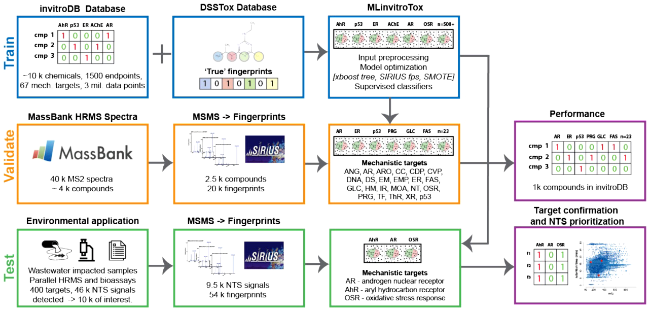
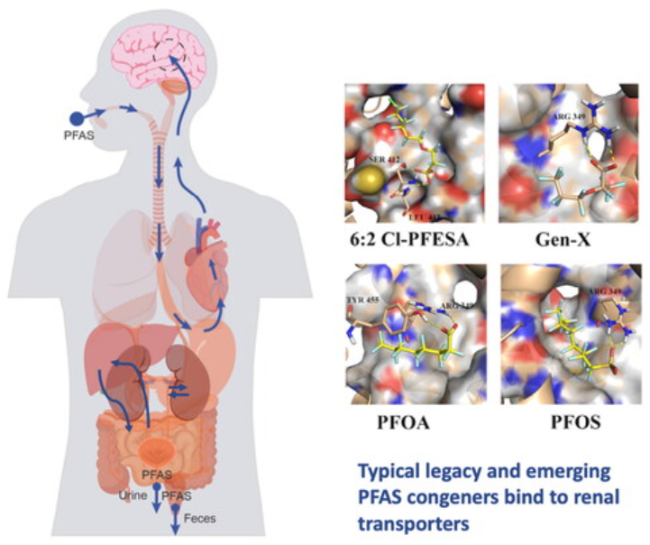
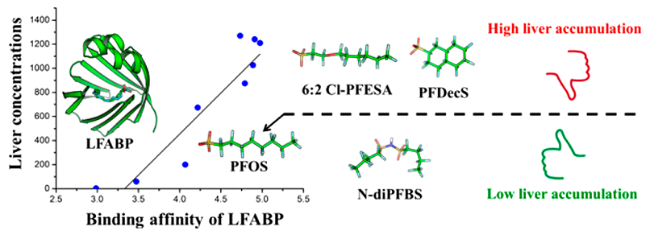
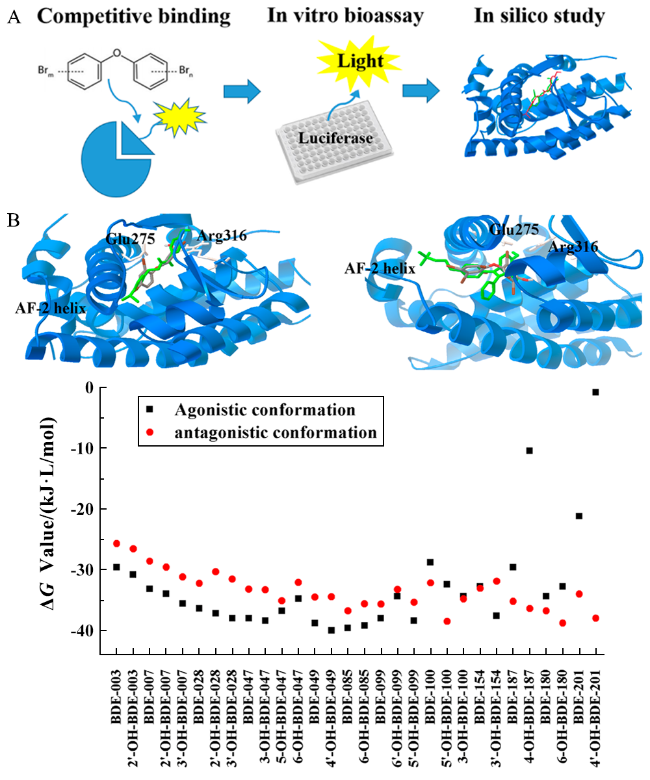
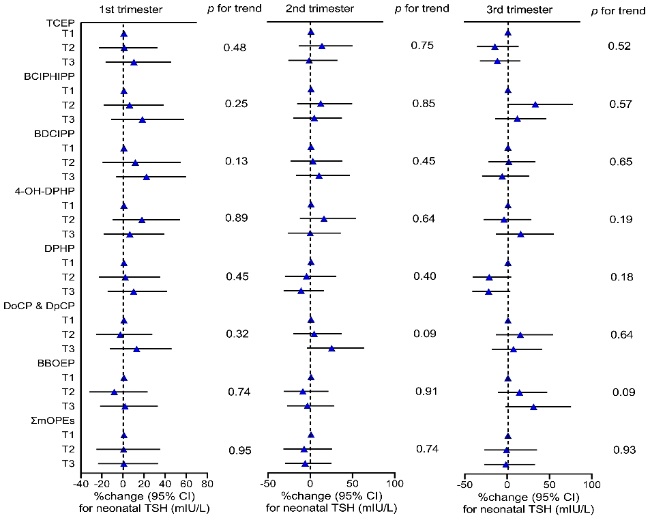
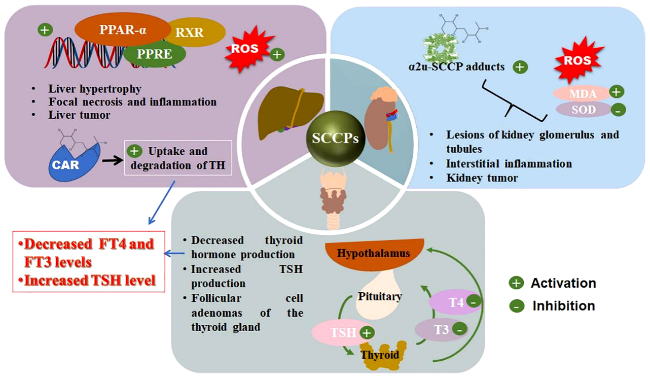

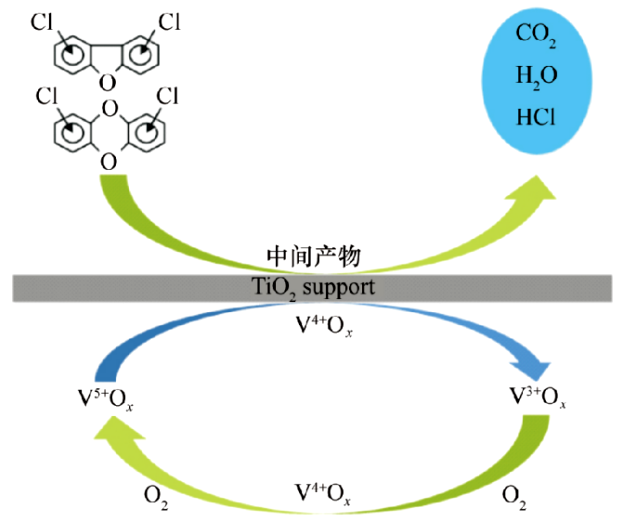
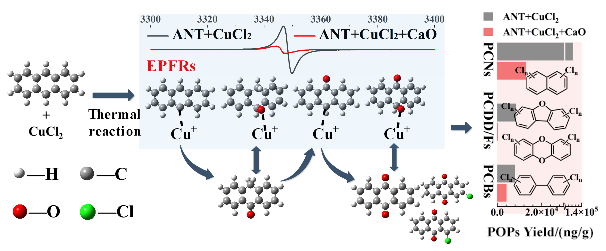