Home Journals Progress in Chemistry
Progress in Chemistry

Abbreviation (ISO4): Prog Chem      Editor in chief: Jincai ZHAO

About  /  Aim & scope  /  Editorial board  /  Indexed  /  Contact  / 
Review

Colorimetric Analysis Utilizing Surface Plasmon Resonance of Nanoparticles

  • Shiwen Wu 1 ,
  • Honogzhi Lu 1 ,
  • Yaxin Li 1 ,
  • Zhiyang Zhang 2 ,
  • Shoufang Xu , 3
Expand
  • 1. School of Chemistry and Chemical Engineering,Linyi University,Linyi 276005,China
  • 2. Yantai Institute of Coastal Zone Research,Institute of Chemistry Chinese Academy of Science,Yantai264003,China
  • 3. School of Materials Science and Engineering,Linyi University,Linyi 276005,China

Received date: 2024-05-08

  Revised date: 2024-10-04

  Online published: 2025-02-10

Supported by

National Natural Science Foundation of China(21777065)

Youth Innovation Project for Colleges of Shandong Province(2019KJA021)

Natural Science Foundation of Shandong Province(ZR2020KE002)

Abstract

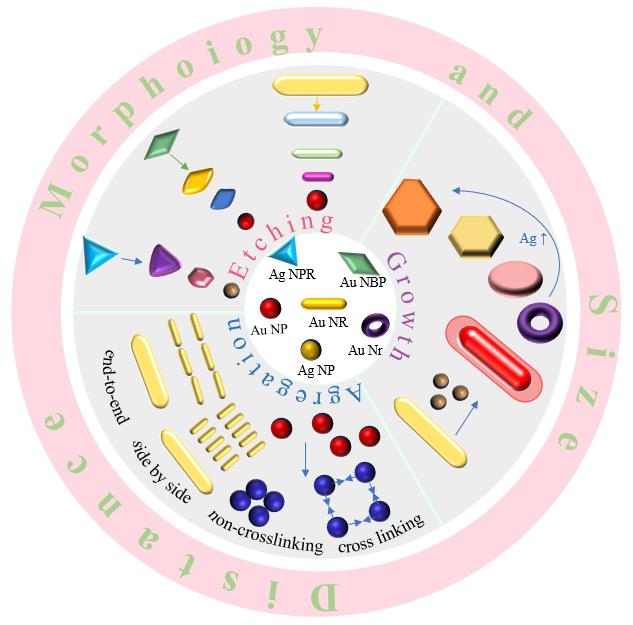
The plasmon resonance LSPR colorimetric sensing based on noble metal nanoparticles has been widely used in many fields such as environment, food safety, and biomedicine due to its advantages of simple operation and low cost. It plays an important role in the detection of important substances such as organic molecules, inorganic ions, DNA, and proteins. In this paper, the principles and applications of two sensing modes based on typical noble metal nanoparticles such as gold nanoparticles, silver nanoparticles, gold nanorods, triangular silver, and gold@silver are summarized: one is LSPR colorimetric sensing based on aggregation; the second is based on the "non aggregation" LSPR sensing caused by etching and growth. At the same time, the response characteristics of noble metal nanoparticles with different chemical composition, size, morphology and surface properties to different analytes were summarized. Aiming at the selectivity problem in colorimetric sensing applications, the construction and use of colorimetric analysis sensor array are briefly introduced. Finally, the problems faced by LSPR colorimetric sensing of nanoparticles are briefly summarized and the research prospects are prospected. In the future, the potential applications of plasma sensors based on noble metal nanoparticles will be further broadened, which will also contribute to the development of simple, sensitive and real-time colorimetric sensing systems.

Contents

1 Introduction

2 Colorimetric sensing based on aggregation

2.1 Colorimetric sensing based on the aggregation of gold nanoparticles (AuNPs) and silver nanoparticles (AgNPs)

2.2 Colorimetric sensing based on aggregation of gold nanorods

3 Colorimetric sensing based on morphology and particle size regulation of metal nanoparticles

3.1 Colorimetric sensing based on the etching of AuNRs

3.2 Colorimetric sensing based on the etching of gold nanobipyramid

3.3 Colorimetric sensing based on the etching of triangular silver (AgNPRs)

3.4 Colorimetric sensing based on the etching of gold-silver bimetallic nanomaterials

3.5 Colorimetric sensing based on nanoparticle growth

4 Colorimetric sensor array

5 Conclusion and outlook

Cite this article

Shiwen Wu , Honogzhi Lu , Yaxin Li , Zhiyang Zhang , Shoufang Xu . Colorimetric Analysis Utilizing Surface Plasmon Resonance of Nanoparticles[J]. Progress in Chemistry, 2025 , 37(3) : 351 -382 . DOI: 10.7536/PC240506

1 Introduction

The metal contains fixed cations and rapidly moving free electrons. When no external force is applied, their interactions can be neglected. At this point, the free electrons can be regarded as an ideal gas without interactions. To maintain electrical neutrality, the positively charged cations are evenly distributed throughout the volume and neutralize the negative charge of the free electrons. Since this model is similar to plasma, it is referred to as plasma in metals. The electron density distribution inside the metal is uneven due to electromagnetic interference, and under the action of Coulomb forces, some electrons will be attracted to regions with an excess of positive charge. Due to the acquisition of momentum, the attracted electrons will not remain at the equilibrium position where attraction and repulsion forces balance, but will move forward a certain distance. Then, the repulsion between electrons will force the gathered electrons to leave the area again, thus forming repeated collective oscillations of the entire electron system. This oscillation, manifested in wave form, is called a plasma wave.
When a beam of light illuminates metal nanoparticles, the incident light drives the collective motion of conduction free electrons on the metal surface, causing the surface electron cloud to deviate from the atomic nucleus. At the same time, the Coulomb interaction between the electron cloud and the atomic nucleus attracts the electron cloud to move towards the atomic nucleus. Thus, electrons collectively oscillate near the atomic nucleus, generating localized surface plasmons. When the size of the nanoparticles is much smaller than the incident wavelength, and the frequency of the incident light matches the oscillation frequency of free electrons, resonance occurs, which greatly enhances the collective oscillation of surface electrons. This phenomenon is called localized surface plasmon resonance (LSPR), and its macroscopic manifestation is the characteristic absorption peak exhibited in the ultraviolet-visible absorption spectrum, referred to as the LSPR peak. The size, morphology, surface composition, and dielectric environment of nanoparticles, as well as the interactions between nanoparticles and other substances, can all cause changes in the LSPR spectrum, leading to significant color changes in the nanoparticle solution macroscopically. Therefore, colorimetric sensing can be constructed based on the direct or indirect changes in the size, morphology, surface composition, and external environment of nanoparticles caused by the target substance.
Compared with optical detection methods such as fluorescence spectroscopy and surface-enhanced Raman scattering, colorimetric analysis methods are widely used due to their simple and inexpensive equipment, easy and rapid operation, visualizable test results, low detection cost, and fast response time. Due to the inherent reasons of the detection method principle, the traditional colorimetric analysis method relying on colored reagents is affected by the complexity of the detection environment and sample diversity, which limits its sensitivity in practical applications1. With the development of nanoscience and technology, the colorimetric analysis method based on the LSPR of metal nanomaterials has become very valuable as an effective and powerful analytical method. An increasing number of metal nanomaterials, such as gold/silver nanoparticles (Au/AgNPs), gold nanorods (AuNRs), gold nanobipyramids (AuNBPs), silver nanotriangles (AgNPRs), bimetallic nanomaterials, etc., are widely used in the construction of colorimetric sensors due to their unique physical and chemical properties, tunable LSPR, high stability, good biocompatibility, and ease of modification, and are widely applied in the detection and analysis of life-related substances and chemical pollutants2-3.
In recent years, researchers have utilized artificial intelligence software, miniaturized devices such as paper chips, and colorimetric sensor arrays to enhance the sensitivity and resolution of LSRP-based colorimetric sensing, making the detection process more convenient and the detection targets more diversified. For instance, image software tools can process colors in digital images captured by cameras, eliminating the inherent subjectivity of human visual perception, significantly improving the sensitivity of colorimetric analysis, and ensuring the reproducibility and reliability of results4-5. Combining paper chips with colorimetric sensing, changes in color intensity and spatial distance of sensing materials on paper substrates enable visual detection. This method does not require specialized equipment and allows direct observation with the naked eye under natural visible light conditions, enabling rapid on-site detection6-8.
This article mainly introduces the plasmon resonance colorimetric LSPR sensing mechanism of noble metal nanoparticles, focusing on the principle and application of two types of sensing modes: aggregation-induced LSPR colorimetric sensing and "non-aggregation" LSPR sensing based on etching and growth. It summarizes the LSPR spectral characteristics and solution color change characteristics of noble metal nanoparticles with different chemical compositions, sizes, morphologies, and surface properties in response to different analytes. Regarding the selectivity issues faced in colorimetric sensing, it briefly introduces the construction and use of colorimetric analysis sensor arrays. Finally, it briefly summarizes the problems faced by nanoparticle LSPR colorimetric sensing and prospects its research future.

2 Colorimetric Sensing Based on Aggregation Construction

To ensure the stable presence of metal nanoparticles in solution, functional groups are typically modified on their surface. Common stabilizers include charged small molecules, polymers, and polyelectrolytes, which stabilize nanoparticles through charge repulsion and steric hindrance, as shown in Fig. 1A and B. Due to plasmonic coupling between nanoparticles, the aggregation of nanoparticles leads to a significant redshift of the LSPR characteristic peak, accompanied by noticeable changes in solution color. Generally, nanoparticle aggregation is divided into two categories: cross-linking-induced aggregation and non-cross-linking-induced aggregation, as shown in Fig. 1B. Cross-linking aggregation refers to the process where, in the presence of target analytes, the analytes interact with modifiers on the nanoparticle surface through hydrogen bonding, metal-ligand coordination, DNA hybridization, aptamer-target interactions, antibody-antigen interactions, etc., overcoming the repulsive forces between nanoparticles and inducing aggregation. Non-cross-linking aggregation occurs when the analyte interacts with the modifiers on the nanoparticle surface after addition, leading to disruption of the stable double electric layer on the particle surface, detachment or reduction of stabilizers from the particle surface, causing significant changes in the surface medium environment, thereby inducing aggregation and changes in solution color. For instance, citrate-modified AuNPs are covered with negatively charged citrate ions on their surface, enabling them to remain stable in water. However, upon the addition of NaCl, the surface charge is shielded by the added salt, resulting in aggregation that falls under non-cross-linking aggregation.
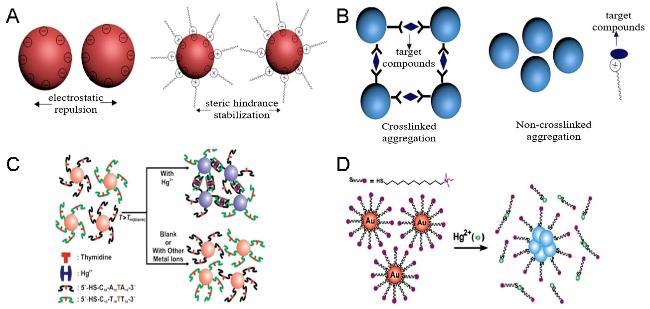
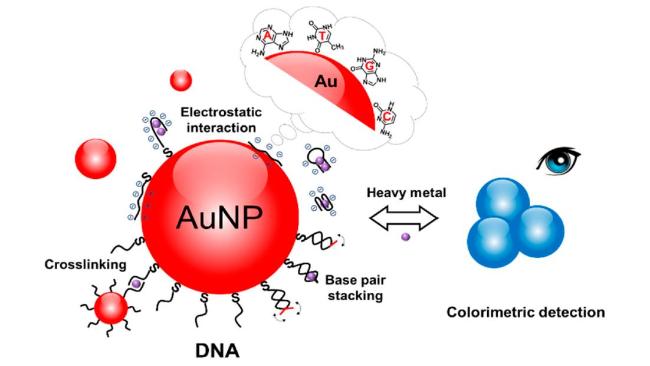
图1 Schematic Diagram of Nanoparticles Stabilized by Charge Repulsion and Steric Hindrance (A), Schematic Diagram of Nanoparticles Based on Cross-Linked Aggregation and Non-Cross-Linked Aggregation (B), Colorimetric Detection of Hg2+ Based on DNA-AuNPs(C)34and Schematic Diagram of Colorimetric Detection of Hg2+ Based on Quaternary Ammonium Group-Capped AuNPs(D)37

Fig. 1 Schematic illustration of nanoparticles based on charge repulsion stability and steric hindrance stability(A), nanoparticles based on cross-linked agglomeration and non-cross-linked agglomeration (B), colorimetric detection of Hg2+(C) based on DNA-AuNPs34 and colorimetric detection of Hg2+ (D) based on quaternary ammonium-terminated AuNPs37. Copyright 2007, Wiley,Copyright 2010, American Chemical Society

2.1 Colorimetric Sensing Based on the Aggregation of Gold Nanoparticles (AuNPs) and Silver Nanoparticles (AgNPs)

Since Mirkin et al9 pioneered the colorimetric analysis work based on AuNPs in 1997, the colorimetric assay method based on nanoparticles has attracted widespread attention. AuNPs, AgNPs, and CuNPs have been used for distance-regulated LSPR colorimetric sensing analysis. Due to the ease of oxidation of CuNPs in solution, there are fewer colorimetric sensors constructed with CuNPs10-11, and most sensing is constructed using AuNPs and AgNPs. Commonly used citrate-modified AuNPs with a particle size of about 13 nm exhibit a bright burgundy red in the dispersed state, with an absorption wavelength of around 520 nm. When the distance between AuNPs agglomerated particles decreases, the solution turns bluish-gray, and the maximum absorption wavelength shifts to 700 nm, as shown in Figure 2A12. In the dispersed state, AgNPs appear yellow, with a maximum absorption wavelength of about 400 nm. Depending on the different causes of AgNPs agglomeration or the nature of the analyte, the agglomerated AgNPs exhibit different colors such as brown, red, purple, etc., and the absorption wavelength shifts, as shown in Figure 2B. By utilizing the above characteristics of AuNPs and AgNPs, designing schemes that selectively cause the agglomeration or dispersion of AuNPs and AgNPs by the analyte can achieve the detection of metal ions, small organic molecules, and macromolecules.
图2 Absorption Spectra and Solution Color Photos of AuNPs12 (A) and AgNPs (B) in Dispersed (1) and Aggregated (2) States

Fig. 2 The absorption spectra and solution color photos of AuNPs12 (A) and AgNPs (B) in dispersion(1)and aggregation(2)states. Copyright 2011, Royal Society of Chemical

2.1.1 Colorimetric Detection Based on Cross-Linked Aggregation

For cross-linked aggregation, different cross-linking methods such as hydrogen bonding cross-linking, metal-ligand cross-linking, and DNA hybridization can be selected for targets like small molecules, metal ions, proteins, DNA, etc. To achieve specific recognition of the target, it is necessary to modify the surface of nanoparticles. For the detection of organic small molecules, the target can form hydrogen bonds with functional groups on the surface of nanoparticles, inducing the aggregation of nanoparticles13-21. A typical example is the use of the amino group in melamine which can form hydrogen bonds with sulfonic acid groups on the surface of AuNPs modified by sodium 3-mercaptopropanesulfonate (generally, one melamine can form hydrogen bonds with three sodium 3-mercaptopropanesulfonates), thereby causing the aggregation of AuNPs, shifting the LSPR of AuNPs towards longer wavelengths, accompanied by the solution color changing from red to blue13. Similarly, a strategy based on nitroguanidine forming hydrogen bonds with uric acid on the surface of AuNPs leading to the aggregation of AuNPs for the colorimetric quantification of nitroguanidine14; detecting morphine based on strong hydrogen bonds formed between the hydroxyl group of morphine and furan oxygen heterocycles with citrate groups existing on the surface of citrate-modified Au@Ag15; detecting triazophos based on triazophos and citrate-modified AgNPs aggregating through hydrogen bonds and π-π interactions, with the color changing from yellow to purplish-red16. The Rujiralai team17 proposed detecting fumonisin B1 based on strong hydrogen bonding between AuNPs with an amino group on cysteamine-modified surfaces and the hydrolyzed product of fumonisin B1 causing AuNPs to aggregate. Fumonisin B1 contains several hydroxyl groups and one aliphatic amine group, which can interact with Cys-AuNPs through hydrogen bonding. However, possibly due to the steric hindrance of macromolecules, the aggregation phenomenon based on direct interaction between non-hydrolyzed fumonisin B1 and Cys-AuNPs is not obvious. By changing the structure of fumonisin B1 into short-chain molecules with multiple hydroxyl groups through hydrolysis, successful induction of AuNPs aggregation was achieved at pH 9, causing a change in the absorption spectrum of the AuNPs colloid from 520 to 645 nm.
For metal ions, cross-linked colorimetric sensing can be constructed by cross-linking nanoparticles through metal coordination between the ions and ligands. For example, triazole ether-functionalized AuNPs coordinating with Al3+ for colorimetric detection of Al3+[22 in seawater; Cd2+ chelating with 2,6-dimercaptopurine-functionalized AuNPs causing aggregation for colorimetric detection of Cd2+[23 in milk, honey, lake water, serum, and urine samples; AgNPs modified by citric acid and polyvinylpyrrolidone (PVP) undergoing aggregation due to metal-ligand interactions with Al3+ for detecting Al3+[24 in tap water, pond water, river water, and mineral water. Similarly, detection strategies based on the metal-ligand interaction between target metal ions and surface ligands of nanoparticles causing gold colloid aggregation have been applied to detect Cd2+[25, Pb2+[26-27, Al3+[28, As3+[29, Co2+[30, Bi3+[31, Hg2+[32, and others.
By utilizing the coordination-induced aggregation between metal ions and ligands, it is possible to not only directly detect metal ions but also indirectly detect substances that can generate these metal ions or inhibit their generation, or expand the detection range to macromolecules such as proteins and bacteria through a sandwich structure. As shown in Figure 3, Zhao et al.33 demonstrated that Mn2+ can induce the aggregation of citrate-modified AuNPs through the interaction of metal ligands with carboxyl groups on the AuNPs surface, and a sandwich-structured immunoassay was used to target the pathogenic bacterium Vibrio parahaemolyticus. The antibody-modified MnO2 particles and antibody-modified Fe3O4 magnetic particles form a sandwich structure through the target pathogen, thereby introducing MnO2 particles in the presence of the target pathogen. Under the reduction of ascorbic acid, MnO2 is reduced to Mn2+, which induces the aggregation of AuNPs. Since the wavelength shift range of AuNPs correlates with the concentration of Mn2+, and the concentration of Mn2+ exhibits a linear relationship with the concentration of the target pathogen, this method can be used to detect Vibrio parahaemolyticus in oyster samples. Meanwhile, based on the sandwich structure, by selecting appropriate antibodies and antigens, the detection targets of colorimetric analysis can be extended to various proteins and bacteria.
图3 Schematic Diagram of Constructing Colorimetric Sensing Based on Sandwich Structure

Fig. 3 Schematic diagram of colorimetric sensing based on sandwich structure

For the nanoparticles used in cross-linking aggregation, they can be the same type of particles modified by the same ligand as mentioned above, or two types of nanoparticles modified by different ligands A and B. The addition of the target substance will cause coordination and chelation recognition between ligands A and B and the target34-36. For instance, the metal ion Hg2+ can form a specific T-Hg-T complex with thymine T. By modifying DNA rich in T bases on the surface of AuNPs, a scheme for detecting Hg2+ is achieved through the mismatch of DNA strands between two adjacent AuNPs to form the T-Hg-T complex, thereby causing particle cross-linking aggregation. As shown in Figure 1C, the Mirkin group34 utilized two different DNA strands to modify gold colloids to form probes A and B. Probe A was modified with 5′HS-C10-A10-T-A10 3′, and probe B was modified with 5′HS-C10-T10-T-T10 3′. Except for the single thymine T-T mismatch, the rest were complementary, so cross-linking aggregation could occur between probes A and B, with the melting temperature Tm of this aggregate being approximately 46 °C. Upon adding Hg2+, the strong coordination between T-Hg-T increased the stability of gold colloid aggregation, raising the melting temperature Tm by about 10 °C. Therefore, detecting Hg2+ at temperatures higher than the melting temperature Tm allows observation of the solution color changing from burgundy red to blue-purple, enabling highly selective detection of Hg2+ in aqueous media.

2.1.2 Colorimetric Detection Based on Non-Crosslinked Aggregation

2.1.2.1 Aggregation Induced by Surface Ligand Exchange

Nanoparticles are stabilized in solution through electrostatic repulsion on their surfaces. When the stabilizers on the surface of nanoparticles are reduced via ligand exchange reactions, leading to weakened electrostatic repulsion, it causes nanoparticle aggregation. As shown in Figure 1D, quaternary ammonium-capped AuNPs were prepared by thiol assembly on AuNPs. Due to the repulsive force of the positive charges of terminal quaternary ammonium salts, the AuNPs are stably dispersed. Under acidic conditions, when Hg2+ is present, the competition between S-Hg and S-Au leads to Hg2+ competitively adsorbing the stabilizers on the surface of AuNPs. The electrostatic repulsion between quaternary ammonium cations and positively charged H+ and Hg2+ can accelerate the displacement reaction, reducing the positive charge on the AuNPs surface. The lack of sufficient charge on the AuNPs surface makes them unstable, causing aggregation-induced color change, thereby achieving highly selective detection of mercury ions in aqueous media[37].
Wu et al.[38] utilized citric acid and TX-100 modified AuNPs for melamine detection in milk based on ligand displacement. The introduction of Triton X-100 will promote the dispersion and stability of citric acid-modified AuNPs. Upon the addition of melamine, its three amino groups can bind through ligand exchange with citrate ions on the surface of AuNPs, causing Triton X-100 to detach from the AuNPs' surface and inducing AuNPs aggregation, which changes the solution color from burgundy to blue. Huang et al.[39] developed a Se(IV) colorimetric detection method based on thioglycolic acid-modified AgNPs (TGA-AgNPs). Through hydride generation, Se(IV) is converted into hydrogen selenide H2Se vapor and introduced into TGA-AgNPs; in weakly alkaline (pH 8.0) solution, H2Se is rapidly oxidized by dissolved oxygen in the solution to elemental selenium, which strongly adsorbs onto the surface of AgNPs, causing TGA to detach from the AgNPs' surface and leading to AgNPs aggregation. As the concentration of Se(IV) increases, the color of AgNPs changes from bright yellow to nearly colorless. This method holds promise for the determination of trace Se(IV) in complex matrix biological and environmental samples.

2.1.2.2 Aggregation Caused by Neutralization of Particle Surface Charge

When the target substance is added to neutralize the charge that stabilizes the nanoparticles, it will cause the aggregation of nanoparticles40-43. For example, the aggregation of AuNPs caused by the neutralization of the surface charge of citrate-modified negatively charged AuNPs with positively charged arginine can be used to detect arginine41; Shanmugaraj et al.42 established a simple and intuitive cysteamine colorimetric assay method using PVP-stabilized AgNPs for the detection of cysteamine in serum. In the presence of cysteamine, strong electrostatic attraction occurs between positively charged cysteamine and negatively charged PVP, and the decrease in electrostatic repulsion leads to the aggregation of PVP-AgNPs, with the solution color gradually changing from yellow to purple. Similarly, based on the charge neutralization effect, Elavarasi et al.43 achieved selective and sensitive colorimetric detection of Cr3+ in aqueous solution using citrate-stabilized AgNPs.

2.1.2.3 Aptamer-Modified AuNPs for Non-Cross-Linked Colorimetric Analysis

In addition to using small molecules to modify the surface of AuNPs for stabilization, DNA chains with specific recognition functions for target substances can also be used to modify their surface so that AuNPs can stably exist in high-salt solutions. The DNA chain can be single-stranded DNA, such as aptamer or DNA enzyme (aptamers are known DNA or RNA sequences that can specifically bind to molecules, ions, or proteins. DNA enzymes are a class of DNA capable of catalyzing reactions such as RNA cleavage, and in many cases, DNA enzymes require metal ions as cofactors). Since the bases exposed on the surface of single-stranded DNA can adsorb onto the surface of AuNPs, the electrostatic repulsion generated by a large number of negatively charged aptamers suppresses strong van der Waals attraction, preventing AuNPs from salt-induced aggregation. The DNA chain can also be double-stranded DNA with terminal mismatches; due to the increased entropic repulsion caused by the wear movement of unpaired bases, AuNPs will remain dispersed even under high ionic strength. As shown in Figure 444, the addition of the target substance can cause the conformational change of single-stranded DNA to detach from the gold colloid surface or pair the bases at the ends of the double strands, thereby weakening the stabilizing effect of DNA and causing the aggregation of AuNPs. This is called colorimetric analysis based on aptamer-modified AuNPs. Aptamer DNA can be introduced onto the gold colloid surface through non-covalent bonds such as electrostatic adsorption, or it can be attached to the gold colloid surface by forming Au-S or Au-N covalent bonds between the gold colloid and the aptamer. Although citrate-capped negatively charged AuNPs repel the polyanionic DNA backbone, there is still mutual attraction, allowing unmodified DNA to adsorb onto the negatively charged AuNPs in a non-covalent bond form. DNA bases interact stably with AuNPs through ring nitrogen, exocyclic amino groups, or keto groups on purine or pyrimidine rings. Adenine A binds to the surface of AuNPs through exocyclic amino groups and N7 atoms, guanine G and cytosine C interact with AuNPs through keto groups and adjacent nitrogen atoms, and thymine T interacts with AuNPs through keto oxygen atoms.
图4 Schematic Diagram of Colorimetric Analysis Based on Aptamer or DNA-Modified Gold Colloids44

Fig. 4 Schematic diagram of colorimetric analysis based on aptamer or DNA modified gold colloids44. Copyright 2020, MDPI

The construction of aptamer-based colorimetric sensors through non-covalent bonds does not require surface modification processes, making the construction simpler. For example, Wang's team45 introduced a Cd2+ aptamer into an AuNPs solution, effectively preventing the aggregation of gold nanoparticles in high-salt solutions. After adding Cd2+, the aptamer detaches from the AuNPs surface and specifically binds with Cd2+ to form a secondary structure, weakening the stabilizing effect of the aptamer on the gold nanoparticles and thereby causing their aggregation under high-salt conditions. The absorption at 520 nm of the colloid significantly decreases while the absorption at 740 nm increases, and the solution color changes from burgundy to purple. Due to the high affinity and specific molecular interactions between the aptamer and the target analyte, this method enables the detection of Cd2+ in water samples. This type of colorimetric sensor exhibits higher sensitivity and selectivity, similar to those utilizing target-specific aptamers modified onto gold nanoparticles for colorimetric detection of environmental toxins such as microcystins (MC-LR)46, antibiotics like ofloxacin (OFL)47, Pb2+[48-49, Hg2+[50-53, proteins54-55, clindamycin56, bacteria57, antimicrobial agents like malachite green58, ractopamine59, and kanamycin60.
Yang et al61 designed two T-rich and mutually complementary DNA strands, which constructed a non-crosslinked colorimetric sensor by forming T-Hg-T complexes. In the absence of Hg2+, due to multiple T-T mismatches in the two strands, the DNA double helix could not be formed, thus being adsorbed on the surface of AuNPs and maintaining the stability of AuNPs under high salt conditions. When Hg2+ was present, the strong T-Hg-T binding caused the two strands to pair into a double helix structure, thereby depriving AuNPs of the protective effect of DNA and causing aggregation. Abnous et al62, with aptamer-modified SiO2 spheres as an auxiliary, designed a colorimetric detection based on resistance to AuNPs aggregation induced by high salt. First, aflatoxin M1 aptamers were grafted onto the SiO2 sphere surface through covalent bonding, then the complementary strand of the aptamer was introduced onto the SiO2 sphere surface to form a DNA double helix via base pairing. When the target aflatoxin M1 was present, its specific strong binding interaction with the aptamer caused the complementary strand of the aptamer to be released, thus stabilizing AuNPs under high salt conditions, enabling their dispersed state to remain stable. If there was no target, no DNA strand would be released, and AuNPs would aggregate under high salt conditions induced by NaCl. Based on this, aflatoxins in milk samples can be detected colorimetrically with high sensitivity.
In addition to using high salt to induce the aggregation of gold colloids, positively charged long-chain polymers such as poly(diallyldimethylammonium chloride) (PDDA), polyethyleneimine (PEI), or the surfactant cetyltrimethylammonium bromide (CTAB) can be employed to induce the aggregation of negatively charged AuNPs for the construction of colorimetric sensors. As shown in Figure 5, Wu et al.63 utilized the surfactant PDDA to induce AuNP aggregation and the aptamer Cd-4 for Cd2+ to construct a colorimetric sensor. In the absence of Cd2+, the negatively charged Cd-4 aptamer hybridizes with the positively charged PDDA to form a stable double-stranded structure, preventing PDDA from adsorbing onto the AuNP surface, thus keeping the AuNPs stably dispersed. Upon the addition of Cd2+, it interacts with the aptamer, causing PDDA to dissociate and inducing AuNP aggregation. Similar colorimetric sensors utilizing the interaction between cationic surfactants and aptamers have been developed for the detection of As3+[64-66, Hg2+[67, and the analyte S1 nuclease68.
图5 Schematic Diagram of Colorimetric Detection of Cd2+ Based on Cationic Polymer-Mediated AuNPs Aggregation 63

Fig. 5 Schematic diagram of Cd2+ detection based on cationic polymer-mediated AuNPs aggregation colorimetric detection63. Copyright 2014, Royal Society of Chemical

In addition to single-stranded DNA modifying and stabilizing AuNPs, peptide fragments are also used to stabilize and modify AuNPs. The reaction between the target and the peptide can be utilized to induce gold colloid aggregation for constructing colorimetric sensors. For instance, Hu et al69 modified the peptide fragment (RFPRGGDD) on the surface of citrate-stabilized gold colloids to detect Ag+ in water samples (lakes, tap water, and drinking water). Since the peptide is negatively charged at pH 7.4, it forms a uniformly charged layer on the surface of the gold colloid, increasing the electrostatic repulsion between AuNPs, thus the peptide-modified AuNPs exhibit better stability. Due to the presence of aspartic acid and arginine in the peptide fragment, which have two free -COOH groups and two free -NH2 groups, they can form a 4-coordinate complex with Ag+, thus the addition of Ag+ causes a conformational change in the peptide, reducing electrostatic repulsion and steric hindrance, further inducing the aggregation of AuNPs. This method has a linear range for Ag+ from 10 to 1000 nM, with a detection limit of 7.4 nM. Based on the stabilization of AuNPs by peptides and the recognition of target substances, bacteria can also be detected70.
The entropy repulsion between AuNPs modified with double-stranded DNA (dsDNA) can regulate the dispersion state of nanoparticles. As shown in Figure 6A, when the outermost DNA base is mismatched, even under high ionic strength, the increased entropy repulsion caused by the unpaired base's abrasive motion will keep the AuNPs dispersed. When the dsDNA is fully matched, base pairing will restrict the flexibility of the DNA ends and lead to hydrophobic interactions between DNA-AuNPs, thereby inducing aggregation of dsDNA-AuNPs71. Based on this, various colorimetric sensors can be constructed by regulating the terminal bases of dsDNA. As shown in Figure 6B, the Takarada team72 modified a 5'-thiol-modified DNA strand onto the surface of 40 nm AuNPs via Au-S bonds, and introduced complementary strands through base pairing, creating T-T mismatched base pairs at the second position from the end, resulting in dsDNA-modified AuNPs. Due to the unpaired T bases at the ends, AuNPs can remain stable under high salt conditions. When Hg2+ is introduced, making the double strands fully paired without mismatched bases at the ends, the gold colloid rapidly aggregates within 1 minute. The detection limit of this method for Hg2+ is 0.5 μM. This method provides a rapid response within 1 minute, does not require temperature control during the analysis process, and has high selectivity. Similarly, based on the regulation of three terminal base pairs, the Kanayama team73 designed a logic gate for simultaneous detection of Hg2+ and Ag+. By adjusting the three terminal base pairs to TTC, only the coexistence of Hg2+ and Ag+ can cause aggregation of AuNPs; when the terminal bases are CTC and CTG respectively, adding Hg2+ and Ag+ alone or simultaneously can both cause aggregation of AuNPs. Meanwhile, based on the mismatch at the end of the base, the recognition of DNA can be precise to a single base74.
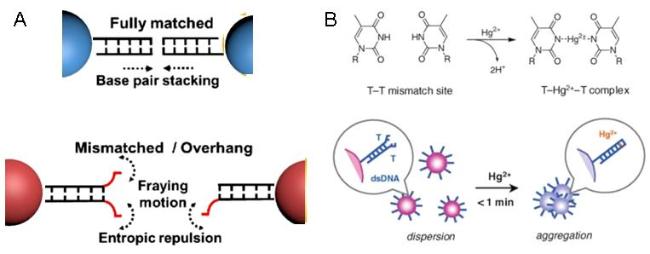
图6 Regulation of dsDNA Terminal Bases Inducing AuNPs Dispersion and Aggregation (A); Schematic Diagram of T-Hg2+-T Complex Formation and Its Induction of dsDNA-Gold Nanoparticle Spontaneous Non-Cross-Linked Aggregation (B)72

Fig. 6 Schematic diagram of the terminal base of dsDNA was regulated to induce the dispersion and aggregation of AuNPs (A); the formation of T-Hg2+-T complex and its induced spontaneous non-crosslinked aggregation (B) of dsDNA-loaded gold nanoparticles72. Copyright 2011, Royal Society of Chemical

2.1.2.4 Aggregation on the Surface of Large-Sized Bacteria

The aggregation of small-sized gold colloids on the surface of large-sized bacteria based on electrostatic interactions enables the colorimetric detection of various bacteria. For instance, the colorimetric detection of multi-drug resistant Salmonella typhimurium DT104 bacteria75, Gram-positive pathogen Staphylococcus aureus76, etc., based on the aggregation of positively charged nanogold stars modified with CTAB on the surface of negatively charged bacteria.

2.1.2.5 Colorimetric Detection Based on the Directional Aggregation of Anisotropic Nanoparticles

AuNPs for colorimetric analysis are generally citrate-modified gold colloids with a particle size of about 13 nm. The surface ligands are evenly distributed on the AuNPs surface, so the aggregation mode of AuNPs is non-directional and uncontrollable, forming large aggregates that easily precipitate in the solution. Therefore, the color of the solution will gradually fade after a period of time. This time-dependent color change significantly reduces long-term stability, thereby decreasing the accuracy of quantitative determination. The surface roughness, shape, and size of gold nanoparticles affect their LSPR performance, which plays an important role in colorimetric sensing. Studies have shown that gold colloids with high surface roughness exhibit better catalytic oxidation performance[77], and as the surface roughness of the gold colloids increases, their LSPR absorption continuously redshifts, leading to a change in the solution's color[78]. On the other hand, the sensitivity of AuNPs-based colorimetric sensing is closely related to particle size. Large-sized AuNPs used in colorimetric analysis can significantly improve sensitivity[79-80]. However, large-particle AuNPs have the issue of relatively low stability. Water-soluble inert groups with relatively long chains can effectively stabilize AuNPs in aqueous solutions. Asymmetric modification of this stabilizer on the AuNPs surface can enhance the stability of large-particle AuNPs and transform the non-directional aggregation behavior of AuNPs into a controllable directional manner, avoiding the formation of large aggregates, thereby improving the time stability of the gold colloid solution. The reasons why directional aggregation colorimetric sensing has higher sensitivity and a wider detection range (over two orders of magnitude) than non-directional sensors can be attributed to the following: first, non-directional sensors cannot detect low target concentrations; second, large aggregates formed by AuNPs in non-directional sensing easily precipitate, while AuNP dimers formed in directional sensing do not easily precipitate.
In 2013, Chen Guonan's team81 used PEG asymmetric modification of AuNPs to explore oriented aggregation for forming dimeric high-sensitivity detection of DNA. Subsequently, they explored the anti-aggregation process, expanding the detection targets from DNA chains to other molecules such as microcystins82. First, gold colloidal particles with asymmetric modifications can be prepared by surface grafting, where 95% of the surface area is modified with PEG and 5% with functionalized DNA. By designing the sequence structure of the DNA, the gold colloids 1 and 2 modified with different DNA strands can be directionally aggregated into dimers under the action of microcystin aptamers. When the target microcystin is present, it interacts with its aptamer, causing the aptamer-stabilized gold colloid dimer to disintegrate into a dispersed state. The solution color changes from blue to burgundy red. As shown in Figure 7, Shi et al.83 used large-particle gold colloids with PEG asymmetrical modification for detecting melamine in milk. First, citrate-modified gold colloids with a particle size of 42 nm were prepared and fixed on a glass surface. Thiol-terminated PEG was grafted onto the gold colloids via "grafting onto" to obtain PEG-asymmetrically modified gold colloids. It was found that if the molecular weight of PEG is large, the addition of melamine cannot cause aggregation of the gold colloids, mainly due to the strong steric effect of relatively long-chain (Mn > 2000) PEG chains that hinder the aggregation of AuNPs. Therefore, AuNPs with a diameter of 42 nm modified with PEG of molecular weight 350 were applied in subsequent experiments. When the concentration of melamine increased from 1 nM to 1 mM, the color of the gold colloids changed from purple to gray. In the UV-visible spectrum, the absorption peak at 730 nm corresponding to directional aggregation increased, while the characteristic absorption peak of PEG 350 AuNPs at 540 nm decreased. Additionally, after adding melamine to the solution of PEG350-AuNPs, unique AuNP dimers or trimers were formed instead of bulk aggregates, indicating controlled and directional aggregation triggered in a limited area on the surface of AuNPs. The detection limit of this method is 1.05 nM, and the sensing is only 1/1000 of the colorimetric method based on non-directional aggregation of small-sized AuNPs. Similarly, Liu et al.84 used PEG-passivated gold colloids modified with 4-aminobenzene as the recognition group to detect NO2- in sausages through directed aggregation of gold colloids. After adding NO2-, the 4-aminobenzene on PEGylated AuNPs was converted into diazonium salts, which further reacted with 4-ABTs on another PEGylated AuNPs to form bis-thiol azobenzene, thereby directionally connecting PEG-passivated gold colloids to form dimers, trimers, and other oligomers.
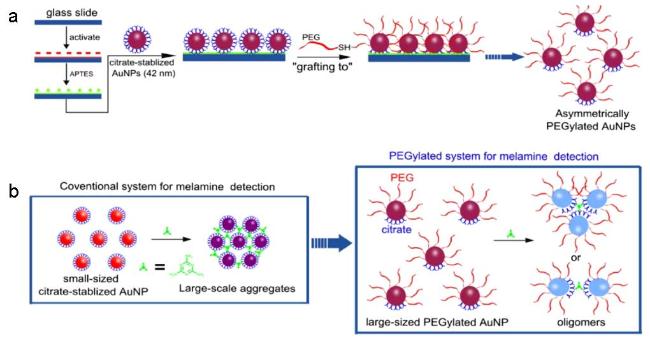
图7 Preparation Process of Asymmetric PEG-Passivated AuNPs and Schematic Diagram of the Principle for Detecting Melamine by Asymmetric PEGylated AuNPs Colorimetric Sensor Compared with the Conventional System83

Fig. 7 The preparation process of asymmetric PEG passivated AuNPs and the principle diagram of asymmetric PEGylated AuNPs colorimetric sensor for melamine detection compared with conventional system83. Copyright 2019, Elsevier

2.1.3 Colorimetric Detection Based on Anti-Aggregation Mechanism

In addition to detecting target substances by inducing the aggregation of nanoparticles from a dispersed state to an aggregated state, the inhibitory effect of the target substance on the aggregation state of gold colloids can also be utilized for detection, changing the gold colloids from an aggregated state back to a dispersed state. Typically, an aggregation inducer is first added to the nanoparticles to cause aggregation, then the addition of the target substance interacts with the aggregation inducer, weakening the aggregation of the nanoparticles and thereby dispersing them, resulting in a color change from blue to red. The human eye is more sensitive to color changes from blue to red, thus such sensors have higher sensitivity. For different aggregation methods, reverse cross-linking can also occur through electrostatic interactions and steric hindrance effects. For example, Chen et al.85 covalently linked PLP to Cyst-AuNPs by forming a Schiff base through the reaction between the primary amine of cysteamine (cyst) on the surface of AuNPs and the aldehyde group of pyridoxal phosphate (PLP), which reduced the surface charge of Cyst-AuNPs and weakened the electrostatic repulsion between AuNPs leading to aggregation. Due to the presence of a strong basic -CHO group and a pyridoxal-OH group in its molecular structure, PLP can also act as a bidentate ligand to coordinate with Sc3+ forming a stable complex, effectively inhibiting the formation of the Schiff base and causing Cyst-AuNPs to tend towards dispersion. Therefore, Sc3+ competes effectively with Cyst-AuNPs for binding to PLP, leading to anti-aggregation of Cyst-AuNPs. Luo et al.86 used Cu2+ as an aggregation inducer to induce the aggregation of arginine-functionalized AuNPs through coordination with amino acids. When I- is present, Cu2+ undergoes a redox reaction with I- to form stable CuI. As the concentration of I- in the solution increases, the concentration of Cu2+ decreases, thereby inhibiting the aggregation of AuNPs. Thus, the aggregation-disaggregation process of AuNPs based on Cu2+-induced redox reactions can be used for the quantitative determination of I- in drinking water and salt samples. Based on the mechanism of inducer-induced aggregation and target substance-induced disaggregation, it can be used to detect Ag+[87], SCN-[88], metsulfuron-methyl89, malathion90, anionic surfactants91, DNA92, organophosphorus pesticides93, etc.
Xue et al94 proposed a rapid detection method for HCl in aqueous media based on the aggregation of gold colloids. They found that GSH can bind to AuNPs through strong Au-S bonds and expose two carboxyl groups and amino groups to stabilize the AuNPs. GSH-AuNPs can be induced to aggregate by effects such as amino/carboxyl binding, electrostatic effects, and centrifugal effects when metal ions are added or under high-speed centrifugation. However, the aggregated AuNPs can return to a stable dispersion state after the addition of HCl. This is because the amino and carboxyl groups on GSH are protonated in an acidic environment and form N-H…Cl and O-H…Cl hydrogen bond complexes with Cl- ions, leading to the reactivation of electrostatic repulsion between AuNPs, thereby causing the GSH-AuNPs to redisperse. Based on this, they proposed a rapid detection method for HCl with a response time of less than 1 second.
Similarly, anti-aggregation colorimetric sensing can be constructed based on aptamer DNA strands. The aptamer colorimetric sensing constructed using negatively charged AuNPs may interact with the target to induce AuNP aggregation under high salt conditions, resulting in false positive signal output. Positively charged AuNPs provide a new approach for aptamer-based colorimetric sensing. Cysteamine is the shortest amino thiol, providing thiol and amine groups to interact with AuNPs, making the surface of cysteamine-modified AuNPs net positively charged, which can easily aggregate with negatively charged DNA through electrostatic adsorption without the need for high salt conditions. When the target is present and interacts with its aptamer DNA, it weakens the interaction between the aptamer DNA and AuNPs, causing the aggregated AuNPs to disperse and the solution color to change from blue to red. For example, in 2013, Xiang's team95 constructed an anti-aggregation colorimetric sensor using cysteamine-modified AuNPs and lysozyme aptamers. The addition of the target lysozyme caused a color change of the gold colloid from bluish-purple to red. In 2020, New’s team96 further studied the anti-aggregation colorimetric sensing system constructed with cysteamine-modified AuNPs and lysozyme aptamers and found that there is a critical re-dispersion concentration (CRC) for lysozyme aptamers. When lysozyme aptamers were added to the cysteamine-modified AuNPs system at low concentrations, it would cause AuNPs to aggregate. When the aptamer concentration exceeds a certain value (CRC), due to the formation of an anionic aptamer layer on the surface of AuNPs, the aggregated AuNPs would redisperse and stabilize. Based on this, they constructed two modes of detection for lysozyme by controlling the aptamer concentration: aggregation and anti-aggregation. When the aptamer concentration is below CRC, the dispersion mode is adopted, and the addition of the target lysozyme will cause the aggregated gold colloid to redisperse. When the aptamer concentration is above CRC, the aggregation mode is adopted, and the addition of the target lysozyme will cause the dispersed gold colloid to aggregate. In addition, the anti-aggregation aptamer colorimetric sensing based on positively charged cysteamine-modified AuNPs has been applied to detect substances such as melamine97 and serine protease thrombin98.
Aptamer-based anti-aggregation colorimetric sensing can also be applied to the anti-aggregation of cross-linked aggregated gold colloids. The commonly used construction strategy is to initially use aptamers to connect two types of DNA-functionalized AuNPs to form aggregates. The addition of the target interacts with the aptamer, causing the hybridized DNA to unwind and the aggregated gold colloids to disperse. For example, Lu et al.99 connected two types of DNA-functionalized AuNPs with DNA containing an adenosine aptamer to induce aggregation. The first 12 bases of the connecting DNA are complementary to the DNA on AuNPs-1, and the last 12 bases (of which 7 belong to the adenosine aptamer) are complementary to the DNA on AuNPs-2. In the presence of adenosine, binding to the aptamer results in only 5 of the original 12 bases on the connecting DNA that are complementary to AuNPs-2, leading to the AuNPs no longer being cross-linked, and the color changing from purple to red. Unlike the AuNPs assembly process, its disassembly can be completed within seconds. Additionally, the method of using analytes to disassemble AuNPs aggregates can also be used to detect other small molecules and protein enzymes100-101.
The substrate can be cleaved by the cutting action of Pb2+ DNA enzyme, thereby constructing an anti-aggregation colorimetric sensor. The scheme can be represented by the following types (Figure 8): (1) Cutting the linking DNA, thus causing the cross-linked aggregation to disassemble. (2) The long-chain DNA substrate breaks at specific positions, forming short-chain DNA, thereby releasing ssDNA which gets adsorbed on the surface of AuNPs [102-105]. Under the stabilization of the DNA strand, the self-agglomeration state of gold colloids converts to a dispersed state to protect the gold colloids and avoid non-crosslinked aggregation. (3) Based on the cutting action of Pb2+ DNA enzyme, the length of the DNA chains modified on the surface of gold colloids is increased, thus enhancing the size exclusion effect and stabilizing the gold colloids [106].
图8 (a~c) Several Forms of Colorimetric Sensing Based on Pb2+ DNA Cleavage Enzyme Construction

Fig. 8 (a~c) Several forms of colorimetric sensing based on Pb2+ DNA cleavage enzyme

Cu@Au chain-like core-shell nano-materials responsive to iodide ions are also used for anti-aggregation colorimetric analysis. The chain-like aggregate Cu@Au core-shell nano-materials do not require any surface modification and can interact with iodide ions, transforming from chain-like aggregates to spherical particles, accompanied by a blue shift in the solution spectrum and an evident change in solution color from gray to red. Utilizing the aforementioned characteristics of Cu@Au chain-like core-shell nanomaterials responsive to iodide ions for colorimetric detection of Hg2+[107, Ni2+[108, dopamine109, and other substances. For instance, Zhang's team109 developed a colorimetric detection method based on iodine-responsive Cu@Au chain-like core-shell nano-materials to detect dopamine in urine and serum. In the absence of dopamine, iodide ions chemically adsorb onto Cu@AuNPs, which alters the surface potential of Cu@AuNPs and the van der Waals forces between nanoparticles, leading to fusion and splitting of nanoparticles, causing the Cu@AuNPs to transition from their initial chain-like aggregated state to split single spheres, turning the solution pink during this process. In the presence of dopamine, dopamine can bind to Cu@AuNPs through hydrogen bonding and van der Waals forces while acting as a capping agent; simultaneously, the amino groups on dopamine can form Au—N bonds with gold and adsorb onto the surface of Cu@AuNPs, reducing the adsorption of iodide ions and preventing the nanoparticles from transforming from chains to spheres, keeping the solution tone gray. This process can be verified by X-ray photoelectron spectroscopy (XPS). The binding energy of I 3d5/2 in KI is 619.3 eV, and after interaction between Cu@Au NPs and I-, the binding energy of I 3d5/2 shifts from 619.3 eV to 618.4 eV, indicating the production of zero-valent iodine, mainly due to the chemical adsorption of I- and electron loss. When DA is present in the system, the binding energy of I 3d5/2 is at 619.1 eV (similar to that of I 3d5/2 in KI), indicating that most I remains in the ionic state and DA inhibits the reaction of I- with Cu@AuNPs.

2.2 Colorimetric Sensing Based on the Aggregation of Gold Nanorods

Gold nanorods (AuNRs) are elongated nanoparticles generally prepared through a seed growth method110, and they carry a positive charge due to the CTAB coating on their surface. AuNRs exhibit two resonance absorption bands, transverse and longitudinal, as shown in Figure 9A, corresponding to electron oscillations along the surface of the AuNRs and perpendicular to the surface of the AuNRs, respectively. The longitudinal LSPR absorption wavelength of AuNRs is typically around 525 nm, and as the aspect ratio of AuNRs increases, the transverse LSPR wavelength falls between 600~800 nm, causing the solution to display various colors such as brown-yellow, gray, cyan, green, blue, purple, red, and yellow, as shown in Figures 9B and C111. In the application of AuNRs for colorimetric sensing, most approaches involve altering their shape and size to affect their LSPR characteristic peaks, resulting in visible color changes in the solution. Compared with non-directional aggregation based on spherical nanoparticles, AuNRs aggregation has directional characteristics. Due to the anisotropy of AuNRs, side-by-side and end-to-end directional assembly methods can be adopted. Particularly for the end-to-end mode, it exhibits different long-range ordered one-dimensional superstructures with higher sensitivity, easier controllability, and more reliable signal output. Compared with spherical AuNPs, the color of AuNRs solutions is more sensitive to changes in the microenvironment112.
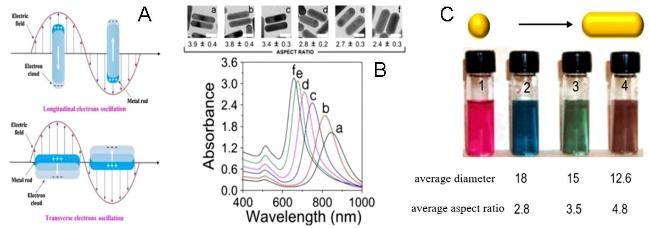
图9 AuNRs with Two Resonance Absorption Bands (A) and UV Absorption Spectra (B) and Solution Color Changes (C) of AuNRs with Different Aspect Ratios111

Fig. 9 The transverse and longitudinal resonance absorption bands(A)of AuNRs and the UV absorption spectra(B)and solution color changes(B)of AuNRs with different aspect ratios111. Copyright 2002, American Chemical Society

The ends of AuNRs are composed of face-centered cubic structure {111} facets, and the sides are composed of {100} and/or {110} facets. Since the {111} crystal plane is the closest packed structure of gold atoms, the surface energy of the ends is lower compared to the sides. Therefore, CTAB involved in the synthesis of AuNRs strongly binds to the sides of AuNRs. Modifiers containing thiol groups can preferentially bind to the ends of AuNRs through Au—S bonds. In end-to-end interactions, AuNRs aggregate to form linear or chain aggregates, causing a redshift in their longitudinal plasmon resonance absorption peak. As the number of aggregated gold nanorods increases, the longitudinal plasmon resonance absorption peak exhibits a greater redshift, while its transverse LSPR peak shows no significant change. In the "side-by-side" aggregation mode, functional groups preferentially bind to the {110} and {111} crystal planes of gold nanorods, thereby functionalizing the sides of the gold nanorods. The specific reaction between the analyte and the functionalized ligands on the sides of the gold nanorods leads to "side-by-side" aggregation of the gold nanorods, resulting in a blueshift in their longitudinal plasmon resonance absorption peak and a redshift in the transverse plasmon resonance absorption.
As shown in Figure 10, in 2010, the Xu team [113] used microcystin MC-LR as an example to thoroughly explore the end-to-end aggregation and side-by-side aggregation based on AuNRs. They prepared two different types of AuNRs: one modified with MC-LR antibodies or MC-LR antigens on the sides of the AuNRs, and the other modified with antibodies or antigens at the ends of the AuNRs. Due to the larger contact area on the sides, resulting in stronger electrostatic interactions, antibodies were attached to the sides of the AuNRs using electrostatic interactions. Due to the strong interaction between the gold surface and active thiols, the ends of the rods were modified by covalent bonding through S-Au bonds. When MC-LR is absent, specific interactions between antibodies and antigens cause the AuNRs to aggregate end-to-end and side-by-side. When MC-LR competes with MC-LR antigen for binding to the MC-LR antibody, it leads to the dispersion of aggregates. Chains formed by end-to-end aggregated AuNRs are optically approximated as nanowires. When MC-LR is added causing the dispersion of aggregates, the effect can be described as a sharp decrease in the aspect ratio of the nanowires, with the longitudinal LSPR peak of the newly formed much shorter nanorods shifting towards the blue part of the spectrum and increasing in amplitude, while the transverse LSPR remains unchanged in both wavelength and amplitude. When the concentration of MC-LRs is 100 ng·mL-1, the original longitudinal peak at 900 nm almost disappears, and a new single AuNRs longitudinal peak appears at 700 nm. The transverse LSPR peak does not change because the diameter of the nanowire-like aggregates remains constant whether they are assembled or not. For side-by-side assembly, as MC-LR increases, the longitudinal LSPR value shifts to longer wavelengths, while the transverse peak shifts to shorter wavelengths, indicating the apparent "thickening" of the nanorods. Both binding methods can effectively detect MC-LR in water samples, but there are differences in sensitivity. The detection range and limit of detection for the side-by-side mode are 1~100 and 0.6 ng·mL-1, respectively; for the end-to-end mode, the detection range and limit of detection are 0.05~1 and 0.03 ng·mL-1, respectively. The sensitivity of the end-to-end aggregates is one order of magnitude higher. Subsequently, the team reported a colorimetric sensor based on antibody-antigen binding-induced "side-by-side" aggregation of AuNRs for detecting antibiotics in food samples [114]. By coupling gentamicin-protein conjugates and functionalizing the sides of AuNRs with gentamicin antibodies, "side-by-side" aggregation of AuNRs occurred. When gentamicin was added to the system, it preferentially bound to gentamicin antibodies, disrupting the "side-by-side" aggregation of AuNRs, thereby changing the LSPR spectrum and solution color of the AuNRs in the system. This method has a detection range for gentamicin of 0.1~20 ng·mL-1 and a detection limit of 0.05 ng·mL-1.
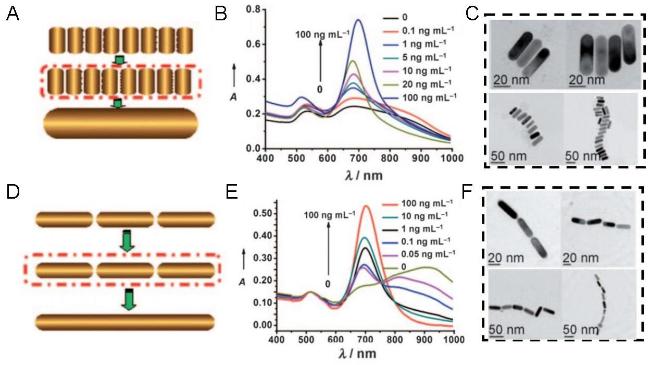
图10 Schematic Diagrams and Electron Micrographs of AuNRs Side-by-Side (A, C) and End-to-End (D, F) Aggregation, and Spectral Changes of AuNRs Side-by-Side (B) and End-to-End Aggregation (E) with Increasing (MC-LR) Concentration113

Fig. 10 The schematic diagram and electron microscopy of AuNRs shoulder-to-shoulder (A, C) and end-to-end (D, F) aggregation, and the spectral changes of AuNRs side by side (B) and end-to-end aggregation (E) with the increase of (MC-LR) concentration113. Copyright 2010, John Wiley and Sons

Wang Guoqing et al115 directed the side-by-side and end-to-end aggregation of AuNRs through terminal base mismatch in double-stranded DNA-modified AuNRs. They first prepared AuNRs with a diameter of 13 nm and a length of 48 nm by the seed growth method, and then modified two different DNA strands on their surface in a two-step process. Initially, AuNRs were linked at both ends with DNA1, which was modified with a thiol group at the 5′ end through the formation of Au-S bonds. Subsequently, the sides of the AuNRs were modified with an excess of DNA2, which was thiol-modified at the 3′ end. DNA1 preferentially attaches to the end regions because the packing density of CTAB in the end regions is lower than that in the side regions due to the high curvature of the end surface. Then, an excess of DNA2 replaced CTAB in the side regions. When hybridization substrate DNA was added to the AuNRs modified with two different DNA strands, if the side DNA2 was fully complementary and there was a base mismatch at the end of the end-face DNA1, the AuNRs aggregated side-by-side due to the repulsion at the ends. If the end-face DNA1 was fully complementary and there was a base mismatch at the end of the side DNA2, the AuNRs aggregated end-to-end due to the repulsion on the sides. Based on this, by controlling the terminal bases to achieve the transition between match and mismatch in the presence of Hg2+, the side-by-side aggregation of AuNRs could be transformed into end-to-end aggregation. Subsequently, the team enabled the matching of DNA double strands with terminal base mismatches based on the formation of T-Hg-T complexes. By adding cysteamine to capture Hg2+, the matched double strands became terminally mismatched again, thus causing changes in the aggregation and disaggregation states of AuNRs for detecting Hg2+ and cysteamine116.
The end-to-end aggregation mode has higher sensitivity and has been extensively studied. For instance, in 2005, Thomas117 utilized cysteamine and glutathione to induce head-to-head self-assembly of AuNRs for the construction of a colorimetric sensing detection of cysteamine and glutathione. Since CTAB preferentially binds to the sides of AuNRs, it inhibits the binding of -SH in cysteine to the sides of AuNRs, allowing it to bind to the end faces of AuNRs. After cysteamine binds to the end faces of AuNRs, due to the electrostatic interaction between the amino and carboxyl groups in the cysteamine molecules, the AuNRs attract each other and form one-dimensional superstructures through head-to-head self-assembly, causing a slight decrease in the longitudinal LSPR absorption and a redshift of the band. Subsequently, AuNRs modified with cysteamine on the end faces were used for the detection of Cu2+[118 in environmental water samples and organophosphorus pesticides119. ChE catalyzes the production of thiocholine from its substrate acetylthiocholine, which reacts with the tips of AuNRs through S-Au bonding, occupying the binding sites of cysteamine. Moreover, their strong positive charge from the quaternary ammonium groups at the end increases the electrostatic repulsion of AuNRs, preventing subsequent cysteamine-induced end-to-end self-assembly of AuNRs. When ChE is incubated with organophosphorus pesticides (OPs), the enzyme activity is inhibited, and cysteamine-induced end-to-end self-assembly of AuNRs can be observed again. Based on this principle, the linear detection range for OPs is 0.12~40 pM, with a detection limit of 0.039 pM.
To enhance the specific binding to the target analytes, various modifiers are directionally modified on the AuNRs end facets, enabling the target-induced end-to-end ordered aggregation. For instance, using thiol-terminated terpyridine functionalized modification on AuNRs end facets, Fe2+ induces end-to-end aggregation of AuNRs for colorimetric detection of Fe2+[120; modifying the ends of AuNRs with T-rich DNA, through T-Hg-T specific binding, causes AuNRs to undergo end-to-end aggregation for colorimetric detection of Hg2+[121; functionalizing AuNRs end facets with pyrazole-based amino ligands, Hg2+ induces end-to-end aggregation of AuNRs for colorimetric detection of Hg2+[122.
Xia et al.[123] proposed a valence-regulated Hg2+ detection method based on end-to-end aggregated colorimetric signal output. They found that the binding energies of Au0-Hg0 and Au0-Hg+ are 10.46 and 52.71 kcal/mol, respectively. Hg2+ cannot bind with Au0, and the binding energies of Hg0, Hg+, and Hg2+ with NH2 are 1.677, 49.85, and 162.3 kcal/mol, respectively. The results indicate that, unlike Hg2+ and Hg0, Hg+ can form amalgam with gold on one hand and has high affinity coordination interaction with NH2 on the other. Based on this, they first reduced Hg2+ to Hg+ ions through appropriate ascorbic acid in a controlled manner. The reduced Hg+ reacted with the tips of AuNRs and formed gold amalgam. Then, based on the high affinity of NH2-Hg+ interaction, Hg+-modified AuNRs were bridged by lysine to form one-dimensional structures through end-to-end self-assembly. Accordingly, the longitudinal surface plasmon resonance of AuNRs gradually decreased while a new broadband appeared in the 900~1100 nm region. If Hg2+ was overly reduced or not reduced, end-to-end aggregates could not be formed. End-to-end self-assembly signals were observed only at pH>6.5 because NH2 groups would be protonated to form NH3+ at lower pH values, hindering their binding with Hg+ ions. Therefore, neutral conditions (pH 7.0) were selected for detection. Under optimized conditions, the linear range for Hg2+ detection was 22.8 pM~11.4 nM with a detection limit of 8.7 pM.
By means of centrifugation and other methods, a large amount of CTAB on the sides of AuNRs is removed, allowing modifiers to be directionally modified on the sides of AuNPs, thereby constructing a side-by-side aggregation pattern. The Li team124 reported a colorimetric method for detecting adenosine based on the shoulder-to-shoulder aggregation of gold nanorods induced by the formation of a tetramolecular quadruplex (G-quartet) through the interaction between adenosine and its aptamer. The surface of gold nanorods is rich in CTAB, which is not conducive to the adsorption of aptamers on the surface of gold nanorods. However, if CTAB-AuNRs and aptamers are subjected to a high-temperature water bath at 100 ℃, the CTAB bilayer on the surface of AuNRs can be dissociated at high temperatures without significantly affecting the AuNRs. Meanwhile, due to the dissociation of CATB, the single-stranded aptamer spontaneously adsorbs on the surface of AuNRs. Due to the stabilizing effect of the aptamer on the gold nanorods, the gold rods remain stably dispersed. When adenosine is added, it forms a tetramolecular quadruplex with the aptamer, causing the shoulder-to-shoulder aggregation of gold nanorods due to the electrostatic interaction between the positive charge of CTAB on the surface of AuNRs and the negative charge of G-quartet. Based on this method, the linear range for detecting adenosine is 4.0~80.0 nM, with a detection limit of 2.0 nM (3 s/k), which can be applied to the detection of adenosine in biological samples. The Wang Shuo research group125 utilized a "shoulder-to-shoulder" aggregation strategy of AuNRs for the sensitive and selective detection of As(III) ions in environmental water samples. The surface of AuNRs has a high concentration of positively charged CTAB to maintain the stability of AuNRs. Therefore, by centrifuging to remove a large amount of CTAB from the surface of AuNRs, a large area of low-concentration CTAB surface is left on the long side of AuNRs. Then one end of dithiothreitol (DTT) bonds covalently with AuNRs via Au-S bonds, thereby modifying the side. With the addition of As(III) ions, As(III) ions can bind with three DTT molecules through As—S bonds, causing AuNRs to aggregate, leading to a shift in the longitudinal LSPR absorption band of DTT-AuNRs. The DTT-AuNRs probe shows high selectivity and sensitivity for the detection of As(III) ions. Similarly, Cai et al.126 utilized cysteine-functionalized gold nanorods based on shoulder-to-shoulder aggregation to detect Pb2+ in urban tap water samples.

3 Colorimetric Sensing Constructed by Regulating the Morphology and Particle Size of Metal Nanoparticles

There are two issues with colorimetric sensing constructed based on the change in the aggregation-dispersion state of metal nanoparticles. One is the self-aggregation problem, as changes in high-salt conditions, pH, charge, solvent, temperature, etc., can all cause nanoparticles to self-aggregate. Therefore, when used for detecting targets in complex samples, it may lead to high background or even false-positive results. The second issue is that to achieve specific detection, it is generally necessary to modify and label the nanoparticles, which involves cumbersome steps. Colorimetric sensing based on changes in morphology or particle size causing variations in LSPR properties does not require surface modification or labeling of nanoparticles, nor does it trigger self-aggregation behavior, avoiding false-positive signals caused by micro-environmental changes. Moreover, sensors based on non-aggregation strategies can be made into test strips, making them convenient to use. This method can generally be divided into two cases: one is constructing colorimetric sensing based on changes in morphology and particle size caused by etching of nanoparticles; the other is constructing colorimetric sensing by inducing the growth of nanoparticles to change their morphology and particle size. Using the etching or growth of spherical AuNPs and AgNPs, non-aggregation colorimetric sensing can be constructed127-133. However, since the color change of the solution in this process is not rich enough, more applications use particles with morphologies such as nanorods and nanotriangles, such as AuNRs, Au@AgNRs, and AgNPRs, to construct this type of colorimetric sensing. Due to the involvement of changes in the shape, aspect ratio, and composition of nanoparticles, the color change is richer, which is more conducive to semi-quantitative detection by the naked eye and on-site detection.

3.1 Colorimetric Sensing Based on the Etching of AuNRs

The alteration of the aspect ratio of AuNRs through etching can cause changes in LSPR properties, enabling colorimetric detection. The analytes measurable by this method can generally be divided into two categories: (1) Analytes with an oxidation potential higher than Au(I)/Au under certain conditions, which can oxidize and etch AuNRs, such as H2O2, hydroxyl radicals (·OH), superoxide radicals (O2·-), Cu2+, Cr6+, NO2-, I3-, etc.; (2) Substances that can generate metal-Au alloys (such as Pb2+, Hg2+) inducing gold etching.

3.1.1 Etching Based on Oxidation Reaction

Generally, Au is difficult to be oxidized and etched due to its high redox potential. Substances with relatively high redox potential can be detected by directly inducing the etching of AuNRs. For example, Shan et al.134 utilized the oxidative properties of H2O2 on AuNRs to achieve the detection of H2O2. Under acidic conditions, the redox potential of H2O2 (1.8 V) is higher than that of AuNRs (1.69 V), thus H2O2 oxidizes AuNRs causing etching and thereby shortening the nanorods, leading to the LSPR peak blue-shifting from 760 nm to 610 nm, and correspondingly the solution color changes from pink to yellow. This method detects H2O2 with a detection limit of 0.045 µM. Various enzymatic reactions can produce H2O2, therefore the etching of AuNRs based on H2O2 can detect enzyme activity or substrate concentration, such as detecting glucose135; or introducing glucose based on enzyme-linked immunoreactions to detect aflatoxin136, etc., or detecting enzyme inhibitors such as organophosphorus pesticides137, nicotinamide adenine dinucleotide (NADH)138; or substances catalyzing the etching of AuNRs by H2O2, such as Fe3+[139. The mechanism of Fe3+ catalyzing H2O2 to etch gold rods is shown as follows.
a. AuNRs + H2O2 + 2H+ → AuNRs’ + 2H2O
b. Fe3+ + H2O2 → Fe2+ + OOH· + H+
Fe2+ + H2O2 → Fe3+ + OH· + OH-
c. AuNRs + OOH· + H+ → AuNRs’ + 2H2O
Hydroxyl radicals (·OH), superoxide radicals (O2·-), and other intermediates all possess strong oxidative capabilities that can etch AuNRs. Based on this, any substance that can trigger the generation of strong oxidants can indirectly detect the etching of AuNRs. For example, Zhang et al.[140] proposed an intermediate-mediated AuNRs etching method for the colorimetric detection of Co2+ ions in drinking water. In the presence of bicarbonate and H2O2, Co2+ initiates a Fenton-like reaction, leading to the production of superoxide radicals (O2·-). As a result, AuNRs are gradually etched by O2·- in the presence of SCN-, accompanied by a noticeable change in solution color from green to red; the detection limit of this sensor for Co2+ reaches 40 nM. Superoxide dismutase (SOD), which decomposes O2·- into H2O2 and O2, can impede the etching process of AuNRs, and based on this, SOD activity in serum can be detected[141].
Similarly, this scheme can detect the process of suppressing oxidant production. Based on the Fenton reaction between Fe2+ and H2O2, the generated hydroxyl radicals, which are strongly oxidative, can etch gold nanorods to detect Ag+ in water samples. In the presence of simulated catalase PtNP, H2O2 is decomposed into H2O and O2, and cannot participate in the Fenton reaction to produce hydroxyl radicals, thus inhibiting the etching of AuNRs. When Ag+ is present, it specifically adsorbs on the surface of PtNP, inhibiting the catalase activity of PtNP, thereby limiting the decomposition of H2O2 and allowing the Fenton reaction to proceed smoothly, leading to the etching of AuNRs. Since the etching of AuNRs is directly related to the concentration of Ag+ in the system, Ag+ can be sensitively detected. As the concentration of Ag+ increases, the solution color exhibits significant multi-color changes from brown, green, blue, purple, to pink, enabling visual detection142.
In addition to the aforementioned intermediate products with strong oxidizing properties, the intermediate product TMB2+ of 3,3',5,5'-tetramethylbenzidine (TMB) also possesses strong oxidizing power and can be used to etch AuNRs. TMB is a chromogenic substrate widely used in colorimetric analysis, and its color-changing mechanism mainly involves the catalytic oxidation of TMB into a blue cation radical TMB+. Upon further reduction of the pH value, the blue cation radical can transform into the yellow oxidation product TMB2+, as shown in Figure 11143. Based on the significant color change produced during the oxidation process, various colorimetric sensors can be constructed144-145. Due to the strong oxidizing nature of the TMB oxidation intermediate TMB2+, novel multicolor colorimetric assays based on TMB2+ etching gold nanorods (AuNRs) have received increasing attention in recent years, playing an important role in fields such as biomedicine and chemical analysis146-148.
图11 Chemical Reaction Equation of TMB Oxidation Reaction

Fig. 11 The chemical reaction formula of TMB oxidation reaction

As Zhou et al149 proposed a Cu2+ colorimetric detection method based on peroxidase-mediated AuNRs etching. Creatinine and Cu2+ can form a Cu2+-creatinine complex with peroxidase-like activity, which can rapidly convert TMB to TMB+ in the presence of H2O2, and TMB+ can be oxidized to TMB2+ with high oxidation capacity under acidic conditions, which can etch AuNRs. With a certain amount of creatinine present, an increase in Cu2+ concentration can produce more TMB2+, thus enhancing the etching of AuNRs, accompanied by a significant blue shift of the longitudinal LSPR peak of AuNRs and the color change of the solution from red, brown, gray, green, blue to purple. Based on this principle, a simple colorimetric method was established to determine trace Cu2+ in lake water, soil, and normal human serum. Similarly, based on TMB2+ etching AuNRs, Luo et al150 developed a multicolor biosensor for ALP activity detection based on the peroxidase activity of copper nanoclusters inducing AuNRs etching. The Chen team151 constructed a colorimetric sensor array for detecting different antioxidants based on the etching of gold nanorods and gold nanotriangles by TMB2+. As shown in Figure 12, the Chen Guonan team152 utilized the inhibition of HRP activity by H2S, thereby reducing the etching of gold nanorods by TMB2+ generated from the HRP-catalyzed oxidation of TMB, for monitoring H2S in rat brain extracellular cells.
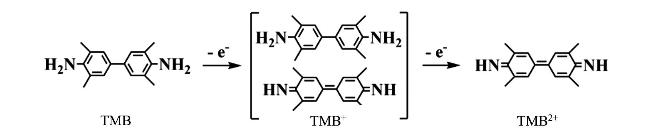
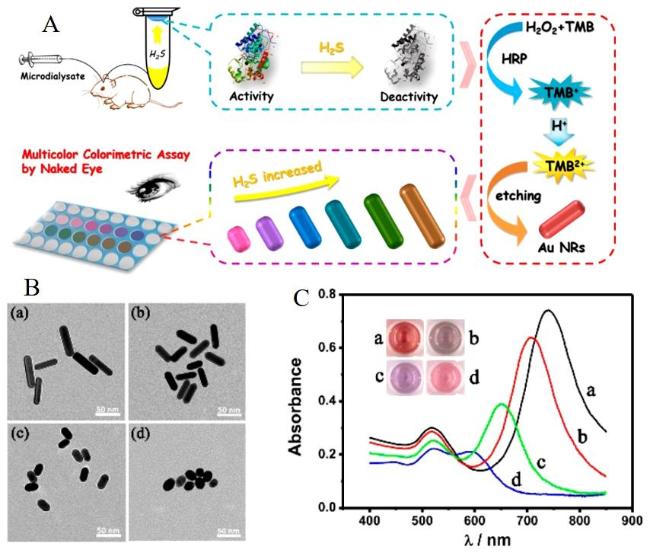
图12 (A) Detection of H2S Based on the Inhibition of HRP Activity by H2S, Which Suppresses the Oxidation of TMB to Generate TMB2+, and Its Etching Effect on Gold Nanorods; (B) TEM Images and UV-Vis Absorption Spectra of AuNRs with Different Concentrations of H2S ((a) 0 µM, (b) 50.0 µM, (c) 5.0 µM, and (d) 0.5 µM); (C)[152]

Fig. 12 (A)Detection of H2S based on the inhibition of HRP activity by H2S to inhibit the etching of gold nanorods by TMB2+ generated by oxidation of TMB;(B)AuNRs with different concentrations of H2S((a) 0 µM,(b) 50.0 µM,(c) 5.0 µM and (d) 0.5 µM)electron microscopy and UV absorption spectra(C)152. Copyright 2018, American Chemical Society

The redox potential of Au(I)/Au(0) is 1.69 eV, and under the influence of certain ligands, its redox potential decreases. For instance, with Br- as the ligand, AuBr2- + e → Au + 2Br-, E = 0.959 eV; with Cl- as the ligand, AuCl2- + e → Au + 2Cl-, E = 1.15 eV. For CTAB-capped AuNRs under acidic conditions, due to the Br- ions from CTAB and Cl- ions from HCl acting as ligands for gold, the redox potential of Au(I)/Au(0) (AuBr2--CTA+/Au) is reduced to 0.2 V. The redox potential of Cu2+/CuBr2+ is 0.52 V, the redox potential of Cr(VI)/Cr(III) is 1.33 eV, the redox potential of HNO2/NO is 1.0 eV (pH=0), the redox potential of Mn(IV)/Mn(II) is 1.224 V, and the redox potential of Fe3+/Fe2+ is 0.771 eV. The decrease in the redox potential of AuNRs in the presence of CTAB can be etched and dissolved by various mild oxidants such as Cu2+[153, NO2-[154], Cr6+[155, I3-[156-160], MnO2161, showing significant changes in solution color. Various highly sensitive and specific colorimetric methods have been developed to analyze these oxidants, substances that generate oxidants, or inhibit the generation of oxidants.
As Chen Lingxin et al[153] achieved the detection of Cu2+ in environmental samples by directly etching CTAB-capped AuNRs through Cu2+. Cu2+ oxidizes Au to AuBr2--CTA+, and itself is reduced to CuBr2-CTA+. Since this reaction occurs in an acidic medium, EO2/H2O is about 1.20 V, CuBr2-CTA+ can be oxidized by dissolved oxygen to regenerate Cu2+. This cyclic reaction leads to continuous etching of AuNRs. At lower Cu2+ concentrations, a color change of the solution from blue to red can be observed, while the LSPR extinction peak wavelength shifts from 670 nm to 530 nm. The detection limit of this method is 0.5 nM. In the presence of Na2S2O3 and NH3, there is a colorimetric detection of Cu2+ based on the etching ratio of AuNRs[162]. In this process, Cu2+ is added to ammonia to generate a complex of Cu(NH3)42+, which catalyzes the oxidative etching of AuNRs under the action of thiosulfate.
Cu2+ + 4NH3 = Cu(NH34 2+
Au + Cu(NH34 2+ + 4S2O3 2- =Au(S2O3 2-2 3- +
Cu(S2O3 2-2 3- + 4NH3
They similarly utilized the visible color change of AuNRs from blue-green to red and finally to colorless, induced by NO2- etching, to achieve the detection of NO2- in local drinking water samples [154]. The solution of AuNRs with a length/diameter ratio of approximately 1.3/1 appears blue-green, exhibiting a strong longitudinal SPR absorption near 630 nm. The addition of 10 mM NO2- to the colloidal solution leads to the gradual bleaching of the absorption band at 630 nm and a blue shift, causing the solution color to change from blue-green to red. Further addition of NO2- (40 mM) results in the complete dissolution of AuNRs, rendering the solution nearly colorless. The limit of detection for NO2- by this method is 56 μg·L-1. Similarly, based on NH4Br and HCl promoting NO2- etching of gold nanorods, NO2- can be detected [163].
Based on I2, AuNRs can be etched, and various colorimetric detection methods have been developed with I2 as the medium. For example, Chen Lingxin et al.[156] demonstrated that molybdate can catalyze the reaction between H2O2 and I- in weakly acidic solutions, producing I2 that preferentially etches gold nanorods longitudinally for MoO42- detection; based on Mn(II) being oxidized to Mn(III) and (IV) by dissolved oxygen, after acidification, Mn(III) and (IV) can oxidize I- to I2 for detecting dissolved oxygen, and iodate (IO3-) reacts with iodide (I-) to generate I2 for iodate detection[157]. Based on the redox potential of Fe3+/Fe2+ (1.13 V) being higher than that of I2/I- (0.534 V), thus I- can be oxidized by Fe3+ to I3-, where I3- oxidative etching of gold rods forms AuI2-, accelerating Fe3+ etching of nanorods for colorimetric I- detection[158]. Based on α-glucosidase-catalyzed hydrolysis of O-α-D-glucopyranosyl-L-ascorbic acid (2-O-α-D-glucopyranosyl-L-ascorbic acid, AA-2G) producing ascorbic acid AA, which can reduce KIO3 to generate I2, and I2 oxidative etching of AuNRs for detecting α-glucosidase activity[159], the reaction process is as follows:
a. α-glucosidase + AA-2G → AA
b. KIO3 + AA → I2
c. Au + I2 + 2CTA+ = AuI2 -·(CTA+2
Similarly, Huang et al160 detected the tumor marker metallothionein (MT) based on the etching of AuNRs by I2 regulated through catalytic performance. Using citrate-modified AuNPs as a catalyst to catalyze the reduction of p-nitrophenol (p-NP) to p-aminophenol (p-AP) by NaBH4, p-AP reacts with KIO3 to produce I2, and I2 etches AuNRs to generate a colorful color change. In the presence of MT, MT inhibits the catalytic action of AuNPs and can also scavenge active hydrogen radicals produced by NaBH4, further inhibiting the etching of AuNRs. This scheme allows for the detection of MT at concentrations as low as 28 pM.

3.1.2 Alloy-Induced Etching

Another approach to etching-based LSPR sensing is to accelerate the etching by forming an alloy. Rex et al164 reported that Hg0 specifically amalgamates with AuNRs, causing the etching of AuNRs to detect the content of Hg2+. A certain amount of reducing agent sodium borohydride is added to the system. As the concentration of Hg2+ in the system increases, Hg2+ is continuously reduced to Hg0, which then amalgamates with AuNRs. Since the active sites of AuNRs are at the ends, Hg0 preferentially reacts at the ends of the gold nanorods to form a gold amalgam, leading to a decrease in the aspect ratio of the gold nanorods and gradually changing the morphology of AuNRs from rod-shaped to spherical, resulting in a blue shift of the longitudinal plasmon resonance absorption peak. Huang et al165 reported a method for detecting Pb2+ based on the etching of AuNRs by Pb2+ in the presence of thiosulfate. AuNPs react with S2O32- ions in the solution to form an Au(S2O3)23- complex, leading to a slight decrease in its LSPR absorption spectrum. In the presence of Pb2+, Pb2+ can etch AuNRs to form a Pb-Au alloy, thereby altering the longitudinal LSPR absorption peak of the gold nanorods. This method has been successfully applied to detect Pb2+ in lake water, ponds, urine, seawater, and soil. Similarly, based on the presence of thiosulfate (S2O32-) and 2-mercaptoethanol, the scheme where Pb2+ ions form a Pb-Au alloy with gold to catalyze and accelerate the etching of gold nanorods by S2O32- can be used to detect Pb2+[166-167.

3.2 Colorimetric Sensing Based on Etching of Gold Nano-Bipyramids

Compared with AuNRs, gold nanobipyramids (AuNBPs) have more significant advantages as colorimetric probes, such as larger local electric field enhancement, larger extinction cross-section, and narrower longitudinal absorption peak width. They also have two sharp ends, which make morphological changes easier. Based on the above advantages, using AuNBPs for colorimetric sensing can improve sensitivity while still maintaining various color responses[168]. As shown in Figure 13, Zhao's team[169] detected Fe2+ based on the etching of AuNBPs by O2•-. AuNBPs were prepared by seed growth method, and in the presence of hydrochloric acid, the Fenton reaction between Fe2+ and H2O2 generated highly oxidative superoxide radicals (O2•-). In the presence of thiocyanate ions (SCN-), O2•- rapidly oxidized AuNBPs from both tips, producing Au+ ions, leading to a morphological transformation of the particles from bipyramidal to rice-shaped to spherical, and causing a color change of the solution from tan to green to blue to pink, with the LSPR spectrum showing a rapid blue shift from 760 nm. Due to the sharper tips of AuNBPs, they have higher sensitivity compared to AuNRs. Since the redox potential of Au(SCN)2- is lower than that of Au(0), the formation of Au(SCN)2- promotes the etching process. The etching process can be described as follows:
O2 - + e- + 2H2O → H2O2 + 2OH-
Au + 2SCN- → Au(SCN-2 - + e-
2OH- + H+ → H2O
Au + 2SCN- + O2 - + H2O → Au(SCN-2 - + H2O2
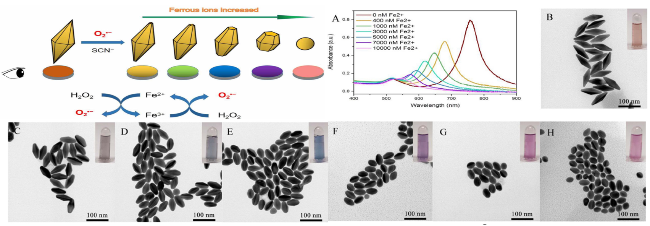
图13 Mechanism Diagram of O2·-Etching AuNBPs for Fe2+Detection and UV-Visible Spectra (A) Obtained After 10 min Reaction at 65 ℃ in an Aqueous Solution Containing 1.5 mM KSCN, 0.6 mM H2O2, and 6 mM HCl with Different Fe2+Concentrations, Along with Corresponding TEM Images and Photographs: Fe2+Concentrations are 0 µM (B), 0.4 µM (C), 1.0 µM (D), 3.0 µM (E), 5.0 µM (F), 7.0 µM (G), and 10.0 µM (H)169

Fig. 13 The mechanism diagram of Fe2+ detection based on the etching of AuNBPs by O2·- and AuNBPs were dissolved in an aqueous solution containing 1.5 mM KSCN, 0.6 mM H2O2 and 6 mM HCl, the UV-Vis spectra(A)and the corresponding TEM images and photographs obtained at 65 ℃ for 10 min under different Fe2+ concentrations were 0 µM(B)、0.4 µM(C)、1.0 µM(D)、3.0 µM(E)、5.0 µM(F)、7.0 µM(G)、10.0 µM(H), respectively169. Copyright 2020, IOP Publishing, Ltd

The aspect ratio of nano-bipyramids has a significant impact on the detection sensitivity. AuNBPs with a longitudinal peak at 705 nm and an aspect ratio of 2.75±0.2 were compared to AuNBPs with a longitudinal peak at 805 nm and an aspect ratio of 3.28±0.2. As the concentration of Fe2+ continually increased, more significant changes occurred in AuNBPs with a longitudinal peak at 705 nm: from a two-point AuNBPs structure, to a truncated AuNBPs structure, to an ellipsoidal structure, and finally to a spherical structure; whereas AuNBPs with a longitudinal peak at 805 nm only experienced etching at the ends. Similarly, based on trypsin's ability to promote bovine serum albumin-coated gold nanoclusters' peroxidase catalysis of TMB to produce TMB2+, which can etch AuNBPs, the activity of trypsin was detected [170].

3.3 Construction of Colorimetric Sensing Based on Triangular Silver Etching

Compared with spherical nanoparticles, triangular silver (silver nanoprisms, AgNPRs) can achieve tunability across the entire visible light region by adjusting the length and thickness of the edges and the tip morphology of the nanosheets. As shown in Figure 14C, AgNPRs exhibit four characteristic absorption peaks in the UV-visible-near-infrared spectrum, corresponding to out-of-plane quadrupole (~340 nm), out-of-plane dipole (~410 nm), in-plane quadrupole (~470 nm), and in-plane dipole (~770 nm) absorption peaks, respectively. Among them, the in-plane dipole (~770 nm) absorption peak is the strongest due to surface plasmon resonance absorption caused by its unique face-centered cubic lattice structure and anisotropy. The aqueous solution of triangular silver typically appears blue-purple, and as etching induces morphological changes, the solution color shifts from blue to purple to brown to yellow, which is more pronounced than the gradual weakening of yellow to colorless caused by silver nanoparticle etching. Therefore, triangular silver nanoprisms (AgNPRs) are often used instead of silver nanoparticles for colorimetric detection[171]. The LSPR absorption peak has the following characteristics: within a certain particle size range, the position of the LSPR absorption peak of AgNPRs basically does not change; within this particle size range, the larger the particle size, the sharper the LSPR peak; when particles aggregate, the LSPR peak exhibits a redshift and the peak broadens; the position and shape of the LSPR peak are related to the surface state of the particles (such as ligand type) and the medium in which they are located.
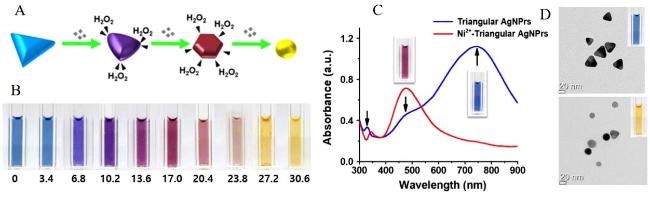
图14 Schematic Diagram of H2O2 Etching AgNPRs (A), Solution Color Change of Different Concentrations of Ni2+ Catalyzing H2O2 Etching AgNPRs (B), Absorption Spectra (C) and Electron Microscope Images (D) of AgNPRs Before and After Etching [176]

Fig. 14 Schematic diagram of AgNPRs etched by H2O2 (A), the color change of AgNPRs etched by H2O2 catalyzed by different concentrations of Ni2+ (B), the absorption spectra (C)transformation and electron microscopy images (D)of AgNPRs before and after etching176. Copyright 2019, Elsevier

The redox potential is higher than Ag+/Ag, such as H2O2, Hg, I2, all of which can oxidize and etch silver. For example, based on the etching of AgNPRs by H2O2, H2O2 can be directly detected[172-173].
Ag+ + e- → Ag(E 0 = 0.7996 V)
H2O2 + 2e- → 2OH-E 0 = 0.867 V)
2Ag+ H2O2 → 2Ag+ + 2OH-E 0 = 0.068 V)
Some target analytes, such as uric acid[174], glucose[175], and cholesterol, can use oxidase to produce H2O2 as an intermediate product to etch AgNPRs, providing an opportunity for the indirect quantification of the analytes.
Uric acid + O2 + H2O u r i c a s eallantoin + H2O2 + CO2
Ag + H2O2 → + 2Ag+ + 2OH-
D-glucase + O2 + H2O G O x D-gluconic acid + H2O2
2Ag + H2O2 → + 2Ag+ + 2OH-
Certain metal ions can catalyze the production of H2O2, and the etching of triangular silver by H2O2 can be used for indirect measurement. As shown in Figure 14, Ni2+ can catalyze the reaction between water and oxygen to generate H2O2, which etches triangular silver for colorimetric detection of Ni2+[176. It is also possible to construct a sandwich-structured immunoassay by modifying antibodies with glucose, introducing glucose upon recognition of the target, thereby generating H2O2 that can etch AgNPRs. The application of the sandwich structure can expand the detection scope to various cells and viruses, such as the detection of prostate-specific antigen177; through hybridization chain reaction, target DNA opens the hairpin-structured probe to form long DNA double strands, introducing glucose modified with avidin into the system to generate H2O2 for etching AgNPRs, which can be used for DNA detection178.
2H2O + O2 N i 2 + 2H2O2
For the colorimetric detection of uric acid, it can also be detected through its protection and inhibition of AgNPRs etching179. When 40 μM is added to the triangular silver solution, it causes the color of the AgNPRs solution to change from cyan to pale purple, and after 15 minutes, the solution color becomes nearly colorless. Its absorption spectrum shifts from 706 nm to 546 nm. Upon adding 1000 nM of uric acid to the solution, the etching of AgNPRs by H2O2 can be effectively inhibited, with only a 68 nm shift in the spectral peak, and the solution color changes from purplish-blue to blue. During the preparation of AgNPRs, citrate is used as a ligand agent, which has a stronger binding ability to the {111} facet, thus effectively preventing uric acid from binding to the {111} facet. Uric acid is more likely to bind to the side {110} facets of AgNPRs. Since the edge length of AgNPRs is approximately 50 nm and the thickness is about 5 nm, the side area accounts for 25% of the total surface area, hence a small amount of uric acid can significantly inhibit the etching of AgNPRs, and the detection limit of this scheme is 10 nM.
Halide ions and SCN- can etch the corners of AgNPRs and move silver atoms to redeposit on the {111} basal plane surface, thereby increasing the thickness of triangular silver. Xu et al[180] studied the halide etching mechanism, and the results showed that during the halide ion etching process, due to the significantly lower concentration of bromide and iodide ions compared to the concentration of silver atoms moving from the corners of triangular silver, halide ions are more likely to act as catalysts rather than reactants in promoting the migration of silver atoms. The etching of AgNPRs by SCN- depends on the KSCN concentration. There is a critical concentration for KSCN etching, approximately 3×10⁻⁴~5×10⁻⁴ M. When the amount of KSCN added to the colloid is within the critical concentration range, silver nanoprism directly and immediately converts into a silver nanodisk; when the amount of KSCN exceeds the critical concentration range, triangular silver is gradually etched[181].
Some substances can act as inhibitors to slow down the etching of AgNPRs, based on which colorimetric sensing detection of inhibitors can be constructed. For instance, S2O32- can etch silver to form Ag(S2O3)23-, causing the etching of the sharp corners of AgNPRs and transforming AgNPRs into silver nanodisks, accompanied by a color change of the solution from blue to brown-yellow. When Hg2+ is added to the system, it reacts with S2O32- to generate HgS deposition at the sharp corners of AgNPRs, hindering the etching of silver by S2O32-. The addition of Hg2+ causes a redshift in the LSPR spectrum of AgNPRs, and the wavelength shift is linearly related to the Hg2+ concentration in the range of 5.0 nM to 10.0 μM, with a detection limit of 0.2 nM[182].
4Ag + 8S2O3 2- + O2 + 4H+ → 4[Ag(S2O323- + 2H2O
Hg2+ + S2O3 2- + H2O → HgS + SO4 2- + 2H+
Zhang et al183 utilized the antagonistic effect between captopril protection and halide ion etching to propose a colorimetric method based on AgNPRs anti-etching for the detection of captopril. Trace halides play an important role as mediators in the shape-controlled evolution of silver nanoparticles. Etching causes the color of AgNPRs nano edges to change from blue to yellow, forming circular nanodisks. Since the corners/edges of AgNPRs have higher energy relative to their {111} surfaces, Cl- tends to primarily attack the corners/edges through oxidative etching. As a result, AgNPRs will transform into smaller disc-shaped Ag nanoparticles. The addition of captopril introduces mercaptopropionyl glycine, which, due to the presence of thiol groups, can bind to the silver chitosan surface via silver-sulfur bonds, preventing the oxidative etching of AgNPRs. In this case, the solution color does not change. Therefore, captopril can protect AgNPRs from chloride erosion, thus maintaining the original morphology of AgNPRs. This finding was used to design a captopril assay with a linear response in the concentration range of 10~600 nM and a detection limit of 2 nM. Similarly, using the etching of AgNPRs by I2 and the principle of anti-etching action of thiram (a dithiocarbamate fungicide widely used for soil and seed treatment) on AgNPRs to achieve the detection of thiram in soil184, based on S2O32- and mancozeb (an ethylene dithiocarbamate fungicide widely used in crops) causing shape changes in AgNPRs due to etching and anti-etching effects to detect mancozeb in juice samples185.
DNA has been demonstrated as a green and low-cost etchant that can effectively control the morphology and optical properties of plasma nanoparticles (blue shift of LSPR peaks). Liang et al186 studied the etching of AgNPRs mediated by DAN and thiolated biomolecules. During the morphological evolution of AgNPRs, since one Ag+ on the surface of AgNPRs can bind to more than one cytosine in C-rich DNA, forcing the bound Ag+ to be released from AgNPRs, thereby initiating DNA-directed etching. The results show that as the concentration of C-rich DNA increases, the LSPR peak of AgNPRs blue shifts from 702 nm to 578 nm, and the chromaticity of the solution changes from green to blue, even to purple, which can be detected by the naked eye. For the etching of AgNPRs mediated by thiolated biomolecules, they found that there are two competing responses during the etching process: concentration effect and size effect, with the size effect being dominant. Moreover, the functional groups on the biomolecules are also key factors. Therefore, when thiolated biomolecules are used as etchants, the degree of etching and fluorescence intensity increase with the increase in the concentration and size of thiolated biomolecules, resulting in a stronger blue shift of the LSPR peak, and the color of the solution changes from green to blue, purple, and even pink. Lu et al187 constructed a colorimetric sensing method for highly sensitive detection of S2- in natural water environments based on the etching of lignin-modified AgNPRs by S2-. Lignin covers the surface of AgNPRs through cation-π and electrostatic interactions, stabilizing the dispersion of AgNPRs. When S2- is present, metallic silver is released from AgNPRs via a particle-fluid mechanism and directly reacts with S2- to form Ag2S, creating vacancies at the sharp corners of triangular AgNPRs and selectively etching AgNPRs from the sharp corners, triggering noticeable changes in the solution's color and absorption spectrum.
It is essential to develop reliable chiral sensors that allow for rapid, inexpensive, and sensitive enantiomer determination. Li et al188 fully utilized the inherent chirality of triangular silver nanoplates (AgTNPs) and used unmodified AgTNPs as a colorimetric probe to convert the enantioselective recognition of tyrosine (Tyr) into a visual color change. In this sensing, due to the homochirality of L-Tyr and AgTNPs, the affinity between them is stronger than that between D-Tyr and AgTNPs. Therefore, L-Tyr can rapidly induce the aggregation of AgTNPs, changing the solution color from dark blue to light gray, while D-Tyr does not induce a color change in the AgTNPs solution. Based on this principle, a chiral analysis method for tyrosine was established.

3.4 Construction of Colorimetric Sensing Based on Etching of Gold-Silver Bimetallic Nanomaterials

Although the noble metal nanoparticles used to construct LSPR colorimetric sensors have their own advantages, they have some corresponding limitations. Specifically, the stability of gold and silver nanoparticles is an important issue. Environmental factors (such as temperature, pH, ionic strength) and time may cause aggregation or deformation of nanoparticles, thereby affecting the stability and reliability of LSPR signals189. Although gold nanorods are attractive, the difficulty in synthesis limits their use on a larger scale190. For gold nanobipyramids, the reproducibility of their synthesis is poor, and the separation effect of AuBPs from other structures is not good, which may affect their optical performance and performance in LSPR colorimetry191. Therefore, the development of LSPR colorimetry is affected differently by different nanoparticles, and continuous innovation of nanomaterials is still needed. If two kinds of nanomaterials are assembled, then the noble metal-based bimetallic nanoparticles (NMBNP) composed of two different metals can not only present the combination of different properties of each component, but also show new properties due to the synergistic interaction between the two metal nanostructures, which are widely used in colorimetric sensing. On the one hand, since the LSPR of different metals are located in different wavelength regions, the composition of bimetallic nanocrystals (i.e., the ratio of two different metals) can be controlled to achieve LSPR regulation. On the other hand, the LSPR of bimetallic nanostructures also depends on their morphology. That is, the number, position, and profile of LSPR peaks are highly sensitive to the spatial arrangement and atomic order of two different types of metal atoms. Compared with single-metal nanoparticles, composite particles have excellent sensitivity, superior catalytic, photophysical, and optoelectronic properties, and have broader application prospects in analytical detection, etc.192-193. Common ones are core-shell structured spherical Au@Ag nanoparticles (Au@AgNPs), rod-shaped structures formed by coating gold nanobipyramids with silver (AuNBs@AgNRs), rod-shaped structures formed by coating gold rods with silver (Au@AgNRs), and gold-silver nano-heterojunction structures.

3.4.1 Au@AgNPs

Due to the combination of AuNPs and AgNPs, Au@AgNPs exhibit a new LSPR peak and display a richer color change during the etching process. For instance, a colorimetric sensing detection for H2O2 and glucose was constructed based on H2O2 etching Au@AgNPs194. First, Au@Ag nanoparticles were synthesized by in-situ growth of AgNPs on the surface of thiol-PEG capped AuNPs. The reason for choosing thiol-PEG capped AuNPs is that the attachment of thiol-PEG on the surface of AuNPs can greatly enhance the stability of AuNPs in aqueous media. More importantly, introducing thiol-PEG on the surface of AuNPs can solve the repulsion problem between AuNPs and AgNPs particles by forming Ag-S. Therefore, even at mild temperatures, p-aminophenol (p-AP) can effectively reduce silver ions to form an AgNPs shell on the surface of thiol-PEG functionalized AuNPs. The AuNPs are burgundy with a maximum absorption wavelength at 520 nm, while the Au@AgNPs are orange with a maximum absorption wavelength at 375 nm. As H2O2 etches the Au@AgNPs, the solution color changes from orange to light orange to light red, and finally returns to burgundy, with the intensity of the LSPR absorption spectrum gradually decreasing and showing the characteristic peak of AuNPs at 520 nm. This method was used to detect glucose and cholesterol, with linear ranges of 0.5~400 μM and 0.3~300 μM respectively, and detection limits of 0.24 and 0.15 μM.
Cyanide CN- can dissolve metals such as gold and silver in the presence of oxygen by forming [Au(CN)2- and [Ag(CN)2-. Based on this, the Zeng team195-196 constructed a colorimetric sensing system with high sensitivity for detecting CN- using Au@AgNPs as signal carriers. The Au@Ag core/shell nanoparticles were prepared using an AuNPs-assisted Tollens reaction. The thickness of the silver shell affects the sensitivity of detection, and Au@AgNPs with a silver shell thickness of 4.4 nm were prepared. Under acidic or neutral conditions, CN- tends to form HCN, so the detection was performed at pH=9. As shown in Figure 15, under optimal conditions, as the concentration of cyanide increases, the color change of the Au@AgNPs solution is much richer than that of pure AuNPs or AgNPs alone, showing observable changes from yellow to orange, pink, and finally colorless. Such varied color changes enable naked-eye visual detection of cyanide, with the lowest detectable cyanide concentration by the naked eye being 1.2 μM, which is lower than the maximum allowable concentration of cyanide in drinking water (1.9 μM) stipulated by the World Health Organization. The absorbance at 394 nm gradually decreases and shows a linear relationship with CN- concentration in the range of 0.4~100 μM, with a minimum detection limit of 0.4 μM. They immobilized Au@AgNPs onto agarose gel to create portable test strips for convenient and rapid on-site detection.
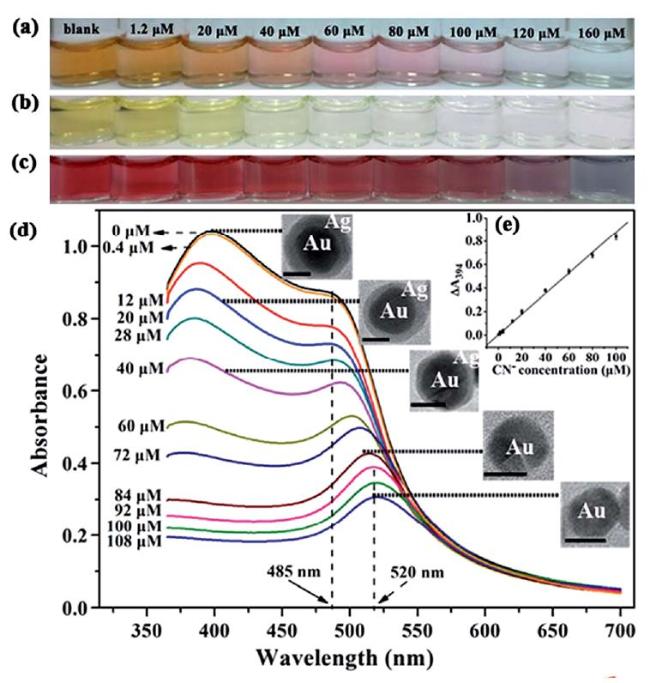
图15 Photos of Solutions of (a) Au@AgNPs, (b) AgNPs, and (c) AuNPs with Different Amounts of Cyanide Added; (d) UV-Vis Spectra of Au@AgNPs with Increasing Amounts of Cyanide, Inset Shows TEM Images of Au@AgNPs with Increasing Amounts of Cyanide; (e) Linear Plot of A394 vs. Cyanide Concentration195

Fig. 15 The solution photos of (a) Au@AgNPs, (b)AgNPs and(c) AuNPs after adding different amounts of cyanide;(d) The UV-visible spectra of Au@AgNPs after adding different amounts of cyanide, and the illustrations are the TEM images of Au@AgNPs after adding different amounts of cyanide;(e) a linear plot of A394 versus cyanide concentration195. Copyright 2014, Royal Society of Chemical

3.4.2 AuNBs@AgNPs

As shown in Figure 16A, AuNBs@AgNRs can be prepared using the seed growth method. First, AuBPs with a longitudinal LSPR peak at 686 nm were chosen as the core for growth, and a silver layer was deposited on their surface by reducing AgNO3 with ascorbic acid. Silver nanoshells of different thicknesses can be obtained by adjusting the amounts of AgNO3 and AA. As the volume of AgNO3 increased from 10 to 30 μL, the main absorption peak of AuNBs@AgNRs underwent a blue shift, with silver uniformly depositing around the sides of the Au-NBP, and the morphology changed from a bipyramid to a rice shape. However, when the volume of AgNO3 further increased, the thickness of the silver shell gradually increased, and the morphology transformed from rice-shaped to nanorod-shaped, while the longitudinal LSPR began to redshift, accompanied by a gradual shift of the peak position towards the NIR region. These shifts in the longitudinal LSPR peak triggered a series of vibrant and vivid color changes. The solution changed from light blue to dark blue, then from green to yellow, from yellow to orange, and finally to a less clear brick red. Obvious peaks can be seen near 380 and 500 nm, corresponding to the transverse LSPR absorption peaks of the silver nanolayer and AuNBs@AgNRs. The etching-based construction of true-color sensing based on AuNBs@AgNRs is the reverse process of growth, also accompanied by significant changes in solution color, providing high sensitivity for colorimetric detection.
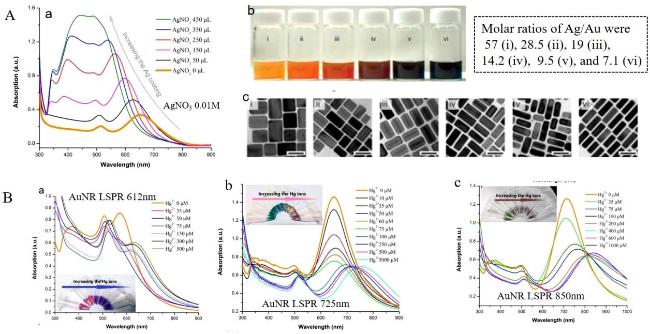
图16 (A) UV-Visible Absorption Spectra of AuNBs@AgNRs Samples Synthesized with 0, 10, 20, 30, 40, 50, 60, 70, 80, 90, and 100 µL of AgNO3 (0.01 M). Inset: Photographs of the Corresponding Colloids. TEM Images of AuNBs@AgNRs Prepared by Adding Different Concentrations of Ag+. (B) UV Absorption Spectra and Solution Photographs of AuNBs@AgNRs Etched by Cu2+, and TEM Images of the Etching Process197

Fig. 16 (A) Ultraviolet-visible absorption spectra of AuNBs@AgNRs samples synthesized with 0, 10, 20, 30, 40, 50, 60, 70, 80, 90 and 100 µL AgNO3 (0.01 M). Illustration: Photo of the corresponding colloid. TEM images of AuNBs@AgNRs prepared by adding different Ag+ concentrations. (B) UV absorption spectra and solution photos of AuNBs@AgNRs etched by Cu2+, as well as TEM images of the etching process197. Copyright 2023, Elsevier

Qi's team197 developed a colorimetric sensing detection method for Cu2+ in tap water based on the etching of AuNBs@AgNRs by Cu2+. In an alkaline solution environment, Cu2+ first forms Cu(OH)2. Subsequently, Br- in the CTAB that stabilizes the Au@AgNPs solution reacts with H+, the reactive oxygen species in the solution, and the outer layer of silver to form AgBr. As shown in Figure 16B, with the addition of Cu2+, a vivid color change from yellow to cyan occurs in the solution, accompanied by a series of changes in the longitudinal LSPR peak, which first shifts blue and then red. The linear range of this method is 0.5~100 μM, with a limit of detection (LOD) of 0.16 μM.
Cu2+ + 2OH- → Cu(OH)2
O2 + 4H+ + 4Br- + 4Ag → 4AgBr + H2O
The standard electrode potential of Hg2+/Hg is 0.852 V, which is higher than that of Ag+/Ag, so Hg2+ can oxidize and etch Ag.
Ag n + Hg2+ = Ag n -2Hg + 2Ag+
Based on this, the etching of Hg2+ on AuNBs@AgNRs was used to construct a colorimetric sensor198. The absorption spectrum of AuNBs@Ag NRs exhibits two distinct peaks at wavelengths around 400 and 730 nm, corresponding respectively to the longitudinal LSPR of the nanostructures and the plasma resonance of bulk Ag. The longitudinal LSPR peak at 730 nm blue shifts to 600 nm after adding 50 μM Hg2+, and the absorption peak at 400 nm decreases. As the concentration of Hg2+ further increases to 500 μM, the longitudinal LSPR peak red shifts to 681 nm. At low concentrations of Hg2+, etching occurs preferentially near the end faces; the etching of the silver nanoshell at the end face leads to a change in the nanoparticle shape from nanorods to rice-shaped nanoparticles, causing a blue shift of the longitudinal LSPR peak. As the concentration of Hg2+ increases, the silver layer deposited on the sides of AuNBs is etched, and the aspect ratio of AuNBs@Ag nanoparticles no longer changes, leading to a red shift of the longitudinal LSPR peak. In the range of 0.1~20 μM, the change in absorption peak ∆λ induced by the addition of Hg2+ is proportional to the concentration of Hg2+, with a minimum detection limit of 22 nM. The solution color changes from yellow-green to green, then to blue-gray.
Based on the dual etching effect of Cr6+ on silver and gold, Hou's team [199] prepared AuNB@AgNRs for colorimetric detection of Cr6+ in tap water and river water samples. The standard electrode potentials of Ag(I)/Ag(0), Au(I)/Au(0), and Cr(VI)/Cr(III) are 0.7966, 1.69, and 1.33 eV, respectively. When Br- is present, the ligand effect of Br- on gold and silver reduces the electrode potentials of Ag(I)/Ag(0) and Au(I)/Au(0), allowing them to be oxidized by Cr(VI). Therefore, under the action of HBr, as Cr6+ is added, Cr6+ is reduced to Cr3+, the outer silver shell is first oxidized to form AgBr, then the apexes of the inner gold nanobipyramids are oxidized to AuBr2-, and ultimately the core-shell structured nanorods are etched into gold spheres, causing a redshift in the LSPR absorption spectrum from 487~525 nm and a change in solution color from orange to pink to purple. The wavelength shift in the absorption spectrum is proportional to the Cr6+ concentration in the range of 2.5~40 μM, with a detection limit of 1.69 μM.
Based on the etching of silver by TMB2+, a colorimetric sensing detection of C-reactive protein was constructed using an enzyme-linked immunosandwich structure and AuNB@AgNRs200. Based on the specific recognition between antibody and antigen, horseradish peroxidase was introduced into the system to catalyze the oxidation of TMB to generate TMB+, which is then converted under acidic conditions to TMB2+ capable of etching silver oxide. As it etches the Ag outer shell layer, the composition and morphology of the nanorods both change, causing the LSPR absorption peak at 800 nm to blue-shift to 690 nm and the absorption peak intensity at 400 nm to decrease, resulting in a rich color change of the solution from orange-red, yellow, green, dark green, blue, to bluish-gray.

3.4.3 Au@AgNRs

AuNRs were prepared by the seed growth method, and AA was used to reduce AgNO3 on their surface to induce Ag deposition. As the thickness of the deposited silver layer increased, the longitudinal absorption peak of its LSPR rapidly blue-shifted. As shown in Figure 17A (a), for bare gold nanorods with a longitudinal LSPR peak at 655 nm, as the amount of AgNO3 (0.01 M) increased from 0 to 450 μL, the peak of Au@AgNRs rapidly enhanced and blue-shifted to 520 nm. Figures 17A (b, c) show TEM images and solution color images of Au@AgNRs prepared at different Ag/Au molar ratios. When Au@AgNRs were etched, as the thickness of the silver layer decreased, the solution absorption spectrum and color would undergo reverse changes. For example, the colorimetric sensing detection of Hg2+ was constructed based on the etching of Au@AgNRs by Hg2+[201-202. Zhao et al.202 found that when cysteamine-modified Au@AgNRs were etched by Hg2+, if the concentration of Hg2+ was below 60 μM, the aggregation of nanorods caused by the coordination chelation of Hg2+ with cysteamine on the surface of the nanorods led to a decrease in the peak intensity of the absorption spectrum, while the peak position remained basically unchanged; when the concentration of Hg2+ was above 60 μM, due to the strong Hg—S bond adhering to cysteamine molecules detaching from the surface of the nanorods, Hg2+ etched the exposed nanorods, and the reduction of the Ag shell caused the longitudinal absorption peak to red-shift from 625 nm to 725 nm. The peak shift was proportional within the concentration range of 60~200 μM, with a detection limit of 1.065 μM. During the detection process, Au@AgNRs with different silver deposition thicknesses had a significant impact on the detection sensitivity. By changing the volume of silver nitrate in the growth solution, three different aspect ratio AuNRs with longitudinal LSPR bands at 612, 725, and 850 nm were prepared, and using these as cores, the same amount of silver (100 μL, 0.01 M AgNO3) was used to grow Au-Ag core-shell nanorods. In Figure 17B (a), the internal gold nanorods have a longitudinal LSPR peak at 612 nm, and after silver coating and cysteine modification, the peak shifts to 570 nm. When the Hg2+ concentration increases to 50 μM, the longitudinal LSPR peak rapidly attenuates, but there is no obvious change in the colloid color. When the Hg2+ concentration increases from 50 to 75 μM, the longitudinal LSPR peak appears red-shifted to 623 nm, and the colloid color changes from pink to purple. As the Hg2+ concentration further increases from 75 μM to 500 μM, no strong red-shift is observed, and the colloid color change is also relatively weak. In Figure 17B (b), the internal gold nanorods have a longitudinal LSPR peak at 725 nm, and after silver coating and cysteine modification, the peak shifts to 650 nm. When the Hg2+ concentration increases to 75 μM, the longitudinal LSPR peak gradually decreases from 1.45 to 0.75, but there is no noticeable change in the colloid color. When the Hg2+ concentration increases from 75 μM to 500 μM, the longitudinal LSPR peak red-shifts gradually from 650 nm to 755 nm, and the colloid color changes from green to brown, then to red. In Figure 17B (c), the internal gold nanorods have a longitudinal LSPR peak at 850 nm, and after silver coating and cysteine modification, the peak shifts to 710 nm. When the Hg2+ concentration increases to 75 μM, the longitudinal LSPR peak rapidly attenuates with a slight red-shift, and the colloid color changes from light yellow to brown. When the Hg2+ concentration increases from 75 μM to 500 μM, the longitudinal LSPR peak red-shifts from 750 nm to 840 nm. This offset area exceeds the visible light range, and the absorption peak cannot cause a noticeable change in the colloid color. Therefore, Au@AgNRs prepared with the gold core having LSPR at 725 nm possess the highest sensitivity.
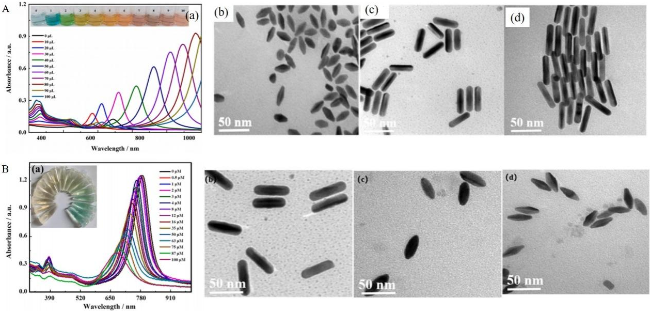
图17 (A) UV Absorption Spectra (a), Colloidal Solution Color Images (b), and TEM Images (c) of AuNRs with Different Thicknesses of Silver Layers Deposited on the Surface; (B) Response Absorption Spectra and Solution Color Changes of Au@AgNRs Prepared with AuNRs of Different LSPR Peaks as the Core to Hg2+ 202

Fig. 17 (A)UV absorption spectra(a), colloidal solution color (b)and TEM images(c)of silver layers with different thicknesses deposited on the surface of AuNRs. (B)The response absorption spectra and solution color transformation of Au@AgNRs prepared with AuNRs with different LSPR peaks to Hg2+[202. Copyright 2018, Elsevier

Based on the etching of silver by I2, a colorimetric sensor was constructed by selecting different silver nanomaterials. For instance, under the catalysis of Cu2+, the detection of I- in drinking water and dried kelp was carried out through the etching of Au@AgNPs by I2203]. In the presence of Cu2+, I- is oxidized to I2, which then etches silver to form AgI, resulting in the formation of Au@AgI. This process causes changes in the composition and size of nanoparticles, leading to a color change of the solution from yellow to purple. The absorption at 394 nm gradually decreases, and a new absorption peak appears at 422 nm, corresponding to the formation of AgI. The color change of composite nanoparticles is richer than that directly using AgNPs, making it more conducive for visual recognition and colorimetric detection. The detection limit of this method for I- is 0.5 μM. Similarly, replacing Au@AgNPs with AuNBs@AgNRs, this scheme can also be used to detect I- in kelp [204]. In the presence of Cu2+, I- is oxidized to I2, and I2 etches silver to generate AgI, causing morphological changes of AuNBs@AgNRs and variations in LSPR spectra. When the silver layer on the surface is relatively thick, the etching by I- induces a blue shift in the LSPR spectrum, and the wavelength shift range is proportional to I- within the range of 1.0~15 μM, with a detection limit of 0.3 μM.
2Cu2+ + 4I- = 2CuI + I2
2Ag + I2 = 2AgI
Chen Lingxin et al.205 developed a colorimetric detection method for Cu2+ in actual water samples based on the catalytic acceleration effect of Cu2+ on the etching of Au@Ag nanorods by S2O32-. In the absence of Cu2+, S2O32- is adsorbed on the surface of Au@AgNRs, forming an Ag(S2O3)23- complex in the presence of dissolved oxygen. This complex immediately creates a passivation layer on the surface of Au@AgNRs, hindering subsequent etching leaching reactions. When a trace amount of Cu2+ is added to the system, the formation of Cu(S2O3)35- can accelerate the etching of Au@Ag nanorods by S2O32-. Cu(S2O3)35- can then be oxidized by dissolved oxygen back to Cu2+, where Cu2+ acts as a catalyst to accelerate this reaction. The absorption spectrum changes throughout the process as follows: the LSPR peak of Au@AgNRs is at 548 nm. After adding S2O32-, the LSPR peak redshifts to 557 nm, accompanied by a decrease in absorbance. Adding Cu2+ further induces a redshift and a decrease in the absorption spectrum. As the concentration of Cu2+ increases, the color of the sensing solution significantly changes from bright red to blue-green within 5 minutes.
4Ag0 + O2 + 2H2O + 8S2O3 2- → 4Ag(S2O32 3- + 4OH-

3.4.4 Other Heterostructures

Zeng et al206 used unique Au@AgS nano-heterostructures for colorimetric detection of Hg2+ in wastewater; Au@Ag forms an Au@AgI dimer structure, whose surface is much more stable than Ag. The Au-AgI dimer particles are converted to the more stable Ag2S in the presence of hydrogen sulfide, thus enhancing specificity. As shown in Figure 18A, mercury ions induce the transformation of Ag2S (Ksp(Ag2S)=6.3×10-50) into the more stable HgS (Ksp(HgS)=4×10-53), therefore changing the elemental composition and morphology of nanoparticles, resulting in changes in solution color and LSPR spectra, based on which the colorimetric detection of mercury using Au@AgS heterojunction structures is achieved. As shown in Figure 18B, the LSPR band of AuNPs is centered at 520 nm and the solution appears burgundy red. After forming Au@Ag, the absorption peak of the silver shell appears at 392 nm, and due to the shielding effect of Ag, the absorption peak of Au shifts from 520 nm to 494 nm. Meanwhile, the colloid color turns orange. Then, upon addition of I2, the solution gradually changes from orange to purplish red. A bandgap of AgI appears at 421 nm, and the absorption band of Au returns to 521 nm, indicating a weaker shielding effect of the silver shell due to the formation of Au/AgI NPs. After adding Na2S to form Au/Ag2S dimer NPs, the solution turns grayish purple, the LSPR band at 421 nm disappears, and the band at 521 nm shifts to 562 nm. This redshift suggests the transformation from AgI to Ag2S; when a certain concentration of Hg2+ is mixed with the nanoprobe, the component transforms from Ag2S to HgS, and the color changes from grayish purple to dark green and finally to navy blue, with the spectral peak redshifting to 569 nm. The peak intensity at 550 nm (A550) shows a linear change with the variation of Hg2+ concentration, and the limit of detection (LOD) is 1.21 μmol/L.
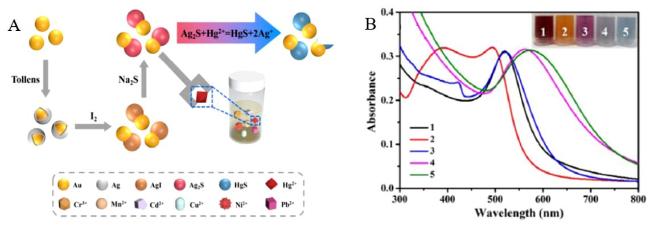
图18 (A) Schematic Illustration of Au/Ag2S Dimer Nanoparticles for Hg2+ Detection; (B) UV-Vis Spectra of (1) AuNPs; (2) Au@AgNPs; (3) Au/AgINPs; (4) Au/Ag2SNPs; (5) Au/Ag2SNPs + Hg2+, with the Inset Showing Photos of Corresponding Solutions[206]

Fig. 18 (A)Schematic diagram of the method for detecting Hg2+ by Au/Ag2S dimer nanoparticles; (B)UV-Vis spectra of (1) AuNPs;(2) Au@AgNPs;(3) Au/AgINPs;(4) Au/Ag2SNPs;(5) Au/Ag2SNPs + Hg2+, illustrated by the corresponding solution206. Copyright 2023, Elsevier

Xu et al.[207] developed a method based on CN- to rapidly dissolve AgI from Au-AgI heterodimer nanoparticles (one side is Au, the other side is AgI) for detecting CN- in real samples such as pond water, wastewater, bamboo shoots, and oranges. The Au-AgI heterodimers mainly exhibit LSPR absorption peaks at 607 nm and 416 nm, corresponding to longitudinal and transverse LSPR respectively, where the transverse LSPR originates from AgI. Upon addition of 85 μM CN-, the characteristic LSPR peak exhibits a blue shift, the characteristic absorption peak at 416 nm disappears, and only the absorption peak of AuNPs at 530 nm can be observed. The solution color changes from blue to purple and then pink. Although CN- can etch AuNPs and AgNPs under the action of dissolved oxygen, the dissolution rate of CN- on AgI is much faster than its etching effect on Au and Ag nanoparticles. The wavelength shift (Δλ) of the maximum absorption peak shows a linear relationship with cyanide concentration in the range of 0-75 μM, with a detection limit of 0.15 μM. This method offers richer color changes and higher sensitivity compared to AuNP-based etching[208] and AgNP-based etching[209].
AgI + 2KCN = KAg(CN)2 + KI
4Au + 8CN- + 2H2O + O2 = 4[Au(CN)2- + 4OH-
EΘ = 0.976 V KΘ = 4.4×1028
4Ag + 8CN- + 2H2O + O2 = 4[Ag(CN)2- + 4OH-
EΘ = 0.851 V KΘ = 9.4×1024
Based on the etching of silver by H2O2, the Hallaj team210 constructed a colorimetric sensing detection of H2O2 and glucose using Au@Ag nanocages as signal units. First, Ag nanocubes were prepared by the polyol method and used as templates to prepare Au/Ag nanocages. The LSPR peaks of Ag nanocubes at 350 and 415 nm are attributed to the excitation of dipole plasmons and higher multipole charge distributions, respectively. Au3+ ions were continuously added to the Ag nanocube solution to prepare Au/Ag nanocages via the galvanic replacement method. Since the redox potential of Au3+/Au (0.99 V) is higher than that of Ag+/Ag (0.80 V), the Ag atoms in the template are oxidized by Au3+ and produce Ag+ ions. The dissolution of Ag atoms creates a void, and the released electrons migrate to the outer surface of the nanocube, reducing Au3+ ions to Au atoms. Due to the good match between Ag and Au atoms in the crystal structure, these Au atoms are deposited on the outer surface of the nanocube, eventually changing the morphology of the nanocube into a hollow structure. H2O2 can diffuse into the inner pores of the nanocage and etch the residual Ag atoms in the template, leading to the production of Ag+ ions. The redox potential of Ag+/Ag (0.80 V) is higher than that of sub-3 nm Au+/Au (0.48 V). Some tiny AuNPs on the surface of the nanocage reduce Ag+ to Ag0 via a reverse current reaction, depositing it on the porous shell of the Au/Ag nanocage and covering them. As a result, the pore size in the nanocage decreases, and the Au/Ag nanocage gradually transforms into a closed nanobox. With the transformation of the nano-material's morphology, the LSPR peak shifts blue, accompanied by a color change of the solution from light blue to dark blue. The linear range for H2O2 detection in this method is 0.25~4.0 μM, with a limit of detection (LOD) of 0.2 μM. Similarly, this method can be used for glucose detection.
2Ag0 + H2O2 → 2Ag+ + 2OH-
AuNPs(sub-3 nm)+ Ag+ → Ag0 + Au+
Glucose + O2 G O x gluconic acid + H2O2

3.5 Colorimetric Sensing Constructed Based on Nanoparticle Growth

The chemical composition of nanoparticles greatly affects their dielectric properties and influences the interaction between nanoparticles and light waves, such as the number of plasmon resonance modes and the energy of resonance. Therefore, the LSPR response of nanoparticles can be altered by fabricating core-shell structured nanoparticles, nano-alloys, and hybrid nanoparticles. For instance, the LSPR response can be induced by nucleation, growth of new nanoparticles, or controllably growing shells on existing nanoparticles. For example, by growing a thin layer of silver shell on gold nanoparticles, the peak value of their longitudinal LSPR spectrum can be blue-shifted with the increase in the thickness of the deposited silver shell211.

3.5.1 Construction of Colorimetric Sensing Based on Silver Deposition Growth

Some reducing substances, such as ascorbic acid (AA), hydroquinone, uric acid, etc., can directly reduce Ag+ to generate silver nanoparticles. The detection of various reductants can be achieved based on silver deposition induced on the surface of gold nanorods. Plating silver on the AuNRs surface has been proven to be an effective method for amplifying the longitudinal LSPR displacement signal of AuNRs. A slight change in the aspect ratio of AuNRs caused by silver deposition will lead to a significant change in the longitudinal LSPR absorption peak from infrared to visible range. This method is based on a non-aggregation strategy, does not require labeling, is simple to operate, and is not prone to false positives or false negatives due to self-aggregation. Chen et al.212 achieved colorimetric determination of ascorbic acid by growing Ag on mesoporous silica-coated gold nanorods. In the presence of AA, silver was deposited on the silica-coated gold nanorods, causing the longitudinal LSPR band of the gold nanorods to gradually blue-shift from 663 nm to 601 nm. The detection limit of the method was 49 nM, comparable to the detection limit of fluorescence methods. Based on ascorbic acid-induced silver deposition, it is possible to indirectly detect enzymes or substrates that generate AA, or substances that inhibit AA generation213. It should be noted that compared with CTAB-modified AuNRs, the thin layer of mesoporous silica coating makes AuNRs more stable and enhances their analytical performance214-217. Alkaline phosphatase (ALP) can catalyze 4-aminophenyl phosphate (4-APP) to produce 4-aminophenol (4-AP), which can reduce silver nitrate to metallic silver. Based on this principle, a sandwich-structured silver layer was deposited on gold nano-bipyramids for colorimetric detection of the H5N1 virus218. As shown in Figure 19, as the deposition thickness increased, the peak gradually blue-shifted from 755 nm to 550 nm, and the solution color changed from reddish-brown to green and then to red.
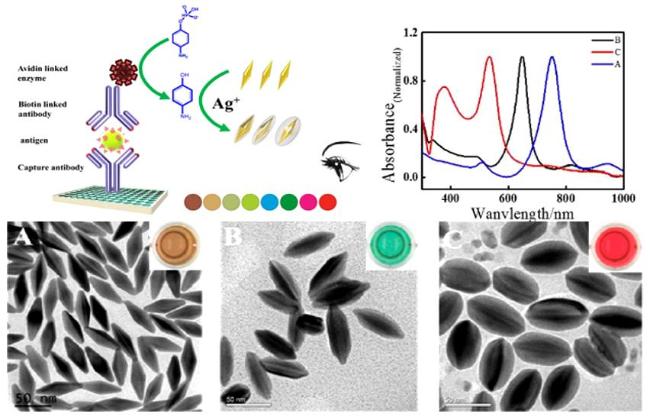
图19 Working Mechanism of Colorimetric Sensing Based on Silver Deposition on Gold Nano-Bipyramids and UV-Vis Absorption Spectra, TEM, and Photographs of AuNBPs with Different Thicknesses of Silver Deposition218

Fig. 19 The working mechanism of colorimetric sensing based on silver deposition on gold nanobipyramids and the UV absorption spectra, TEM and photos of AuNBPs with different thickness of silver deposition218. Copyright 2017, American Chemical Society

Zhang et al219 developed a multicolor colorimetric sensor for omethoate detection based on silver deposition on the surface of gold nanorods. Alkaline phosphatase (ALP) can induce the reduction of silver ions by catalyzing the dephosphorylation of ascorbic acid 2-phosphate (AAP) to generate ascorbic acid, which then deposits on the surface of AuNRs to form a silver nanoshell, thereby creating Ag/Au core-shell nanorods (Ag@AuNRs). The formation of Ag@AuNR alters the aspect ratio of AuNRs, causing a blue shift in the longitudinal LSPR peak of AuNRs and resulting in a series of visually discernible multicolor changes. However, omethoate can impede ALP-induced silver metallization by inhibiting ALP activity. The concentration of omethoate in the solution directly affects the concentration of generated AA, which ultimately determines the extent of silver shell deposition on the surface of AuNRs, leading to varying degrees of blue shift in the longitudinal LSPR peak of AuNRs.
Similarly based on the suppression of AA to reduce Ag+ deposition on the surface of nanorods, a colorimetric detection method for chromium speciation was constructed[220]. As shown in Figure 20, the introduction of different chromium species, including Cr3+, CrO42-, and Cr2O72-, reacts with AA through oxidation and complexation, reducing the concentration of AA, thereby preventing the formation of the Ag nano-shell to varying degrees, allowing different chromium ion species to undergo colorimetric reactions. The mixture of AA with the inhibitor Cr(Ⅳ) or Cr(Ⅲ) causes a blue shift and reduced absorbance in the Au@AgNR spectrum, accompanied by an obvious solution color change from red to green. Cr(Ⅲ) can complex with AA to reduce its concentration and decrease silver deposition, while Cr(Ⅳ) can affect the effective concentration of AA through both oxidation and complexation. The standard electrode potential of AA/dehydroascorbic acid (DHAA) is +0.41 V, lower than the electrode potential of Cr(Ⅵ)/Cr(Ⅲ), which is 1.33 V, so Cr(Ⅳ) can first oxidize part of AA, and the resulting Cr(Ⅲ) ions further reduce the effective concentration of AA through complexation. This sensing method was used for the colorimetric detection of three different concentrations of chromium ions. Under optimal conditions, Cr(Ⅲ) showed a good response in the concentration range of 10~1000 μmol·L-1, and Cr(Ⅵ) showed a good response in the concentration range of 1~200 μmol·L-1. The sensitivity of this method for Cr(Ⅵ) is higher than that for Cr3+, and the inhibition ability of Cr2O72- is almost twice that of CrO42- because Cr2O72- is a dimer of CrO42-. Based on the different response sensitivities of this scheme to different chromium ion species, combined with machine learning pattern recognition technology integration, it is possible to distinguish chromium ion species.
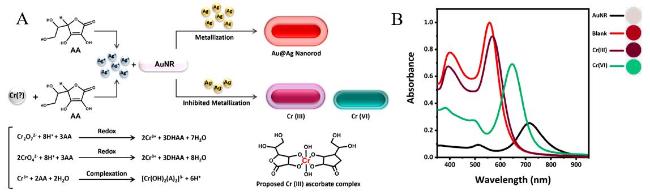
图20 (A) Schematic Illustration of the Multicolor Morphology Sensor; (B) Absorption Spectra and Corresponding Images of Au@AgNRs in the Presence of Different Chromium Samples220

Fig. 20 (A)Schematic diagram of the principle of multi-color shape sensor.(B)The absorption spectra and corresponding images of Au@AgNRs in the presence of different chromium samples220. Copyright 2023, American Chemical Society

Similarly based on ALP-induced silver deposition on the surface of gold nanoflowers, ALP can be directly detected, or ALP can be used as a label to introduce ALP into the detection system with the help of hybridization chain reaction for detecting biomolecules such as DNA221. As shown in Figure 21, longer DNA double strands can be formed through target-induced hybridization chain reaction. Since the end of hairpin-structured DNA strand H1 is modified with biotin, ALP modified with streptavidin can be introduced, then trigger enzyme-catalyzed reaction to generate AA to reduce silver ion deposition on gold nanoflowers, causing a blue shift of the LSPR peak of gold nanoflowers, accompanied by a color change from blue to dark blue to purple to orange. The linear range of this scheme for detecting ALP is 1.0 pmol·L-1~25 nmol·L-1, with a detection limit of 0.5 pmol·L-1. Using this scheme to detect DNA, the linear range is 10 fmol·L-1~50 pmol·L-1, with a detection limit of 2.6 fmol·L-1.
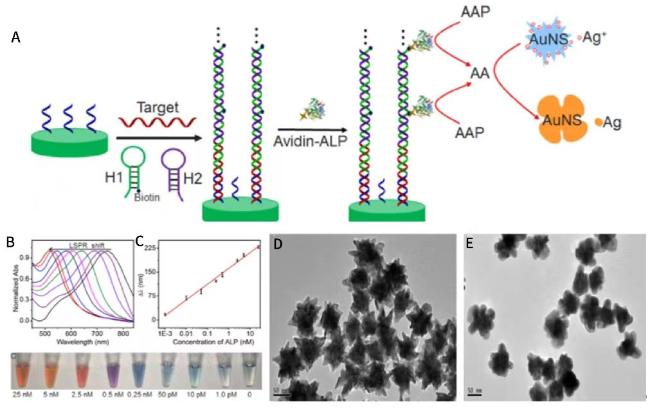
图21 (A) Schematic Illustration of HCR-Based DNA Detection and Plasmonic Colorimetric Strategy; (B) UV-Vis Spectra of AuNS and AAP Mixture in the Presence of Different Concentrations of ALP; (C) Plot of Peak Shift Versus Logarithm of ALP Concentration and Photographs of Detection Solution Color Change; (D) TEM Images of AuNS and (E) AgNPs-Coated AuNS221

Fig. 21 (A)Schematic diagram of DNA detection and plasma colorimetric strategy based on HCR;(B)UV-Vis spectra of the mixture of AuNS and AAP in the presence of different concentrations of ALP;(C)The relationship between the peak shift of ALP concentration and logarithm and the photo of detecting the color change of the solution; TEM images of(D)AuNS and(E)AuNS coated AgNPs221. Copyright 2016, Elsevier

When the biogenic amine gas generated in food storage enters the solution containing AuNRs, resorcinol monoacetate (RMA), and AgNO3, it will cause an increase in the pH of the system. In an alkaline environment, the hydrolysis of resorcinol monoacetate (RMA) will produce the reduction product resorcinol, which can reduce silver ions to silver atoms (Ag0) and deposit on the surface of AuNRs to form a silver nanoshell. Based on this, the Guo team222 constructed a colorimetric sensor to detect biogenic amines produced by food spoilage. The change in the surface composition and aspect ratio of Au-NRs leads to the longitudinal LSPR peak shifting from 810 nm to 550 nm, resulting in a unique multicolor change from pink to brick red. The color change and blue shift of the longitudinal LSPR peak of AuNRs are related to the concentration of biogenic amines and the degree of food spoilage.
Jiang Xingyu et al223 reported a glucose colorimetric assay based on AuNRs-induced silver growth. When Ag(NH3)2OH (Tollen's reagent) is added to polystyrene sulfonate-modified AuNRs (PSS-AuNRs) with negatively charged surfaces, Ag+ will be enriched on the AuNR surface through electrostatic interaction, resulting in a high local concentration of Ag+ around the AuNRs. When glucose is introduced into the system, an oxidation-reduction reaction between Ag+ and glucose generates AgNPs. During this process, independent AgNPs are observed rather than being attached to the surface of gold rods, thus the solution color changes from pale to yellow, and the absorbance at 410 nm gradually increases. In this process, the charge on the surface of the gold rods plays an important role. If CTAB-modified gold rods with positive charges or cysteamine-modified gold rods are used, the formation of AgNPs cannot be observed. Similarly, AgNPs formation can also be seen with citrate-modified gold rods with negative charges. For negatively charged AuNRs/AuNPs, Ag+ in Tollen’s reagent can be attracted to their surfaces through electrostatic interactions. Therefore, the relatively high local concentration of Ag+ promotes the reaction to generate AgNPs.
Zeng et al224 developed a colorimetric sensing method for detecting HCHO based on its reaction with Tollens' reagent, which resulted in the anisotropic deposition of a silver shell on bone-shaped gold nanorod cores. Compared with conventional rod-shaped AuNRs, the bone-shaped AuNRs, due to their unique concave structure, facilitate Ag deposition in the recessed areas, thereby enabling rapid reaction kinetics and detection rates. On the other hand, replacing the stabilizing AuNRs ligand from CTAB to CTAC helps accelerate silver deposition on AuNRs, significantly reducing the reaction time. The prepared bone-shaped AuNRs exhibit two main extinction bands at 520 nm and 715 nm, caused by transverse and longitudinal LSPR respectively, along with a small peak at approximately 575 nm, which is the characteristic LSPR band of bone-shaped AuNRs. With the addition of HCHO into the system and the subsequent deposition of the silver layer, the longitudinal LSPR peak undergoes a blue shift, and a new LSPR peak appears at around 400 nm, attributed to the formation of a silver layer on the AuNR core. As shown in Figure 22, TEM images indicate that the thickness of the silver nanoshell increases continuously in the transverse direction because the rate of silver deposition in the transverse direction is higher than the rate of change in the longitudinal direction—a phenomenon consistent with the fact that the rate of change of the transverse LSPR band of AuNRs is smaller than the rate of change in the longitudinal direction. With the deposition of silver, the apparent color of the solution changes from light gray to dark blue, purple, red, orange, and finally to yellow, while the longitudinal LSPR absorption peak shifts from 710 nm to 500 nm. The developed colorimetric method enables sensitive detection of HCHO with a linear range of 0.1~50 μM and a detection limit of 1 nM.
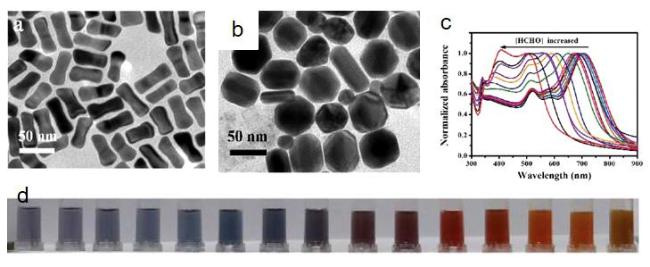
图22 (a) TEM Image of Typical Bone-Shaped AuNRs; (b) TEM Image of Au@AgNRs Formed by the Reaction of AuNRs-Tollens Reagent with HCHO; (c) Normalized UV-vis Absorption Spectra and Corresponding Photographs (d) of Bone-Shaped AuNRs-Tollens Reagent Mixture After Incubation with Different Concentrations of HCHO Under Optimized Conditions 224

Fig. 22 (a)TEM images of typical skeletal AuNRs;(b)TEM images of Au@AgNRs formed by the reaction of AuNRs-Tollens reagent with HCHO.(c)After incubation with different concentrations of HCHO under optimized conditions, the normalized UV-vis absorption spectra of the bone-like AuNRs-Tollens reagent mixture and the corresponding photos (d)224. Copyright 2019, Royal Society of Chemical

As shown in Figure 23, Ag-Au nanorings are prepared using AgNPRs as sacrificial templates through a galvanic replacement reaction between AgTNP and HAuCl4[225]. Galvanic replacement is the process where metal B ions with a higher reduction potential oxidize metal A, which serves as the sacrificial template. When AgTNPs are mixed with HAuCl4, because the standard reduction potential of the AuCl4-/Au redox pair (0.99 V vs. the standard hydrogen electrode, SHE) is higher than that of the Ag+/Ag redox pair (0.80 V vs. SHE), AgTNPs are oxidized into silver ions. The coordination number of Ag atoms at the sharp vertices {110} crystal plane of AgTNPs is lower than that of the {111} plane, leading to higher surface energy in the vertex regions, making the vertices and edges more prone to oxidation. Au atoms tend to deposit at the edges of AgTNPs, forming an Ag-Au alloy structure. As the amount of HAuCl4 increases, Ag atoms in the central region of AgTNPs are oxidized and dissolve into the solution as Ag+, while the electrons released by Ag are captured by Au+, producing Au atoms through a reduction reaction.
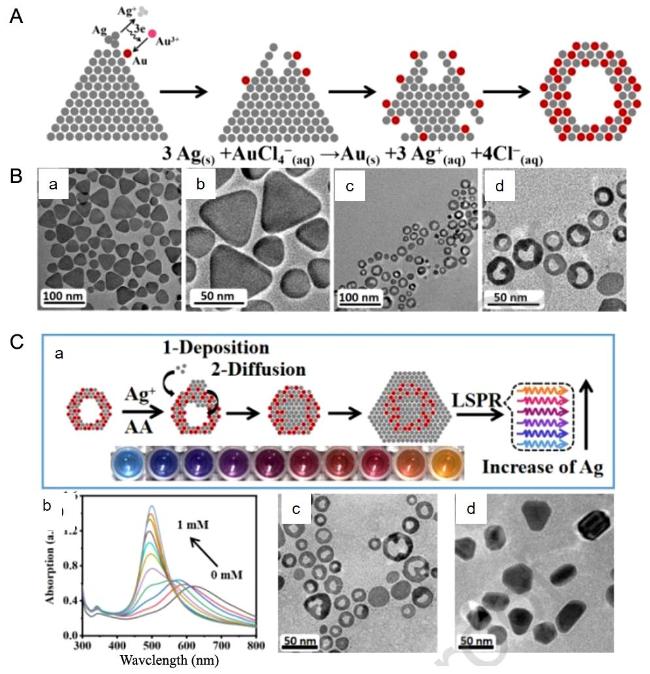
图23 Schematic Illustration of the Preparation Process of Gold-Silver Nanorings (A) and Corresponding TEM Images (B) and (C) Schematic Diagram, Absorption Spectrum, and Microscopy Image of Silver Deposited on Gold-Silver Nanorings225

Fig. 23 Schematic diagram of the preparation process of gold-silver nanorings(A)and the corresponding TEM diagram (B)and(C)silver deposition in gold-silver nanorings schematic, absorption spectra and electron microscopy225. Copyright 2022, Elsevier

3Ag(s) + AuCl4 - (aq) → Au(s) + 3Ag+ (aq) + 4Cl- (aq)
After Ag deposition, it migrates to the inner surface of the Ag-Au nanoring through surface diffusion, thereby reducing the ring's surface area and minimizing the total free energy of the system. As the AA concentration increases, more silver is deposited, and the nanostructure changes from light blue to dark blue, purple, pink, and orange, with the corresponding LSPR peak shifting from 620 nm to 500 nm. The narrow internal structure of the nanoring has a larger specific surface area compared to solid spheres or rods, making it more sensitive to Ag growth. This sensitivity to Ag growth is directly reflected in the larger range of LSPR peak shifts. Ag-Au nanorings, with their unique structure and alloy composition, exhibit greater LSPR peak shifts than AuNPs and AuNRs. Based on the deposition of anionic reduction by AA on the nanoring, and integrating the enzyme-assisted growth process, a sandwich enzyme-linked immunosorbent assay for amantadine detection was constructed.

3.5.2 Construction of Colorimetric Sensing Based on Gold Deposition Growth

As shown in Figure 24, Wang et al.226] developed a system based on HCl-reduced nicotinamide adenine dinucleotide I (NADH)-ascorbic acid (AA) mediation that can accurately regulate the growth rate of AuNBPs for detecting AA. In the HCl-NADH-AA mediated AuNBPs growth system, Au3+ is first reduced to Au+ by NADH, then AA further reduces Au+ to Au0 to promote the growth of AuNBPs, thereby producing a colorful multicolor change. According to the Nernst equation, the reduction potential of AA is inversely proportional to the H+ concentration. Therefore, at low HCl concentrations (6 mM, L-channel mode), AA has a higher reduction potential, thus mediating the growth of AuNBP at a higher rate at low AA concentrations. At high HCl concentrations (35 mM, H-channel mode), AA has a lower reduction potential, thus requiring a high AA concentration to mediate the growth of AuNBP at a lower rate. The growth rate of NADH-AA mediated AuNBPs can be adjusted by controlling the HCl concentration to generate dual AA-corresponding multicolor signal channels. The L-channel mode has higher sensitivity and can be used for AA detection in the low concentration range, while the H-channel mode has lower sensitivity and can be used for AA detection in the high concentration range. Based on the inhibition of the ALP enzyme-catalyzed AAP process by sulfonamides, this method can be used for the detection of sulfonamide drugs. The team utilized antibody-antigen sandwich structures to introduce ALP for detecting tumor markers based on NADH-AA mediated AuNBPs227.
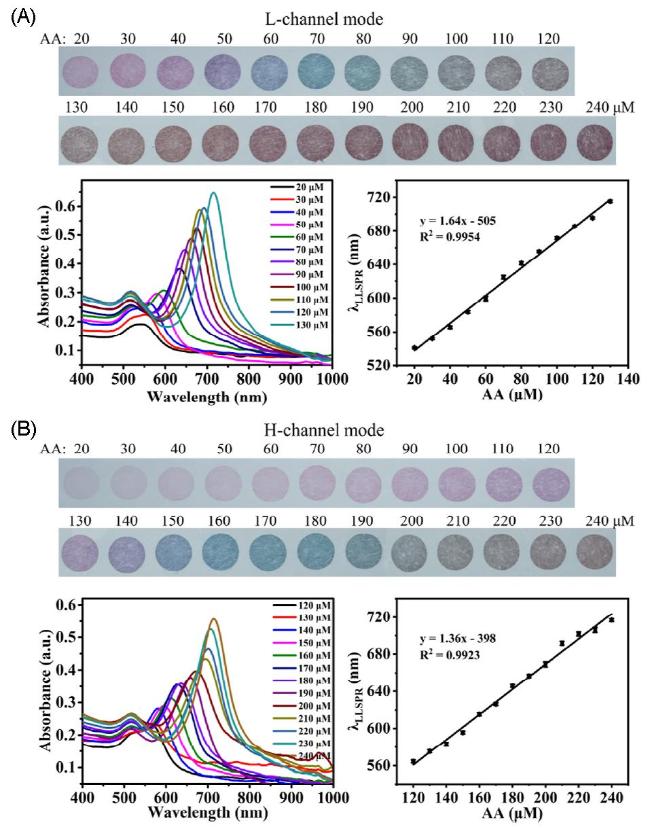
图24 Color Changes, Absorption Spectra Transformation, and Linear Plots of Au Deposition Generated by Different Amounts of AA Reduction of Au Under Low HCl Concentration (A) and High HCl Concentration (B) 226

Fig. 24 The color change, absorption spectrum transformation and linear diagram of gold nanobipyramids formed by different amounts of AA reducing Au to Au deposition at low HCl concentration(A)and high HCl concentration(B)226. Copyright 2023, American Chemical Society

Similarly, He et al228 proposed a colorimetric detection method for organophosphorus pesticides based on AChE-mediated growth of AuNBPs. Firstly, highly uniform AuNBPs can be conveniently and rapidly prepared through an in-situ seed-mediated growth method. However, when AChE with high enzyme activity is present, it can effectively catalyze the hydrolysis of ATCh to produce TCh. The obtained TCh containing thiol has a strong binding ability to gold seeds, thereby inhibiting the growth of gold seeds to form AuNBPs. This process leads to a significant short-wavelength shift of the longitudinal LSPR peak and an obvious change in solution color. On the contrary, when OPs are present, they inhibit the enzyme activity, leading to the inability to catalyze the hydrolysis of ATCh into TCh, thus allowing the smooth growth of AuNBPs.

4 Colorimetric Sensor Array

The construction of sensing faces the problem of selective detection. Generally, structural analogs (containing the same sensitive groups) or substances with similar properties (redox properties, etc.) can trigger the response of sensing, and the presence of these substances will interfere with the sensing. It is difficult to distinguish when these interfering substances coexist in the matrix. The sensor array detection chip is a sensor that combines sensitive elements into an array, and the specificity and selectivity of its sensitive elements are relatively low. The concept of weakened keys and locks can be used to explain the array sensing detection system, that is, there may be multiple keys that can be inserted into the keyhole, but each key has a different degree of unlocking. According to the characteristics of different sensitive elements that can produce cross-sensitive responses of different degrees with different components of the analyte, a unique fingerprint spectrum is constructed, and data processing methods are used to deeply mine the multiple variables generated by the response, thereby achieving the purpose of identifying and distinguishing analytes. The construction of the colorimetric sensor array is that the array chip performs digital imaging on the array before and after exposure to the analyte, and through simple digital subtraction (pixel by pixel), generates a pattern diagram with fingerprint characteristics, and then performs clustering and classification analysis. Cluster analysis essentially tells us who is similar to whom, that is, the proximity of data variables representing different cases in multidimensional space. Classification analysis compares the results of case data with known qualitative and quantitative databases to predict which type of analyte the case data belongs to. The main analytical methods in these two types of statistical methods are Hierarchical Cluster Analysis (HCA), Principal Component Analysis (PCA), and Linear Discriminant Analysis (LDA).
Based on the different responses of noble metal nanoparticles with different chemical compositions, sizes, morphologies, and surface properties to different analytes, various colorimetric analysis sensor arrays can be constructed. For example, Wu's team229 built a colorimetric sensor array based on the varying degrees of aggregation of four gold colloids with different surface charges caused by 15 types of microorganisms. They separately prepared AuNPs modified with mercaptopropionic acid (AuNPs@MPA), AuNPs modified with mercaptosuccinic acid (AuNPs@MSA), AuNPs modified with cysteamine (AuNPs@Cys), and AuNPs modified with cetyltrimethylammonium bromide (AuNPs@CTAB), with Zeta potentials of -12.37, -17.43, 31.27, and 4.37 mV, respectively. The surfaces of most microorganisms are negatively charged, and their interaction with gold colloids of different surface charges will lead to different color distributions. A total of 15 microorganisms were selected, including 12 bacteria and 3 fungi. Due to electrostatic interactions, almost all microorganisms caused a color change in the positively charged AuNPs, indicating that surface charge plays an important role in microbial identification. However, Clostridium septicum caused only a slight color change in AuNPs@CTAB. Additionally, a few microorganisms caused a color change in the negatively charged AuNPs@MPA and AuNPs@MSA, while most microorganisms did not. In fact, the interaction between AuNPs and microorganisms is not limited to electrostatic interactions but also includes other interactions such as hydrophobic interactions. Even if microorganisms have similar surface zeta potentials, they may still cause different color changes in positively charged AuNPs, suggesting that differences in the surface or structure of microorganisms might also play a role in the interaction between AuNPs and microorganisms. Similarly, due to multi-factor interactions, negatively charged AuNPs can attach to the surface of microorganisms to varying degrees, causing different color changes. Based on this, the use of four types of AuNPs with different charges can distinguish 15 different microorganisms.
As shown in Figure 25, Zhou's team230 constructed a colorimetric sensor array based on the aggregation of five kinds of gold nanorods with different surface modifications to distinguish and detect eight different pesticides. The specific mechanism is as follows: thiocholine produced by the hydrolysis of acetylthiocholine iodide (ATCh) can easily bind to the surface of AuNPs through Au—S bonds, causing the aggregation of AuNPs and leading to a change in solution color. The hydrolytic ability of acetylcholinesterase (AChE) is affected by different pesticides; thus, based on five different AuNPs, eight pesticides were successfully distinguished by colorimetry. The maximum absorption peaks of the five AuNPs with different surface modifications are 510 nm (AuNPs@TSC+NaBH4), 519 nm (AuNPs@TSC-1), 525 nm (AuNPs@TSC-2), 514 nm (AuNPs@NaBH4) and 521 nm (AuNPs@AA), respectively, and their surface Zeta potentials are -14.1 mV (AuNPs@TSC + NaBH4), -40.4 mV (AuNPs@TSC-1), -48.6 mV (AuNPs@TSC-2), -29.3 mV (AuNPs@NaBH4), and -31.0 mV (AuNPs@AA). When only one type of AuNPs is used as a colorimetric probe, the color differences caused by eight different pesticides are not obvious, but the combined use of five nano-Au types allows for convenient differentiation of various pesticides.
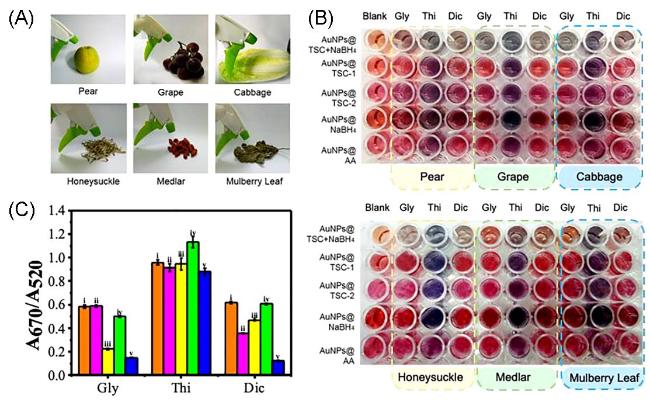
图25 (A) Simulation of the Spraying Process of Pesticides (Gly, Thi, Dic) on the Surfaces of Fruits (Pear and Grape), Vegetables (Cabbage), and TCBs (Honeysuckle, Goji Berry, Mulberry Leaf). (B) A Colorimetric Sensor Array for Discriminating Three Pesticide Residues in Two Fruit Samples (Pear and Grape), One Vegetable Sample (Cabbage), and Three TCB Samples (Honeysuckle, Goji Berry, Mulberry Leaf); (C) Detection of Gly, Thi, and Dic in Real Samples Using Five AuNPs with A670/A520230.

Fig. 25 (A)Simulated the spraying process of pesticides ( Gly, Thi, Dic ) on the surface of fruits ( pears and grapes ), vegetables ( cabbage ) and TCBs ( honeysuckle, wolfberry, mulberry leaves ).(B)A colorimetric sensor array was used to distinguish three pesticide residues in two fruit samples ( pear and grape ), one vegetable sample ( cabbage ) and three TCB samples ( honeysuckle, wolfberry and mulberry leaves ).(C)Detection of A670 / A520 of five AuNPs of Gly, Thi and Dic in actual samples230. Copyright 2023, Elsevier

Abbasi-Moayed et al.231 utilized three different halogen particles, Br-, Cl-, and I-, to exhibit varied color construction for the etching of triangular silver at different times, forming a colorimetric sensor array. Zhou et al.232 demonstrated a multi-channel colorimetric sensor array for detecting five thiols in water and diluted fetal bovine serum based on a pH-induced silver nanoprisms (AgNPRs) etching strategy. It was found that under alkaline conditions (pH=11, pH=11.6, pH=12), AgNPRs were etched by dissolved oxygen, causing a blue shift in localized surface plasmon resonance (LSPR) absorption. Due to the high affinity of thiols to AgNPRs at different pH values, accelerated etching resulted in different LSPR peaks, thus their interactions produced distinct absorbance response patterns. The prepared multi-channel colorimetric sensor array efficiently detected five thiols: glutathione (GSH), cysteine (Cys), dimercaptosuccinic acid (DMSA), 3-mercaptopropionic acid (MPA), and dithiothreitol (DTT), with detection concentrations as low as 10 nM. Using principal component analysis (PCA), it is possible to distinguish among three different concentrations of thiols (10, 80, and 400 nM) and five thiols at a concentration of 400 nM. Similarly, Torres-Mapa et al.233 synthesized three different sizes, shapes, and functionalized gold nanoparticles, including spherical and anisotropic shapes modified with cetyltrimethylammonium bromide (CTAB), spherical mercaptoethylamine (MEA)-modified gold nanoparticles, and negatively charged gold nanoparticles aggregating on positively charged bacterial surfaces, forming a biosensor array to detect four oral bacteria (Aggregatibacter actinomycetemcomitans, Actinomyces naeslundii, Porphyromonas gingivalis, and Streptococcus oralis). Due to the different shapes and sizes of the four bacteria and the varying sizes and shapes of the three different gold nanoparticles, aggregation led to different color changes; based on this, according to the array's color change, four different bacteria could be detected with high specificity. Gu’s team234 used two nano-gold stars with different sizes and branching degrees and a mixture solution of both in a 1:1 ratio to form three different nano-gold colloids. Based on their aggregation on the surfaces of four bacteria with different shapes and surface charge distributions, they constructed a colorimetric sensing array to detect Gram-positive Staphylococcus aureus and Gram-negative ocular pathogens such as Xanthomonas maltophilia, Pseudomonas acidophilus, and Pseudomonas syringae, which can construct a colorimetric sensing array to simultaneously detect spermine (SP), spermidine (SD), histamine Pseudomonas aeruginosa, and four different bacteria. Utilizing the different aggregation degrees of gold and silver colloids under the influence of various biogenic amines, different color changes were induced to detect histamine (HS) and tryptamine (TP) among several different biogenic amines.235

5 Conclusions and Prospects

In this paper, we summarize the nanoparticle LSPR colorimetric sensing analysis constructed based on aggregation and non-aggregation strategies. First, through the color change between AuNPs and AgNPs with good dispersion and aggregation, the interaction and chemical reaction of target analytes with nanoparticles, many sensing analysis methods based on aggregation and de-aggregation strategies have been creatively designed and developed. In addition, we summarize the colorimetric sensing constructed based on the regulation of nanoparticle morphology and particle size. Compared with aggregated plasma analysis, the colorimetric sensing constructed based on the etching or growth of plasma nanoparticles avoids complex and time-consuming labeling procedures, does not generate false positive results caused by the auto-aggregation of nanoparticles, and can be made into practical test strips by fixing nanoparticles on an appropriate substrate. These advantages can significantly improve detection accuracy and reproducibility. Finally, for the selectivity issues faced in constructing colorimetric sensing, we summarize various colorimetric sensing arrays constructed based on different responses produced by noble metal nanoparticles of different properties to different analytes. Therefore, the LSPR colorimetric sensing based on noble metal nanoparticles can be used for selective and sensitive detection of metal ions, organic small molecules, and macromolecules, involving clinical, food, and environmental fields, which is highly significant. However, before the wider application of colorimetric sensors based on noble metal nanoparticles, there are still key issues that need to be resolved.
(1) The current preparation methods of nanoparticles cannot meet the requirements for large-scale application synthesis of highly uniform nanomaterials, and many traditional synthesis schemes require long incubation times and tedious washing steps, which largely limits the practical application of these sensors.
(2) Moreover, the relationship between the color change of solutions and the morphology, size, or composition of nanoparticles still lacks theoretical calculations. Computer simulations will become a powerful tool for selecting suitable nanomaterial candidates. Therefore, further efforts and exploration are still needed for the future production of large quantities of stable nanomaterials.
(3) Moreover, driven by the application of point-of-care testing diagnostics, some drawbacks of multicolor sensing, such as the common drawback of long catalytic reaction times for nanoparticle growth or etching based on enzyme catalysts; the transformation of size, shape, or morphology of plasmonic nanoparticles being easily affected by complex external environments; and multicolor colorimetric systems mostly being constructed in solution systems, which are inconvenient for further use, should also be further improved to meet the requirements of practical applications.
(4) Compared with aggregation-based colorimetric sensing, the detection targets of colorimetric sensing based on morphology and particle size-controlled LSPR have greater limitations, usually restricted to oxidizing substances (etching) and reducing substances (deposition). The development of aggregation-based colorimetric sensing expands the detection targets.
In summary, further efforts are still needed to explore the analysis and detection of other molecules with significant importance in more fields using nanoparticle LSPR colorimetric sensing, so as to enable the widespread application of colorimetric sensors in many fields such as the chemical industry, environment, biological systems, and medicine, and to potentially replace some traditional analytical methods used in these important fields in the future. In the future, with the advancement of materials science and new analytical technologies, the potential applications of plasma sensors based on the aggregation and non-aggregation of metal nanoparticles will be further enhanced.
[1]
Cui Y Y Zhao J Li H D. Biosensors202313(8): 801.

[2]
Wang W Z You Y Gunasekaran S. Compr. Rev. Food Sci. Food Saf.202120(6): 5829.

[3]
Sadiq Z Safiabadi Tali S H Hajimiri H Al-Kassawneh M Jahanshahi-Anbuhi S. Crit. Rev. Anal. Chem.202454(7): 2209.

[4]
Sanka I Bartkova S Pata P Ernits M Meinberg M M Agu N Aruoja V Smolander O P Scheler O. Anal. Chim. Acta2023, 1272: 341397.

[5]
Llano-Suárez P Sánchez-Visedo A Ortiz-Gómez I Fernández-Argüelles M T Prado M Costa-Fernández J M Soldado A. Biosensors202414(8): 377.

[6]
Rasheed S Haq M A U Ahmad N, Sirajuddin, Hussain D. Food Chem.2023, 429: 136925.

[7]
Placer L Lavilla I Pena-Pereira F Bendicho C. Sens. Actuat. B Chem.2023, 377: 133109.

[8]
Rasheed S Ahmad N Nafady A Anwar Ul Haq M Kanwal T, Mujeeb-ur-Rehman, Hussain D, Sirajuddin, Ali Soomro R. Measurement2025, 239: 115519.

[9]
Elghanian R Storhoff J J Mucic R C Letsinger R L Mirkin C A. Science1997277(5329): 1078.

[10]
Hatamie A Zargar B Jalali A. Talanta2014, 121: 234.

[11]
Soomro R A Nafady A, Sirajuddin, Memon N Sherazi T H Kalwar N H. Talanta2014, 130: 415.

[12]
Cao R Li B X. Chem. Commun.201147(10): 2865.

[13]
Su H C Fan H Ai S Y Wu N Fan H M Bian P C Liu J C. Talanta201185(3): 1338.

[14]
Can K Can Z Y Üzer A Apak R. Talanta2023, 260: 124585.

[15]
Rohani Bastami T Bayat M Paolesse R. Sensors202222(5): 2072.

[16]
Ma S He J Guo M Z Sun X H Zheng M D Wang Y Y. Colloids Surf. A Physicochem. Eng. Aspects2018, 538: 343.

[17]
Chotchuang T Cheewasedtham W Jayeoye T J Rujiralai T. Microchim. Acta2019186(9): 655.

[18]
Mohammadi S Khayatia G. Spectrochim. Acta A Mol. Biomol. Spectrosc.2017, 185: 27.

[19]
Das U Hoque R Biswas R. Appl. Phys. A2023129(5): 328.

[20]
UshaVipinachandran V Rajendran S Ali H Ashokan I Bhunia S K. New J. Chem.202246(29): 14081.

[21]
Ivrigh Z J Fahimi-Kashani N Hormozi-Nezhad M R. Spectrochim. Acta Part A Mol. Biomol. Spectrosc.2017, 187: 143.

[22]
Chen Y C Lee I L Sung Y M Wu S P. Talanta2013, 117: 70.

[23]
Hu M H Huang W H Suo L L Zhou L H Ma L F Zhu H F. Anal. Methods20179(38): 5598.

[24]
Ruíz del Portal-Vázquez P López-Pérez G Prado-Gotor R Román-Hidalgo C Martín-Valero M J. Materials202013(6): 1373.

[25]
Bhamore J R Gul A R Kailasa S K Kim K W Lee J S Park H Park T J. Sens. Actuat. B Chem.2021, 334: 129685.

[26]
Ratnarathorn N Chailapakul O Dungchai W. Talanta2015, 132: 613.

[27]
Zannotti M Piras S Remia L Appignanesi D Giovannetti R. Chemosensors202412(3): 33.

[28]
Rastogi L Dash K Ballal A. Sens. Actuat. B Chem.2017, 248: 124.

[29]
Gong L L Du B B Pan L Liu Q J Yang K H Wang W Zhao H Wu L He Y J. Microchim. Acta2017184(4): 1185.

[30]
Yao Y Tian D M Li H B. ACS Appl. Mater. Interfaces20102(3): 684.

[31]
Mohammadi S Khayatian G. Spectrochim. Acta Part A Mol. Biomol. Spectrosc.2015, 148: 405.

[32]
Fan P F He S Z Cheng J L Hu C C Liu C Yang S Y Liu J Q. Luminescence202136(3): 698.

[33]
Fu K Y Zheng Y Li J Liu Y S Pang B Song X L Xu K Wang J Zhao C. J. Agric. Food Chem.201866(36): 9516.

[34]
Lee J S Han M S Mirkin C A. Angew. Chem. Int. Ed.200746(22): 4093.

[35]
Aulsebrook M L Watkins E Grace M R Graham B Tuck K L. ChemistrySelect20183(7): 2088.

[36]
Ashif Ikbal M D Kang S K Chen X H Gu L C Wang C. ACS Sens.20238(12): 4696.

[37]
Liu D B Qu W S Chen W W Zhang W Wang Z Jiang X Y. Anal. Chem.201082(23): 9606.

[38]
Gao N Huang P C Wu F Y. Spectrochim. Acta A Mol. Biomol. Spectrosc.2018, 192: 174.

[39]
Huang S X Jin Y N Cao G M Tian Y F Xu K L Hou X D. Microchem. J.2018, 141: 258.

[40]
Liu Q J Han P Gong W W Wang H Feng X Y. Microchim. Acta2018185(7): 354.

[41]
Choi Y Ho N H Tung C H. Angew. Chem. Int. Ed.200746(5): 707.

[42]
Shanmugaraj K Sasikumar T Campos C H Ilanchelian M Mangalaraja R V Torres C C. Spectrochim. Acta Part A Mol. Biomol. Spectrosc.2020, 236: 118281.

[43]
Elavarasi M Rajeshwari A Alex S A Nanda Kumar D Chandrasekaran N Mukherjee A. Anal. Methods20146(14): 5161.

[44]
He Z Y Yin H L Chang C C Wang G Q Liang X G. Biosensors202010(11): 167.

[45]
Gan Y Liang T Hu Q W Zhong L J Wang X Y Wan H Wang P. Talanta2020, 208: 120231.

[46]
Li X Y Cheng R J Shi H J Tang B Xiao H S Zhao G H. J. Hazard. Mater.2016, 304: 474.

[47]
Zhou X T Wang L M Shen G Q Zhang D W Xie J L Mamut A Huang W W Zhou S S. Microchim. Acta2018185(7): 355.

[48]
Shahdordizadeh M Yazdian-Robati R Ansari N Ramezani M Abnous K Taghdisi S M. Microchim. Acta2018185(2): 151.

[49]
Sajed S Kolahdouz M Sadeghi M A Razavi S F. ACS Omega20205(42): 27675.

[50]
Li D Wieckowska A Willner I. Angew. Chem. Int. Ed.200847(21): 3927.

[51]
Li L Li B X Qi Y Y Jin Y. Anal. Bioanal. Chem.2009393(8): 2051.

[52]
Wang Y Yang F Yang X R. Biosens. Bioelectron.201025(8): 1994.

[53]
Xiao W Xiao M Fu Q Q Yu S T Shen H C Bian H F Tang Y. Sensors201616(11): 1871.

[54]
António M Ferreira R Vitorino R Daniel-da-Silva A L. Talanta2020, 214: 120868.

[55]
Ham S H Kim E Han H Lee M G Choi Y J Hahn J. Anal. Methods202416(3): 449.

[56]
Wen L N Du X Y Liu T C Meng W Li T Li M J Zhang M. ACS Omega20238(18): 16000.

[57]
Feng J L Shen Q Wu J J Dai Z Y Wang Y. Food Contr.2019, 98: 333.

[58]
Jia J Yan S Lai X X Xu Y Z Liu T Xiang Y H. Food Anal. Methods201811(6): 1668.

[59]
Wang P L Su X O Shi L Yuan Y W. Microchim. Acta2016183(11): 2899.

[60]
Zou L Li X H Lai Y F. Microchem. J.2021, 162: 105858.

[61]
Wang H Wang Y X Jin J Y Yang R H. Anal. Chem.200880(23): 9021.

[62]
Jalalian S H Lavaee P Ramezani M Danesh N M Alibolandi M Abnous K Taghdisi S M. Spectrochim. Acta Part A Mol. Biomol. Spectrosc.2021, 246: 119062.

[63]
Wu Y G Zhan S S Wang L M Zhou P. Anal.2014139(6): 1550.

[64]
Wu Y G Zhan S S Wang F Z He L Zhi W T Zhou P. Chem. Commun.201248(37): 4459.

[65]
Le Thao Nguyen N Park C Y Park J P Kailasa S K Park T J. New J. Chem.201842(14): 11530.

[66]
Wu Y G Liu L Zhan S S Wang F Z Zhou P. Anal.2012137(18): 4171.

[67]
Ulloa-Gomez A M Lucas A Koneru A Barui A Stanciu L. Biosens. Bioelectron.2023, 221: 114419.

[68]
Wen J H Liu Y M Li J W Lin H Zheng Y R Chen Y Fu X L Chen L X. Anal.2020145(7): 2774.

[69]
Li X Y Wu Z T Zhou X D Hu J M. Biosens. Bioelectron.2017, 92: 496.

[70]
Wu S Sheng L N Kou G C Tian R Ye Y L Wang W Y Sun J D Ji J Shao J D Zhang Y Z Sun X L. Biosens. Bioelectron.2024, 249: 116005.

[71]
Sato K Hosokawa K Maeda M. J. Am. Chem. Soc.2003125(27): 8102.

[72]
Kanayama N Takarada T Maeda M. Chem. Commun.201147(7): 2077.

[73]
Kanayama N Takarada T Fujita M Maeda M. Chem.201319(33): 10794.

[74]
Akiyama Y Shikagawa H Kanayama N Takarada T Maeda M. Chem.201420(52): 17420.

[75]
Khan S A Singh A K Senapati D Fan Z Ray P C. Chem. Commun.201147(33): 9444.

[76]
Verma M S Chen P Z Jones L Gu F X. RSC Adv.20144(21): 10660.

[77]
Lin G H Xian L B Zhou X M Wang S Shah Z H Edwards S A Gao Y X. ACS Appl. Mater. Interfaces202012(44): 50152.

[78]
Feng Z Q Jia Y Cui H Y. J. Colloid Interface Sci.2024, 672: 1.

[79]
Krpetić Ž Guerrini L Larmour I A Reglinski J Faulds K Graham D. Small20128(5): 707.

[80]
Godakhindi V S Kang P Y Serre M Revuru N A Zou J M Roner M R Levitz R Kahn J S Randrianalisoa J Qin Z P. ACS Sens.20172(11): 1627.

[81]
Guo L H Xu Y Ferhan A R Chen G N Kim D H. J. Am. Chem. Soc.2013135(33): 12338.

[82]
Wang F F Liu S Z Lin M X Chen X Lin S R Du X Z Li H Ye H B Qiu B Lin Z Y Guo L H Chen G N. Biosens. Bioelectron.2015, 68: 475.

[83]
Chen X Y Ha W Shi Y P. Talanta2019, 194: 475.

[84]
Xiong Y M Li M M Liu H Q Xuan Z H Yang J Liu D B. Nanoscale20179(5): 1811.

[85]
Deng H H Huang K Y Fang Q H Lv Y P He S B Peng H P Xia X H Chen W. Sens. Actuat. B Chem.2020, 311: 127925.

[86]
Peng R F He H B Wang Q Yan X X Yu Q W Qin H X Lei Y Y Luo L Q Feng Y Q. Anal. Chim. Acta2018, 1036: 147.

[87]
Mao L H Wang Q Q Luo Y H Gao Y P. Talanta2021, 222: 121506.

[88]
Deng H H Wu C L Liu A L Li G W Chen W Lin X H. Sens. Actuat. B Chem.2014, 191: 479.

[89]
Liu G Y Zhang R N Huang X D Li L Y Liu N X Wang J Xu D H. Sensors201818(5): 1595.

[90]
Li D X Wang S Wang L Zhang H Hu J D. Anal. Bioanal. Chem.2019411(12): 2645.

[91]
Kumar P Kumar P Manhas S Navani N K. Sens. Actuat. B Chem.2016, 233: 157.

[92]
Arumugam S S Varghese A W Suresh Nair S Lee N Y. Anal. Methods202315(43): 5793.

[93]
Yu H Wang M Cao J She Y X Zhu Y A Ye J M Abd El-Aty A M Hacımüftüoğlu A Wang J Lao S B. Food Chem.2021, 364: 130326.

[94]
Zhang K H Luo M Y Rao H H Liu H L Qiang R B Xue X Li J Y Lu X Q Xue Z H. Chem. Commun.202460(20): 2808.

[95]
Su J Zhou W J Xiang Y Yuan R Chai Y Q. Chem. Commun.201349(69): 7659.

[96]
Wai J L New S Y. RSC Adv.202010(2): 1088.

[97]
Zheng H R Li Y Xu J Y Bie J X Liu X Guo J J Luo Y L Shen F Sun C Y Yu Y L. J. Nanosci. Nanotechnol.201717(2): 853.

[98]
Soni G K Wangoo N Sharma R K. Microchem. J.2024, 199: 109906.

[99]
Liu J W Lu Y. Angew. Chem. Int. Ed.200645(1): 90.

[100]
Liu J Lu Y. Adv. Mater.200618(13): 1667.

[101]
Kanaras A G Wang Z X Bates A D Cosstick R Brust M. Angew. Chem. Int. Ed.200342(2): 191.

[102]
Wei H Li B L Li J Dong S J Wang E K. Nanotechnology200819(9): 095501.

[103]
Wang Z D Lee J H Lu Y. Adv. Mater.200820(17): 3263.

[104]
Memon A G Zhou X H Xing Y P Wang R Y Liu L H Khan M He M. Front. Environ. Sci. Eng.2019, 13: 12.

[105]
Huang Z J Chen J M Luo Z W Wang X Q Duan Y X. Anal. Chem.201991(7): 4806.

[106]
Diao W H Wang G Q Wang L Y Zhang L Ding S S Takarada T Maeda M Liang X G. ACS Appl. Bio Mater.20203(10): 7003.

[107]
Li L Zhang L P Lou T H Chen Z B. Sens. Actuat. B Chem.2017, 252: 663.

[108]
Xi H Y Liu Q Y Chen Z B. Microchim. Acta2018185(2): 88.

[109]
Sun Y F Peng M J Wu A G Zhang Y J. Chem. Commun.202359(81): 12180.

[110]
Li H J Zheng G G Xu L H Su W. Optik2014125(9): 2044.

[111]
Kim F Song J H Yang P D. J. Am. Chem. Soc.2002124(48): 14316.

[112]
Wang Y W Zhou X J Liu Q Jin Y Xu C L Li B X. Gold Bull.202053(3/4): 159.

[113]
Wang L B Zhu Y Y Xu L G Chen W Kuang H Liu L Q Agarwal A Xu C L Kotov N. Angew. Chem. Int. Ed.201049(32): 5472.

[114]
Zhu Y Y Qu C L Kuang H Xu L G Liu L Q Hua Y F Wang L B Xu C L. Biosens. Bioelectron.201126(11): 4387.

[115]
Wang G Q Akiyama Y Kanayama N Takarada T Maeda M. Small201713(44): 1702137.

[116]
Zhang L Zhao C L Zhang Y Wang L Y Wang G Q Kanayama N Takarada T Maeda M Liang X G. Langmuir201935(36): 11710.

[117]
Sudeep P K Shibu Joseph S T Thomas K G. J. Am. Chem. Soc.2005127(18): 6516.

[118]
Liu J M Wang H F Yan X P. Anal.2011136(19): 3904.

[119]
Lu L L Xia Y S. Anal. Chem.201587(16): 8584.

[120]
Selvakannan P R Dumas E Dumur F Péchoux C Beaunier P Etcheberry A Sécheresse F Remita H Mayer C R. J. Colloid Interface Sci.2010349(1): 93.

[121]
Wang Y Li Y F Wang J Sang Y Huang C Z. Chem. Commun.201046(8): 1332.

[122]
Placido T Aragay G Pons J Comparelli R Curri M L Merkoçi A. ACS Appl. Mater. Interfaces20135(3): 1084.

[123]
Chen L Lu L L Wang S F Xia Y S. ACS Sens.20172(6): 781.

[124]
Wang J Zhang P Li J Y Chen L Q Huang C Z Li Y F. Anal.2010135(11): 2826.

[125]
Ge K Liu J M Fang G Z Wang P H Zhang D D Wang S. Sensors201818(7): 2372.

[126]
Cai H H Lin D W Wang J H Yang P H Cai J Y. Sens. Actuat. B Chem.2014, 196: 252.

[127]
Lu M M Su L J Luo Y H Ma X H Duan Z H Zhu D J Xiong Y H. Anal. Methods201911(37): 4829.

[128]
Zhao Y Gui L L Chen Z B. Sens. Actuat. B Chem.2017, 241: 262.

[129]
Kumar V V Anthony S P. Anal. Chim. Acta2014, 842: 57.

[130]
Basiri S Mehdini A Jabbari A. Spectrochim. Acta A Mol. Biomol. Spectrosc.2017, 171: 297.

[131]
Amirjani A Fatmehsari D H. Talanta2018, 176: 242.

[132]
Ma X M He S Qiu B Luo F Guo L H Lin Z Y. ACS Sens.20194(4): 782.

[133]
Zhang Z Y Wang H Chen Z P Wang X Y Choo J Chen L X. Biosens. Bioelectron.2018, 114: 52.

[134]
Shan G Y Zheng S J Chen S P Chen Y W Liu Y C. Colloids Surf. B Biointerfaces2013, 102: 327.

[135]
Zhang Z Y Chen Z P Cheng F B Zhang Y W Chen L X. Biosens. Bioelectron.2016, 89: 932.

[136]
Xiong Y Pei K Wu Y Q Duan H Lai W H Xiong Y H. Sens. Actuat. B Chem.2018, 267: 320.

[137]
Liu Y Lv B J Liu A R Liang G Y Yin L H Pu Y P Wei W Gou S H Liu S Q. Sens. Actuat. B Chem.2018, 265: 675.

[138]
Weng G J Zhao X J Zhao J Li J J Zhu J Zhao J W. Sens. Actuat. B Chem.2019, 299: 126982.

[139]
Liu J M Wang X X Li J Cui M L Lin L P Zhang L H Jiang S L. Talanta2013, 116: 199.

[140]
Zhang Z Y Chen Z P Pan D W Chen L X. Langmuir201531(1): 643.

[141]
Lu S M Zhang X Chen L Yang P. Sens. Actuat. B Chem.2018, 259: 1066.

[142]
Ma X M Zhang H Liu J Zhang H F Hu X Wang Y Li X Xu J G. Sens. Actuat. B Chem.2023, 397: 134658.

[143]
Zhang X Yang Q Lang Y H Jiang X Wu P. Anal. Chem.202092(18): 12400.

[144]
Zhu C X Yang H Cao X W Hong Q Xu Y Wang K Y Shen Y F Liu S Q Zhang Y J. Anal. Chem.202395(44): 16407.

[145]
Zhang J N Chen H Y Liu J Gui J L Liu M L Zhang Y Y Yao S Z. Talanta2023, 258: 124458.

[146]
Zhou J Tian F Y Fu R J Yang Y J Jiao B N He Y. ACS Appl. Nano Mater.20203(9): 9016.

[147]
Jiang C L Lai X D Han F Gao Z J Yang H X Zhao X Pang H J Qiao B Pei H Wu Q. RSC Adv.202313(16): 10503.

[148]
Yin X L Liu Y Q Gu H W Zhang Q Zhang Z W Li H Li P W Zhou Y. Microchem. J.2021, 168: 106411.

[149]
Zhou H Y Peng L J Tian T Zhang W Y Chen G Y Zhang H Yang F Q. Microchim. Acta2022189(11): 420.

[150]
Luo Q Lin Y S Cai Q H Luo F Lin C Y Wang J Qiu B Lin Z Y. Anal.2022147(12): 2749.

[151]
Wu R F Li K Shen C Y Huang J Gao Z Y Tang K R Leng Y M Chen Z B. ACS Appl. Nano Mater.20214(8): 8482.

[152]
Chen Z H Chen C Q Huang H W Luo F Guo L H Zhang L Lin Z Y Chen G N. Anal. Chem.201890(10): 6222.

[153]
Zhang Z Y Chen Z P Qu C L Chen L X. Langmuir201430(12): 3625.

[154]
Chen Z P Zhang Z Y Qu C L Pan D W Chen L X. Anal.2012137(22): 5197.

[155]
Li F M Liu J M Wang X X Lin L P Cai W L Lin X Zeng Y N Li Z M Lin S Q. Sens. Actuat. B Chem.2011155(2): 817.

[156]
Zhang Z Y Chen Z P Chen L X. Langmuir201531(33): 9253.

[157]
Zhang Z Y Chen Z P Cheng F B Zhang Y W Chen L X. Anal.2016141(10): 2955.

[158]
Liu J M Li J Cui M L Lin L P Wang X X Zheng Z Y Zhang L H Jiang S L. Sens. Actuators B Chem.2013, 188: 644.

[159]
Cheng X Huang Y Yuan C Dai K Jiang H Ma J M. Sens. Actuat. B Chem.2019, 282: 838.

[160]
Ding C P Li M Chen W W Chen Z K Guo Z H Ben B X Zhang X H Guo Z Y Huang Y J. Chem. Eng. J.2023, 476: 146689.

[161]
Li J Wei Y Y Liu X P Xu Z R. Sens. Actuat. B Chem.2022, 353: 131139.

[162]
Niu X F Xu D Yang Y H He Y. Anal.2014139(11): 2691.

[163]
Wang S Y Lin Q L Filbrun S L Zhou R J An Q X Yin Y Q Xu W Z Xu D Liu C. Sens. Actuat. B Chem.2021, 328: 129073.

[164]
Rex M Hernandez F E Campiglia A D. Anal. Chem.200678(2): 445.

[165]
Chen Y Y Chang H T Shiang Y C Hung Y L Chiang C K Huang C C. Anal. Chem.200981(22): 9433.

[166]
Lan Y J Lin Y W. Anal. Methods20146(18): 7234.

[167]
Park E J Ha T H. Sensors202424(2): 497.

[168]
Xu S H Jiang L P Liu Y Y Liu P P Wang W Luo X L. Anal. Chim. Acta2019, 1071: 53.

[169]
He Z Zhu J Weng G J Li J J Zhao J W. Nanotechnology202031(33): 335505.

[170]
Luo Q Tian M J Luo F Zhao M Lin C Y Qiu B Wang J Lin Z Y. Anal. Chem.202395(4): 2390.

[171]
Aherne D Ledwith D M Gara M Kelly J M. Adv. Funct. Mater.200818(14): 2005.

[172]
Chen Z B Zhang C M Wu Q Li K Tan L L. Sens. Actuat. B Chem.2015, 220: 314.

[173]
Li Y X Chen M Lu H Z Xu S F. J. Lumin.2024, 275: 120755.

[174]
Wu D Lu H F Xie H Wu J Wang C M Zhang Q L. Sens. Actuat. B Chem.2015, 221: 1433.

[175]
Xia Y S Ye J J Tan K H Wang J J Yang G. Anal. Chem.201385(13): 6241.

[176]
Yoon S J Nam Y S Lee H J Lee Y Lee K B. Sens. Actuat. B Chem.2019, 300: 127045.

[177]
Liang J J Yao C Z Li X Q Wu Z Huang C H Fu Q Q Lan C F Cao D L Tang Y. Biosens. Bioelectron.2015, 69: 128.

[178]
Yang X J Yu Y B Gao Z Q. ACS Nano20148(5): 4902.

[179]
Tan K H Yang G Chen H D Shen P F Huang Y C Xia Y S. Biosens. Bioelectron.2014, 59: 227.

[180]
An J Tang B Zheng X L Zhou J Dong F X Xu S P Wang Y Zhao B Xu W Q. J. Phys. Chem. C2008112(39): 15176.

[181]
Tsai C M Hsu M S Chen J C Huang C-L. J. Phys. Chem. C2012116(1): 461.

[182]
Chen S Tang J Kuang Y F Fu L L Ma F F Yang Y Y Chen G F Long Y F. Sens. Actuat. B Chem.2015, 221: 1182.

[183]
Zhang P Wang L Zeng J Tan J Long Y F Wang Y. Microchim. Acta2020187(2): 107.

[184]
Zhang C H Jiang X K Yu F H Liu Y Yue Q Yang P Liu Y C. Sens. Actuat. B Chem.2021, 344: 130304.

[185]
Zandi A Amjadi M Hallaj T. Food Chem.2022, 369: 130967.

[186]
He M Q Ai Y J Hu W T Jia X M Wu L Ding M Y Liang Q L. Anal. Chem.202395(14): 6130.

[187]
Chen S Y Zheng Y Gong J Y Mo S H Ren Y C Xu J R Lu M S. Int. J. Biol. Macromol.2024, 260: 129626.

[188]
Zhang M Shi X Y Zhang G P Xu C L Li B X. Spectrochim. Acta Part A Mol. Biomol. Spectrosc.2024, 309: 123874.

[189]
Magdy G Aboelkassim E Abd Elhaleem S M Belal F. Microchem. J.2024, 196: 109615.

[190]
Pellas V Hu D Mazouzi Y Mimoun Y Blanchard J Guibert C Salmain M Boujday S. Biosensors202010(10): 146.

[191]
Xue Y X Ma X Y Feng X Roberts S Zhu G Y Huang Y Fan X F Fan J Chen X F. ACS Appl. Nano Mater.20236(13): 11572.

[192]
Yu C D Huang Z Q Ping T Su H Yang Q L Wu W. LWT2023, 184: 115007.

[193]
Zhong Y Yu X Y Fu W Y Chen Y W Shan G Y Liu Y C. Microchim Acta.2019, 186: 802.

[194]
Zhang X H Wei M Lv B J Liu Y J Liu X Wei W. RSC Adv.20166(41): 35001.

[195]
Zeng J B Cao Y Y Chen J J Wang X D Yu J F Yu B B Yan Z F Chen X. Nanoscale20146(17): 9939.

[196]
Li Y R Wang Q R Zhou X M Wen C Y Yu J F Han X G Li X Y Yan Z F Zeng J B. Sens. Actuat. B Chem.2016, 228: 366.

[197]
Lu M J Fu X J Xie H H Liu M Wei P Zhang W D Xie Y H Qi Y. J. Food Compos. Anal.2023, 120: 105363.

[198]
Qi Y Zhao J Weng G J Li J J Zhu J Zhao J W. Sens. Actuat. B Chem.2018, 267: 181.

[199]
Liu S S Wang X F Zou C Y Zhou J Yang M Zhang S Y Huo D Q Hou C J. Anal. Chim. Acta2021, 1149: 238141.

[200]
Weng G J Shen X Li J J Wang J Y Zhu J Zhao J W. Anal. Chim. Acta2022, 1221: 340129.

[201]
Yang R Song D Wang C W Zhu A N Xiao R Liu J Q Long F. RSC Adv.20155(124): 102542.

[202]
Zhu J Zhao B Z Qi Y Li J J Li X Zhao J W. Sens. Actuat. B Chem.2018, 255: 2927.

[203]
Zeng J B Cao Y Y Lu C H Wang X D Wang Q R Wen C Y Qu J B Yuan C G Yan Z F Chen X. Anal. Chim. Acta2015, 891: 269.

[204]
Qi Y Zhu J Li J J Zhao J W. Sens. Actuat. B Chem.2017, 253: 612.

[205]
Wang X K Chen L Chen L X. Microchim. Acta2014181(1/2): 105.

[206]
Liang X Y Du X Liu A Cai Z X Li J W Zhang M S Wang Q X Zeng J B. Chin. Chem. Lett.202334(3): 107491.

[207]
Cao J F Ouyang M Xu C Li H C Chen Z H Chen L Xu D. Sens. Actuat. B Chem.2024, 410: 135635.

[208]
Radhakumary C Sreenivasan K. Anal.2012137(22): 5387.

[209]
Hajizadeh S Farhadi K Forough M Sabzi R E. Anal. Methods20113(11): 2599.

[210]
Aliakbarpour S Amjadi M Hallaj T. Food Chem.2024, 432: 137273.

[211]
Xiang Y J Wu X C Liu D F Li Z Y Chu W G Feng L L Zhang K Zhou W Y Xie S S. Langmuir200824(7): 3465.

[212]
Wang G Q Chen Z P Chen L X. Nanoscale20113(4): 1756.

[213]
Fu H J Luo L Wang Y Wang C L Wang H Shen Y D Lei H T Hildebrandt N Xu Z L. ACS Appl. Nano Mater.20225(9): 12915.

[214]
Wu C L Xu Q H. Langmuir200925(16): 9441.

[215]
Wang C Ma Z Wang T Su Z. Adv. Funct. Mater.200616(13): 1673.

[216]
Pellas V Sallem F Blanchard J Miche A Concheso S M Méthivier C Salmain M Boujday S. Talanta2023, 255: 124245.

[217]
Pellas V Blanchard J Guibert C Krafft J M Miche A Salmain M Boujday S. ACS Appl. Nano Mater.20214(9): 9842.

[218]
Xu S H Ouyang W J Xie P S Lin Y Qiu B Lin Z Y Chen G N Guo L H. Anal. Chem.201789(3): 1617.

[219]
Zhang Q T Yu Y Y Yun X J Luo B Jiang H R Chen C Z Wang S F Min D Y. ACS Appl. Nano Mater.20203(6): 5212.

[220]
Orouji A Ghasemi F Hormozi-Nezhad M R. Anal. Chem.202395(26): 10110.

[221]
Guo Y H Wu J Li J Ju H X. Biosens. Bioelectron.2016, 78: 267.

[222]
Lin T R Wu Y R Li Z H Song Z P Guo L Q Fu F F. Anal. Chem.201688(22): 11022.

[223]
Xianyu Y L Sun J S Li Y X Tian Y Wang Z Jiang X Y. Nanoscale20135(14): 6303.

[224]
Duan W Liu A Li Q Li Z W Wen C Y Cai Z X Tang S M Li X Y Zeng J B. Anal.2019144(15): 4582.

[225]
Hu H Xia J Ding N S Xiong Y H Xing K Y Fang B L Huo X Lai W H. J. Hazard. Mater.2022, 431: 128498.

[226]
Wang Z W Li X T Zhang F Gao Y Cheng J T Fu F F. Anal. Chem.202395(27): 10438.

[227]
Wang Z W Chen Q Zhong Y Y Yu X H Wu Y N Fu F F. Anal. Chem.202092(1): 1534.

[228]
Liang D W Wang Y W Ma L R Liu Y L Fu R J Liu H R Peng Y L Zhang Y H Wang C Q Jiao B N He Y. ACS Appl. Nano Mater.20225(11): 16978.

[229]
Li B Y Li X Z Dong Y H Wang B Li D Y Shi Y M Wu Y Y. Anal. Chem.201789(20): 10639.

[230]
Zhao T Liang X C Guo X J Yang X J Guo J L Zhou X Huang X Q Zhang W Q Wang Y Q Liu Z W Jiang Z J Zhou H K Zhou H B. Food Chem.2023, 404: 134768.

[231]
Keshavarzi P Abbasi-Moayed S Khodabakhsh M Unal U Hormozi-Nezhad M R. Talanta2023, 259: 124528.

[232]
Zhou Y Huang W He Y. Sens. Actuat. B Chem.2018, 270: 187.

[233]
Wenck C Leopoldt D Habib M Hegermann J Stiesch M Doll-Nikutta K Heisterkamp A Torres-Mapa M L. Nanoscale Adv.20246(5): 1447.

[234]
Verma M S Chen P Z Jones L X Gu F X. Biosens. Bioelectron.2014, 61: 386.

[235]
Abbasi-Moayed S Orouji A Hormozi-Nezhad M R. Biosensors202313(8): 803.

Options
Outlines

/