
Surface-Enhanced Raman Scattering for Metastasis Detection and Treatment Evaluation in Breast Cancer
Received date: 2025-05-12
Revised date: 2025-06-11
Online published: 2025-10-25
Supported by
Hainan Province Science and Technology Special Fund(ZDYF2024SHFZ104)
National Natural Science Foundation of China(22564013)
National Natural Science Foundation of China(22264013)
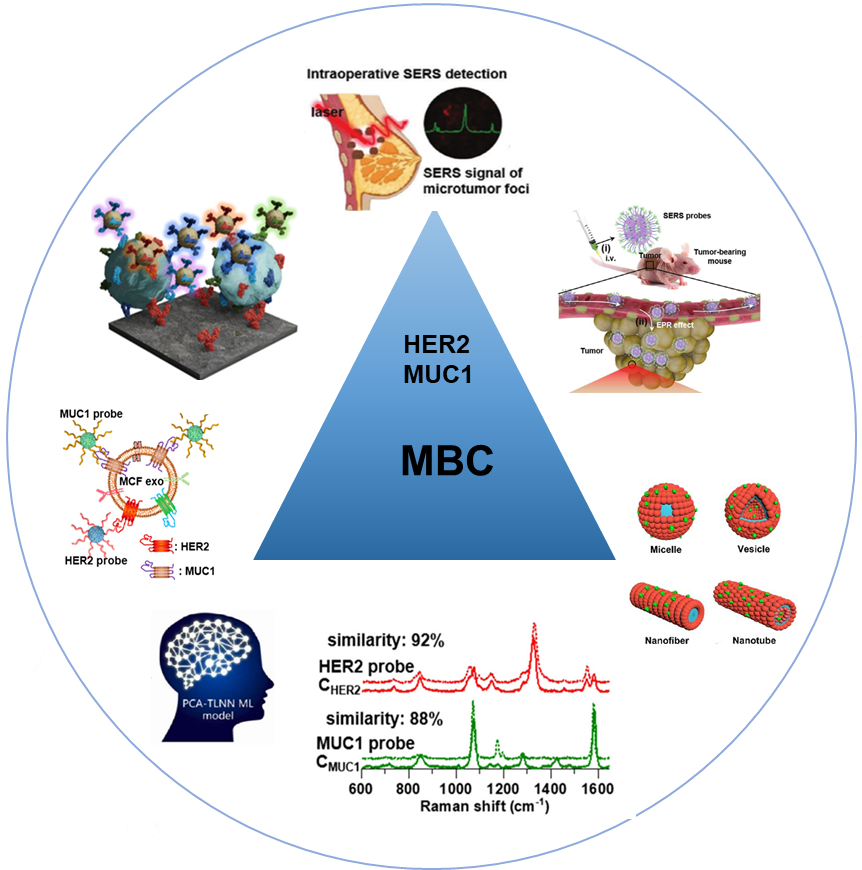
Breast cancer remains one of the most prevalent malignancies and the second leading cause of cancer-related mortality among women worldwide. Metastasis represents the critical determinant of poor prognosis in breast cancer patients. Conventional detection methods face limitations, including insufficient sensitivity, invasiveness, and inability to dynamically monitor tumor microenvironment alterations, thereby failing to meet the demands of precision medicine. In recent years, surface-enhanced Raman spectroscopy (SERS) has emerged as a powerful tool for breast cancer metastasis monitoring and treatment evaluation, owing to its ultra-high sensitivity at the single-molecule level, exceptional spatiotemporal resolution, and multiplex detection capability. Functionalized SERS probes targeting tumor-specific biomarkers enable non-invasive identification of circulating tumor cells (CTCs), exosomes(Exos), and metastasis-associated metabolites, facilitating molecular-level diagnosis of breast cancer metastasis. Furthermore, SERS technology permits real-time monitoring of drug delivery efficiency, release kinetics, and therapeutic responses at tumor sites, providing dynamic molecular profiles for personalized treatment evaluation. This review systematically summarizes recent advancements in SERS-based detection of metastasis-related biomarkers, tumor microenvironment analysis, and treatment efficacy assessment. Key challenges, including probe targeting optimization, signal stability enhancement, and clinical translation, are critically discussed. Looking forward, the integration of multimodal SERS probe design with artificial intelligence-powered data analytics is anticipated to propel breast cancer management into a new era of precision medicine and visualization-guided therapeutics.
Contents
1 Introduction
2 SERS overview and probe design
2.1 Overview of SERS
2.2 Technical advantages of SERS
2.3 Principles of SERS probe design
3 Detection and treatment evaluation of breast cancer metastasis based on SERS
3.1 Detection of metastatic markers in liquid
3.2 Imaging of metastatic lesions
4 Evaluation of therapeutic efficacy
5 Conclusion and outlook
Sisi Wang , Jierong Xiao , Fabiao Yu , Rui Wang , Guisheng He . Surface-Enhanced Raman Scattering for Metastasis Detection and Treatment Evaluation in Breast Cancer[J]. Progress in Chemistry, 2025 , 37(11) : 1631 -1651 . DOI: 10.7536/PC20250506
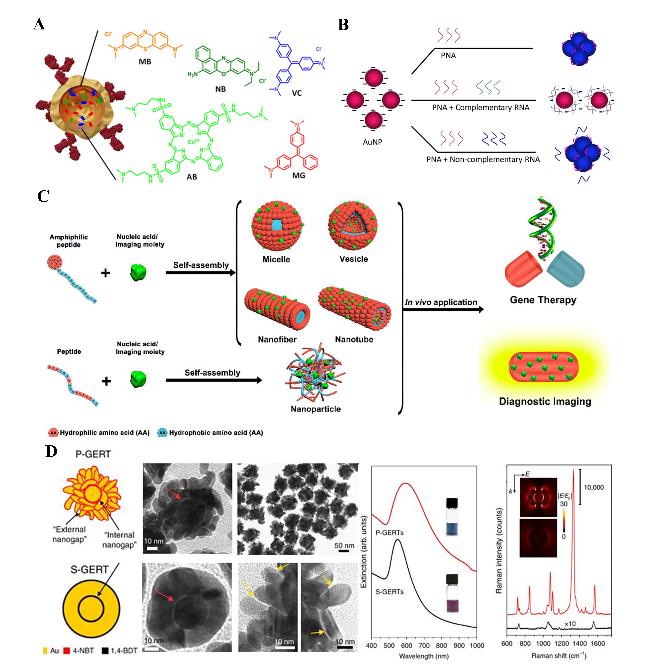
图1 (A)SERS中常规拉曼、局域表面等离子体共振(LSPR)和电磁增强机制的示意图;(B) 无标记SERS检测原理:吸附介导的无标记SERS检测和抗体/配体介导的无标记SERS检测;(C) 典型SERS探针的制备流程Fig.1 (A) Schematics of normal Raman, localized surface plasmon resonance (LSPR), and electromagnetic enhancement mechanism in SERS, including the two-step enhancement; (B) principles of label-free SERS detections: adsorption-mediated label-free SERS detection and antibody/ligand-mediated label-free SERS detection; (C) general procedure for the fabrication of a typical SERS probe |
图2 SERS探针结合基底和拉曼报告分子: (A) 拉曼报告分子;(B) 使用AuNP比色检测分析的RNA检测方法;(C) 肽和氨基酸如何使金纳米颗粒功能化;(D) 金纳米粒子的能隙增强Fig.2 SERS probes incorporating both substrate and Raman reporter molecules. (A) Raman reporter molecule; (B) RNA detection method using AuNP colorimetric detection assay; (C) how peptides and amino acids functionalize gold nanoparticles; (D) gap enhancement on gold nanoparticles |
表1 不同SERS探针检测性能对比Table 1 Comparison of detection performance of different SERS probes |
| Detection Targets | SERS Probes | Linear range | Limits of Detection (LODs) | Ref |
|---|---|---|---|---|
| CTCs | Gold nanoprobe targeting mesenchymal transition markers (EpCAM, E-cadherin, N-cadherin, ABCB5) | 10~104 cells/mL | EpCAM/E-cadherin (6/1 MCF7 cells/mL) N-cadherin/ABCB5 (3/105 MDA-MB-231 cells/mL) | 83 |
| Serum EXOs (HER2 and MUC1) | Au nanostars conjugated with DTNB-HER2 aptamer/4-MBA-MUC1 aptamer | 107~1011 particles/mL | 3.2×10⁶particles/mL for SKBR EXOs and 4.80×10⁶ particles/mL for MCF EXOs | 90 |
| Human breast cancer-associated miRNAs (let-7b, miRNA-1, 10b, 125b, 126, 133a, 143, 155 and 21 | 3D SERS holography chip | 10-8~10-18 mol/L | 1 amol/L | 103 |
| Luciferase-labeled 4T1 tumor cells | N3-labeled macrophage membrane-encapsulated SERS probes | NA | NA | 114 |
| CD47 | CD47-specific gold nanoprobes | 0.01~1 μg/mL | 0.005 μg/mL | 121 |
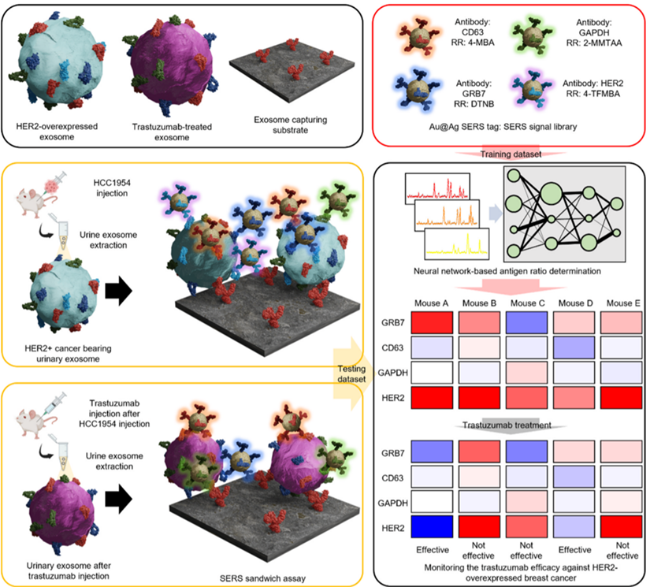
| GRB-7, CD63, GAPDH, and HER2 | Au@Ag core-shell nanoprobe | NA | NA | 128 |
| HER2 | AuSt@SiO2 core-shell nanoprobe conjugated with HER2 specific aptamer | 0~100 μg/mL | 0.46 μg/mL | 130 |
NA: not available |
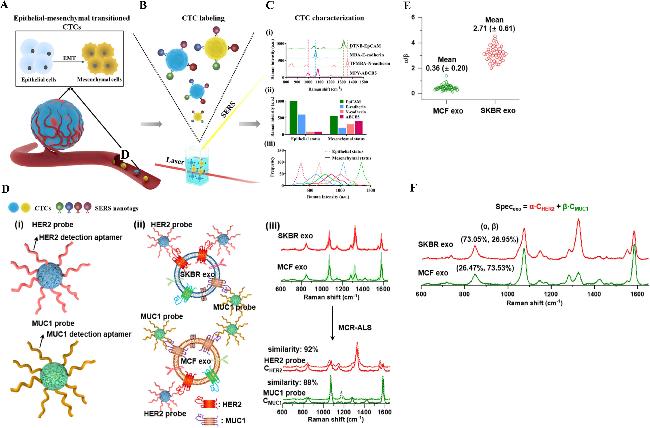
图3 通过表征循环肿瘤细胞表型及其异质性的动态演变追踪上皮-间充质转化过程,其中SERS光谱信号分布曲线的展宽程度与异质性水平呈正相关,同时该技术也可用于单个外泌体的SERS光谱构建:(A) 上皮-间质转化(EMT)过程同时发生于肿瘤原发灶和循环系统,当肿瘤细胞/循环肿瘤细胞(CTCs)暴露于TGF-β等EMT诱导因子时,会导致细胞表型和形态发生从上皮型向间质型的转变;(B) 通过功能化SERS纳米标签标记CTCs后,在激光激发下进行检测;(C) (i) 功能化SERS纳米标签的特征峰分别位于:DTNB (1338 cm⁻¹)、MBA (1080 cm⁻¹)、TFMBA (1379 cm⁻¹)和MPY (1000 cm⁻¹);(ii) 标志物特异性SERS纳米标签的特征峰强度可显示CTCs在上皮状态和间质状态下的EMT相关表型;(iii) 信号分布曲线反映了CTCs在上皮和间质状态下的表型异质性;(D) (i) HER2和MUC1探针的结构示意图;(ii) 探针与外泌体表面HER2和MUC1的特异性结合;(iii) 通过多元曲线分辨-交替最小二乘法(MCR-ALS)将SKBR和MCF细胞来源外泌体的复杂SERS光谱解析为两个组分光谱(CHER2和CMUC1),它们分别与HER2和MUC1探针的SERS光谱高度相似; (E) 经MCR-ALS解析得到的相对SERS强度比(α/β)在SKBR外泌体(n=50)和MCF外泌体(n=50)中的分布情况;(F) 单个SKBR和MCF外泌体的复合SERS光谱(Specexo)可通过两个结合探针SERS光谱的加权求和构建:Specexo = α·CHER2 + β·CMUC1,其中α和β分别代表相应外泌体中HER2和MUC1蛋白标志物的权重(丰度)Fig.3 Tracking the epithelial-mesenchymal transition (EMT) process by characterizing the dynamic evolution of circulating tumor cell (CTC) phenotypes and heterogeneity, where the broadening of SERS spectral distribution curves positively correlates with heterogeneity levels, while this technique can also be applied to construct SERS spectra of individual exosomes. (A) EMT process occurs in both tumor sites and circulation when tumor cells/CTCs are exposed to the EMT inducers (e.g., TGF-β), resulting in phenotypic and morphological changes from epithelial type to mesenchymal type. (B) CTCs are labeled with functionalized SERS nanotags and detected under laser excitation. (C) (i) Signals of functionalized SERS nanotags, showing the characteristic peaks at 1338, 1080, 1379, and 1000 cm-1 for DTNB, MBA, TFMBA, and MPY, respectively. (ii) Characteristic peak intensities of marker-specific SERS nanotag signals show EMT-associated phenotypes of CTCs at epithelial and mesenchymal status. (iii) Signal distribution curves reflect the phenotypic heterogeneity of CTCs at epithelial and mesenchymal status. (D) Schematic illustration of (i) the structures of the HER2 and MUC1 probes, (ii) their targeted binding onto exosomal HER2 and MUC1, and (iii) MCR-ALS spectral unmixing of the complex SERS spectra of SKBR and MCF exos into two component spectra (CHER2 and CMUC1) with high similarity to the SERS spectra of HER2 and MUC1 probes, respectively. (E) Relative SERS intensity (α/β) in SKBR exos (n = 50) and MCF exos (n = 50) from the MCR-ALS spectral unmixing, and (F) complex SERS spectra (Specexo) of the individual SKBR and MCF exos, constructed by the weighted sum of the SERS spectra of the two bound probes: Specexo = α·CHER2 + β·CMUC1, where α and β are the weights (abundances) of exosomal HER2 and MUC1 protein biomarkers in the corresponding exos, respectively |
图4 SERS和生物发光双模态成像结合生物标记实时追踪三阴性乳腺癌(TNBC)肿瘤转移示意图:(a) M-SERS 探针的制备;(b) 作用机理及其在肿瘤转移监测中的应用Fig.4 Schematic representation of bioorthogonal labelling for real-time tracking tumor metastasis in triple-negative breast cancer (TNBC) through SERS and bioluminescence imaging. (a) Preparation of M-SERS Probes. (b) Mechanism of action and application in tumor metastasis monitoring |
图5 乳腺癌组织和小鼠异种移植模型中正常相邻组织的拉曼成像:(A) 施用纳米粒子后的切除组织数字照片;(B) 组织样本的拉曼成像;(C) 拉曼成像与组织样本的叠加,注意乳腺癌组织中纳米粒子的结合增加,相较于正常相邻组织;(D) 定量比值分析特定CD47 SERS纳米粒子与非特异性同型IgG SERS纳米粒子在每个组织样本上的结合情况,注意癌症组织与正常相邻组织之间有显著差异,表示为*(P < 0.05);误差条表示标准误(SEM),拉曼图像右侧的颜色条表示拉曼强度,红色表示最高的拉曼信号,黑色表示没有相关的拉曼信号Fig.5 Raman imaging of breast cancer tissues and normal adjacent tissue harvested from mouse xenograft. (A) Digital photo of excised tissue after NPs administration; (B) Raman imaging of tissue samples; (C) overlay of Raman imaging with tissue sample, notice the increased NP binding in the breast cancer tissue as opposed to the normal adjacent tissue; (D) quantitative ratiometric analysis of specific CD47 SERS NP binding to non-specific Isotype IgG SERS NP binding on each of the tissue samples. Notice the significant differences represented by * (P < 0.05) between the cancer tissue and the normal adjacent tissues; error bars represent standard error of mean (SEM). Color bar to the right of Raman images represents Raman intensity, where red represents the highest Raman signal and black represents no associated Raman signal |
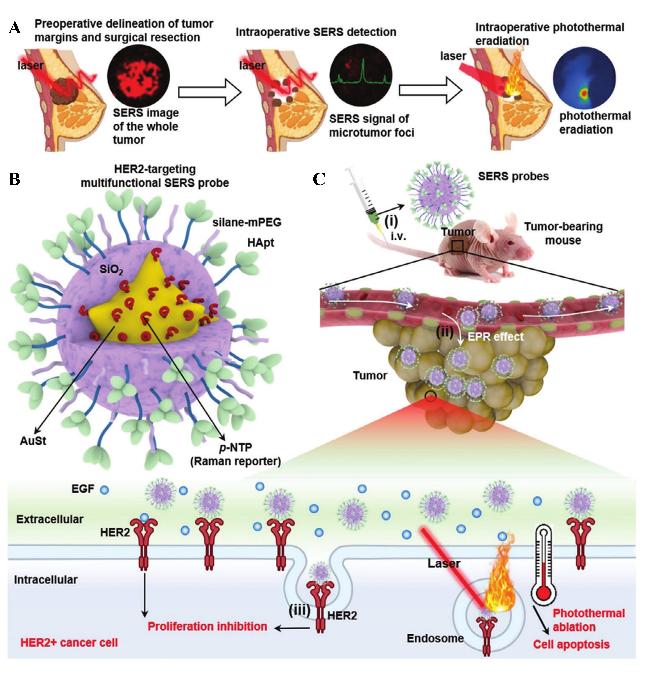
图7 表面增强拉曼散射成像引导的乳腺癌转移诊疗:(A) SERS成像引导手术流程图,包括术前肿瘤边缘勾画指导保乳手术、术中SERS检测以及实时光热消除手术床残留的微观肿瘤病灶三部分;(B) SERS探针结构示意图:以等离子金纳米星(AuSt)为核心,表面包裹对硝基苯硫酚(p-NTP)拉曼分子层,外层覆以二氧化硅壳层,最终通过HER2特异性适配体(HApt)实现靶向功能化;(C) SERS探针在HER2阳性乳腺癌荷瘤小鼠体内通过静脉给药后,借助增强渗透与滞留(EPR)效应及适配体HApt介导的主动靶向机制在肿瘤部位富集Fig.7 SERS imaging-guided breast cancer metastasis. (A) The workflow of SERS imaging-guided surgery, including preoperative tumor margin delineation to guide breast-conserving surgery, intraoperative SERS detection, and real-time photothermal elimination of microscopic tumor lesions in the surgical bed;(B) The structure of SERS probes, featuring a plasmonic AuSt core with a layer of p-NTP Raman molecules encapsulated within a silica shell. These probes are conjugated with HER2-specific aptamer (HApt) for targeting; (C) SERS probes accumulate in the tumor after intravenous administration in a HER2+ breast tumor-bearing mouse through the enhanced permeability and retention (EPR) effect and HApt-based active targeting mechanism |
图8 人工智能在SERS流程中的整合:优化流程与拓展应用:(A) 在整个SERS流程中,人工智能可用于SERS基底、报告分子及其合成路线的设计,仪器优化和数据预处理方法的改进,以及SERS相关应用的推动;(B) 人工智能辅助的SERS应用方面;(C) 定性分析用于确认未知样品中是否存在特定分子物种[134];(D) PCA-TLNN促进靶标识别Fig.8 Integration of AI into the SERS Pipeline: Advancing Workflow and Expanding Applications. (A) Along the whole SERS pipeline, AI can be used in the design of SERS substrates, the reporter molecules and the synthetic routes, the optimization of instrumentations and data preprocessing methods, as well as SERS related applications; (B) aspects of AI assisted SERS applications;(C) qualification ascertains the existence of certain molecular species in an unknown sample. Reproduced with permission [134]. Copyright 2023, Elsevier;(D) PCA-TLNN facilitated target identification |
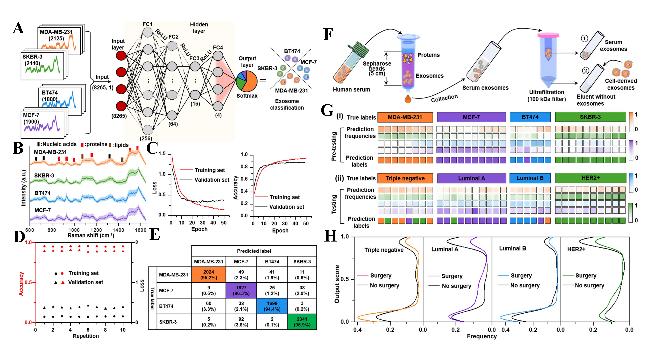
图9 基于SERS特征构建的深度学习辅助ANN模型,用于乳腺癌分类及血清外泌体预测:(A) ANN模型结构图,包括一个输入层、四个全连接的隐藏层和一个输出层,最终输出为四个介于0到1之间的数值,分别对应四种细胞来源外泌体的预测概率。输入层共引入8265组细胞来源外泌体的SERS光谱数据,分别为MDA-MB-231(2125条)、MCF-7(1900条)、BT474(1800条)和SKBR-3(2440条);(B) 分别来源于MDA-MB-231、MCF-7、BT474和SKBR-3细胞的外泌体SERS光谱图(阴影部分表示标准差);(C) 训练集和验证集的交叉熵损失函数和准确率变化曲线;(D) 经过10次重复训练后所得训练集和验证集的最终准确率与交叉熵损失值;(E) 基于合并的细胞来源外泌体SERS数据集,对MDA-MB-231、MCF-7、BT474和SKBR-3的预测结果混淆矩阵;(F) 从患者血清中分离纯化外泌体的示意图,该过程结合了尺寸排阻色谱法和超滤技术;(G) 经过训练的ANN模型对(i)预测试数据集和(ii)测试数据集的预测得分。预测试数据集来自于各类细胞外泌体加入其对应患者血清外泌体洗脱液后的光谱数据,测试数据集来自实际分离的患者血清外泌体光谱数据。图中颜色条表示预测频率的取值范围(0到1);(H) 不同乳腺癌亚型患者在有无手术干预情况下,血清外泌体SERS光谱的输出评分频率曲线图Fig.9 Development of a deep learning-assisted ANN model for breast cancer classification and serum exosome prediction using SERS features. (A) Architecture of the ANN model consisting of an input layer, four fully connected hidden layers and an output layer, yielding a final output of four numerical values between 0 and 1, that is, the prediction probability that corresponds to each type of cell-derived exosomes. A total of 8265 SERS spectra of cell-derived exosomes consisting of 2125 for MDA-MB-231, 1900 for MCF-7, 1800 for BT474 and 2440 for SKBR-3 are introduced into the input layer;(B) SERS spectra of exosomes derived from MDA-MB-231, MCF-7, BT474 and SKBR-3 cells, respectively (the shadow represents1 s.d.);(C) cross-entropy loss and accuracy of the training and validation sets;(D) final accuracy and cross-entropy loss of training and validation sets with ten repeating trainings;(E) confusion matrices of prediction results for the combined SERS data set of MDA-MB-231, MCF-7, BT474 and SKBR-3 cell-derived exosomes;(F) schematic illustration of the isolation and purification of serum exosomes from patients’serum, performed by the combination of size-exclusion chromatography and ultrafiltration methods;(G) scores predicted by the trained ANN model using (i) the pretesting data set and (ii) the testing data set. The pretesting data set is from cellular exosomes in their respective eluents for the isolation of serum exosomes, whereas the testing data set is obtained from serum exosomes. The color bars represent scales assigned to prediction frequencies (0 to 1);(H) frequency curves of corresponding output scores of SERS spectra of serum exosomes from patients of different breast cancer subtypes with or without surgery |
| [1] |
|
| [2] |
|
| [3] |
|
| [4] |
|
| [5] |
|
| [6] |
|
| [7] |
|
| [8] |
|
| [9] |
|
| [10] |
|
| [11] |
|
| [12] |
|
| [13] |
|
| [14] |
|
| [15] |
|
| [16] |
|
| [17] |
|
| [18] |
|
| [19] |
|
| [20] |
|
| [21] |
|
| [22] |
|
| [23] |
|
| [24] |
|
| [25] |
|
| [26] |
|
| [27] |
|
| [28] |
|
| [29] |
|
| [30] |
|
| [31] |
|
| [32] |
|
| [33] |
|
| [34] |
|
| [35] |
|
| [36] |
|
| [37] |
|
| [38] |
|
| [39] |
|
| [40] |
|
| [41] |
|
| [42] |
|
| [43] |
|
| [44] |
|
| [45] |
|
| [46] |
|
| [47] |
|
| [48] |
|
| [49] |
|
| [50] |
|
| [51] |
|
| [52] |
|
| [53] |
|
| [54] |
|
| [55] |
|
| [56] |
|
| [57] |
|
| [58] |
|
| [59] |
|
| [60] |
|
| [61] |
|
| [62] |
|
| [63] |
|
| [64] |
|
| [65] |
|
| [66] |
|
| [67] |
|
| [68] |
|
| [69] |
|
| [70] |
|
| [71] |
|
| [72] |
|
| [73] |
|
| [74] |
|
| [75] |
|
| [76] |
|
| [77] |
|
| [78] |
|
| [79] |
|
| [80] |
|
| [81] |
|
| [82] |
|
| [83] |
|
| [84] |
|
| [85] |
|
| [86] |
|
| [87] |
|
| [88] |
|
| [89] |
|
| [90] |
|
| [91] |
|
| [92] |
|
| [93] |
|
| [94] |
|
| [95] |
|
| [96] |
|
| [97] |
|
| [98] |
|
| [99] |
|
| [100] |
|
| [101] |
|
| [102] |
|
| [103] |
|
| [104] |
|
| [105] |
|
| [106] |
|
| [107] |
|
| [108] |
|
| [109] |
|
| [110] |
|
| [111] |
|
| [112] |
|
| [113] |
|
| [114] |
|
| [115] |
|
| [116] |
|
| [117] |
|
| [118] |
|
| [119] |
|
| [120] |
|
| [121] |
|
| [122] |
|
| [123] |
|
| [124] |
|
| [125] |
|
| [126] |
|
| [127] |
|
| [128] |
|
| [129] |
|
| [130] |
|
| [131] |
|
| [132] |
|
| [133] |
|
| [134] |
|
| [135] |
|
| [136] |
|
| [137] |
|
| [138] |
|
| [139] |
|
| [140] |
|
| [141] |
|
| [142] |
|
/
| 〈 |
|
〉 |


