
2024 , Vol. 14 >Issue 4: 14 - 20
DOI: https://doi.org/10.11923/j.issn.2095-4050.cjas2023-0095
Yield Traits and Experimental Environment Evaluation of Sweet Potato Strains Based on GGE Model
Received date: 2023-03-22
Revised date: 2023-06-06
Online published: 2024-04-17
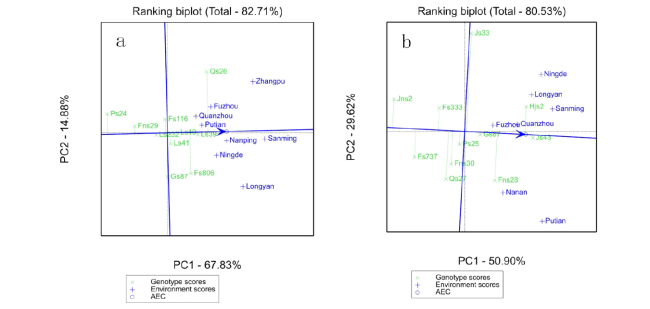
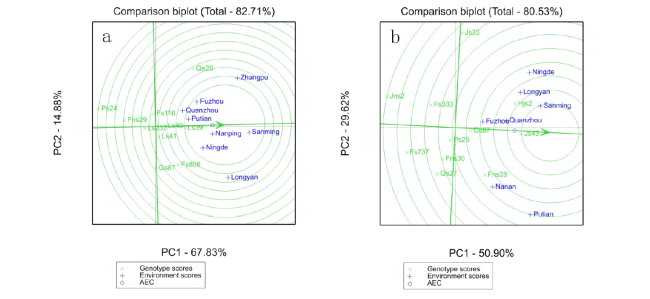
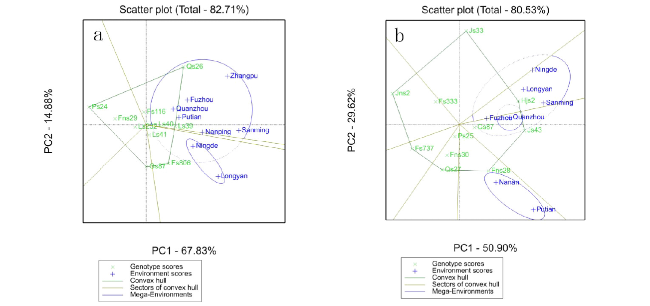
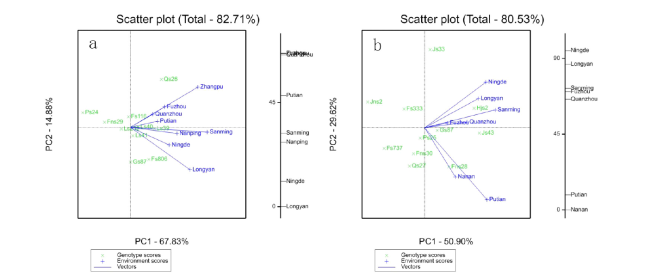
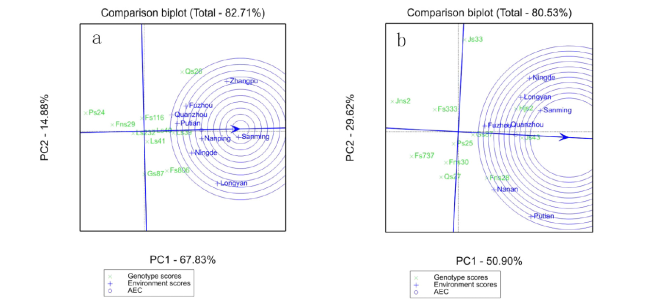
In order to comprehensively evaluate the genotype and the interaction of genotype and environment of sweet potato in regional test, the GGE biplot was used to analyze the fresh yield of group 2 of high-quality starch strains in regional test of sweet potato in Fujian from 2020 to 2021. The results showed that: ‘Quanshu 26’ had the best yield performance and had strong adaptability in Zhangpu, Fuzhou, Quanzhou, Putian, Sanming, and Nanping in 2020. ‘Longshu 39’ had high and stable yield, which was the ideal variety of the regional test. In 2021, ‘Jinshu 43’ had the best yield and stability, making it an ideal variety of the regional test. ‘Hongjinshu 2’ had high yield and strong regional adaptability in Ningde, Longyan, Sanming, and Fuzhou. In addition, the Sanming pilot had high discrimination and representativeness in the two-year regional test, and it was an ideal pilot environments. The GGE biplot can intuitively evaluate the yield characteristics of the test strains and the representativeness of the pilots, providing a simple and effective analytical method for objectively evaluating the high and stable yield of sweet potato strains.
Key words: sweet potato; GGE biplot; high yield; stable yield; adaptability; pilot discrimination
WANG Tengjiao , QIU Yongxiang , CUI Fuxi , NIU Doudou , LIU Jubo , LI Junling , ZHAO Weining , YANG Liming , LIN Guifen . Yield Traits and Experimental Environment Evaluation of Sweet Potato Strains Based on GGE Model[J]. Journal of Agriculture, 2024 , 14(4) : 14 -20 . DOI: 10.11923/j.issn.2095-4050.cjas2023-0095
表1 福建省甘薯区试优质淀粉2组参试品系基本情况 |
| 年份 | 序号 | 参试品系 | 产量均值*/kg | 增减比/% | 5% | 1% | 回归系数 |
|---|---|---|---|---|---|---|---|
| 2020 | 1 | 泉薯26(Qs26) | 56.7775 | 23.07 | a | A | 0.6796 |
| 2 | 龙薯39号(Ls39) | 53.2896 | 15.51 | b | AB | 1.2408 | |
| 3 | 福薯806(Fs806) | 51.265 | 11.12 | b | C | 1.3554 | |
| 4 | 龙薯40号(Ls40) | 47.9054 | 3.84 | c | CD | 1.0267 | |
| 5 | 广薯87(ck)(Gs87) | 46.1350 | - | cd | D | 0.3329 | |
| 6 | 龙薯41号(Ls41) | 45.8442 | -0.63 | cd | D | 1.4698 | |
| 7 | 福薯116(Fs116) | 44.8458 | -2.79 | cd | D | 0.8927 | |
| 8 | 龙薯232(Ls232) | 43.6563 | -5.37 | d | D | 0.9623 | |
| 9 | 福宁薯29号(Fns29) | 37.9508 | -17.74 | e | E | 0.9506 | |
| 10 | 莆薯24(Ps24) | 29.4104 | -36.25 | f | F | 1.0891 | |
| 2021 | 1 | 金薯43(Js43) | 45.8833 | 13.65 | a | A | 1.1703 |
| 2 | 红金薯2号(Hjs2) | 44.8743 | 11.15 | a | AB | 0.9215 | |
| 3 | 福宁薯28号(Fns28) | 42.1248 | 4.34 | b | BC | 1.297 | |
| 4 | 广薯87(ck)(Gs87) | 40.3710 | - | bc | CD | 1.0321 | |
| 5 | 莆薯25(Ps25) | 38.2695 | -5.21 | cd | DE | 0.9937 | |
| 6 | 金薯33(Js33) | 38.2229 | -5.32 | cd | DE | 0.3453 | |
| 7 | 福宁薯30号(Fns30) | 36.5824 | -9.38 | de | E | 1.2956 | |
| 8 | 泉薯27(Qs27) | 35.7119 | -11.54 | e | EF | 1.3234 | |
| 9 | 福薯333(Fs333) | 35.1462 | -12.94 | e | EF | 0.8558 | |
| 10 | 福薯737(Fs737) | 32.8024 | -18.75 | f | FG | 1.1214 | |
| 11 | 金农薯2号(Jns2) | 30.1362 | -25.35 | g | G | 0.6441 |
注:*试验点平均产量,小区面积13.32 m2。 |
表2 福建省甘薯区试优质淀粉2组方差分析 |
| 年份 | 变异来源 | 自由度 | 平方和 | 均方 | F值 | 占总变异比例 |
|---|---|---|---|---|---|---|
| 2020 | 地点(E) | 7 | 27837.4352 | 3976.7765 | 148.318 | 0.556 |
| 品种(G) | 9 | 13119.8847 | 1457.765 | 54.3689 | 0.262 | |
| 品种×地点(G×E) | 63 | 9123.6102 | 144.8192 | 5.4012 | 0.182 | |
| 2021 | 地点(E) | 6 | 22019.1022 | 3669.8504 | 284.0941 | 0.672 |
| 品种(G) | 10 | 4955.8679 | 495.5868 | 38.3649 | 0.151 | |
| 品种×地点(G×E) | 60 | 5783.2295 | 96.3872 | 7.4616 | 0.177 |
| [1] |
严威凯. 双标图分析在农作物品种多点试验中的应用[J]. 作物学报, 2010, 36(11):1805-1819.
|
| [2] |
金石桥, 许乃银. GGE双标图在中国农作物品种试验中应用的必要性探讨[J]. 种子, 2012, 31(12):89-92.
|
| [3] |
蒋彤晖, 叶夕苗, 余斌, 等. 甘肃省马铃薯区试品种产量性状和环境鉴别力评价分析[J]. 核农学报, 2022, 36(6):1262-1272.
|
| [4] |
曹元元, 丁逸帆, 左示敏, 等. 基于GGE双标图和AMMI模型对江苏省水稻区试品种的丰产性和稳定性分析[J]. 种子, 2021, 40(6):38-43,51.
|
| [5] |
严威凯. 品种选育与评价的原理和方法评述[J]. 作物学报, 2022, 48(9):2137-2154.
|
| [6] |
崔顺立, 何美敬, 侯名语, 等. 利用GGE双标图分析花生品质性状的基因型-环境互作[J]. 中国油料作物学报, 2021, 43(4):617-626.
|
| [7] |
王磊, 程本义, 鄂志国, 等. 基于GGE双标图的水稻区试品种丰产性、稳产性和适应性评价[J]. 中国水稻科学, 2015, 29(4):408-416.
|
| [8] |
孙宪印, 牟秋焕, 米勇, 等. 灌溉对14个小麦新品种(系)产量和农艺性状适应性的GGE分析[J]. 干旱地区农业研究, 2022, 40(5):24-31.
|
| [9] |
毛文博, 苏成付, 毛瑞喜, 等. 应用GGE双标图分析山东省玉米区域试验品种基因型与环境互作效应[J]. 山东农业科学, 2020, 52(12):7-13.
|
| [10] |
乔银桃. 基于GGE模型的西北内陆棉区品种生态区划分和试验环境评价[D]. 镇江: 江苏大学, 2022.
|
| [11] |
|
| [12] |
王育才, 王化俊, 李葆春, 等. 基于GGE双标图对青稞区试点代表性及品系稳定性的分析[J]. 草原与草坪, 2018, 38(5):22-27.
|
| [13] |
郭敏杰, 邓丽, 任丽, 等. 基于R语言的AMMI和GGE双标图在花生区试中的应用[J]. 花生学报, 2017, 46(2):24-31.
|
| [14] |
李宁. 基于R语言GGE双标图的辽宁地区薄皮甜瓜品种2年区域试验产量分析[J]. 中国瓜菜, 2023, 36(1):35-41.
|
| [15] |
周丙月, 袁剑龙, 张玉梅, 等. 马铃薯品种(系)农艺性状的适应性和稳定性分析[J]. 核农学报, 2023, 37(2):274-289.
|
| [16] |
戴习彬, 周志林, 李荣德, 等. 基于GGE双标图分析菜用甘薯登记品种的丰产稳产及适应性[J]. 江苏农业科学, 2022, 50(14):92-96.
|
| [17] |
戴习彬, 王远, 周志林, 等. 菜用甘薯产量稳定性及试验点鉴别力综合分析[J]. 江苏农业学报, 2023, 39(1):22-29.
|
| [18] |
张晓申, 杨育峰, 曹辉, 等. 采用GGE双标图评价甘薯郑红22的丰产稳产性和适应性[J]. 种子, 2023, 42(3):133-138.
|
| [19] |
许乃银, 李健. GGE双标图的信息比校正原理与应用——以长江流域棉花品种生态区划分为例[J]. 中国生态农业学报, 2015, 23(9):1169-1177.
|
| [20] |
许乃银, 张国伟, 李健, 等. 基于GGE双标图和比强度选择的棉花品种生态区划分[J]. 中国生态农业学报, 2012, 20(11):1500-1507.
|
| [21] |
|
/
| 〈 |
|
〉 |