
2024 , Vol. 14 >Issue 4: 83 - 92
DOI: https://doi.org/10.11923/j.issn.2095-4050.cjas2023-0134
Climate Change in Shiyang River Basin and Its Influence on Vegetation Index
Received date: 2023-05-31
Revised date: 2023-11-22
Online published: 2024-04-17
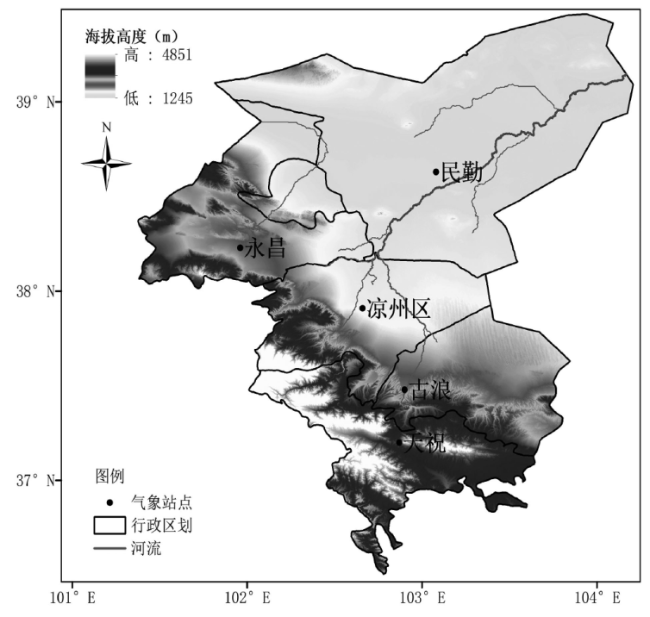
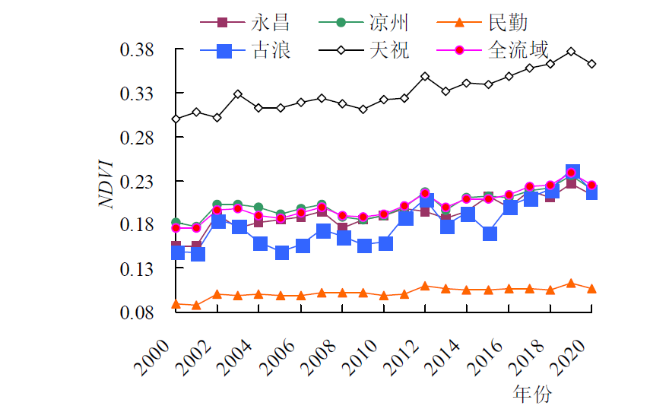
The influence of climate change on vegetation cover is important for ecological environment protection in arid areas. Based on data of monthly temperatures, precipitation, sunshine, evaporation and NASA GIMMS normalized difference vegetation index (NDVI) of Shiyang River Basin from 2000 to 2020, annual and seasonal variations trend of temperature, precipitation, sunshine hours, evaporation and NDVI were analyzed by using linear trend method, then effect of climate elements change on NDVI change were studied by correlation coefficient method. The results showed that annual temperature showed a clear upward trend in Shiyang River Basin and various regions. Temperature in spring, summer and autumn showed an upward trend, and it showed a downward trend in winter (except Minqin). Annual precipitation in total catchment area and Yongchang, Gulang and Tianzhu showed an increasing trend, while Minqin and Liangzhou showed a decreasing trend. Change trend of precipitation in each season was not consistent. Annual sunshine duration showed a decreasing trend in total catchment area and other places except Gulang, and variation trend of sunshine duration in each season was very inconsistent. Annual evaporation showed an increasing trend in total catchment area and other places except Liangzhou, and variation trend of evaporation in each season was not consistent. Annual NDVI in Shiyang River Basin and various regions showed a significant growth trend. Each season NDVI also showed an increasing trend except Liangzhou in spring. Annual and seasonal temperature and precipitation were basically positively correlated with NDVI, and temperature and precipitation had a positive contribution to NDVI. Correlation between sunshine duration, evaporation and NDVI of annual and seasonal was quite different. In general, sunshine duration had a negative contribution to NDVI, and evaporation had a positive contribution to NDVI. Research results will provide scientific reference for improving utilization rate of climate resources, adjusting planting structure and improving ecological environment in Shiyang River Basin.
Key words: climate change; NDVI; correlation; Shiyang River Basin
WANG Heling , DING Wenkui , LI Xingyu , YANG Xiaoling , GUO Limei , ZHANG Jinxiu . Climate Change in Shiyang River Basin and Its Influence on Vegetation Index[J]. Journal of Agriculture, 2024 , 14(4) : 83 -92 . DOI: 10.11923/j.issn.2095-4050.cjas2023-0134
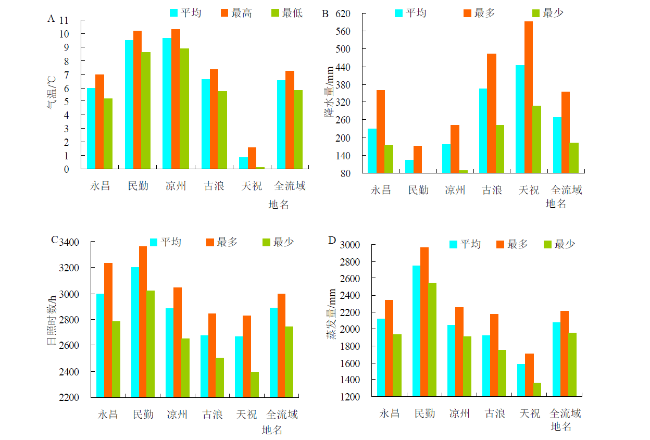
表1 石羊河流域四季气候要素的平均值 |
| 气候因素 | 季节 | 全流域 | 永昌 | 民勤 | 凉州 | 古浪 | 天祝 |
|---|---|---|---|---|---|---|---|
| 气温/℃ | 春季 | 7.8 | 7.4 | 11.5 | 11.4 | 7.7 | 0.9 |
| 夏季 | 18.7 | 18.1 | 23.3 | 22.2 | 18.4 | 11.3 | |
| 秋季 | 6.4 | 5.9 | 9.1 | 9.4 | 6.6 | 1.1 | |
| 冬季 | -6.7 | -7.4 | -5.7 | -4.5 | -6.1 | -9.9 | |
| 降水量/mm | 春季 | 50.0 | 39.8 | 23.4 | 33.0 | 82.9 | 70.9 |
| 夏季 | 144.8 | 132.4 | 63.1 | 93.2 | 174.5 | 260.9 | |
| 秋季 | 65.1 | 52.9 | 32.9 | 43.5 | 93.7 | 102.8 | |
| 冬季 | 7.8 | 5.5 | 3.2 | 6.1 | 13.6 | 10.6 | |
| 日照时数/h | 春季 | 786.0 | 809.0 | 875.4 | 782.4 | 733.8 | 729.6 |
| 夏季 | 753.6 | 780.8 | 891.8 | 775.6 | 711.8 | 608.1 | |
| 秋季 | 670.7 | 706.2 | 734.9 | 668.2 | 619.5 | 624.8 | |
| 冬季 | 673.0 | 701.2 | 701.3 | 658.2 | 609.4 | 695.1 | |
| 蒸发量/mm | 春季 | 679.8 | 693.8 | 900.6 | 682.4 | 590.1 | 503.1 |
| 夏季 | 840.4 | 832.9 | 1164.4 | 838.5 | 779.4 | 569.6 | |
| 秋季 | 398.8 | 412.1 | 511.1 | 378.6 | 367.0 | 307.9 | |
| 冬季 | 178.6 | 185.7 | 168.2 | 146.8 | 200.0 | 196.4 |
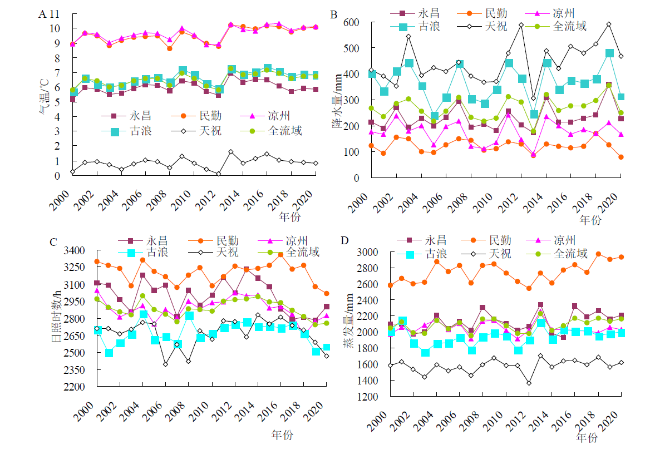
表2 石羊河流域四季气候要素的趋势斜率和趋势系数 |
| 气候因素 | 季节 | 项目 | 全流域 | 永昌 | 民勤 | 凉州 | 古浪 | 天祝 |
|---|---|---|---|---|---|---|---|---|
| 气温 | 春季 | 趋势斜率/(℃/10a) | 0.697 | 0.529 | 0.836 | 0.658 | 0.816 | 0.534 |
| 趋势系数 | 0.4565* | 0.3694** | 0.4667* | 0.4441* | 0.5036* | 0.3606*** | ||
| 夏季 | 趋势斜率/(℃/10a) | 0.471 | 0.453 | 0.669 | 0.456 | 0.565 | 0.141 | |
| 趋势系数 | 0.4626* | 0.4222** | 0.5830* | 0.4693* | 0.4681* | 0.1562 | ||
| 秋季 | 趋势斜率/(℃/10a) | 0.456 | 0.269 | 0.680 | 0.391 | 0.586 | 0.294 | |
| 趋势系数 | 0.5097* | 0.2395 | 0.5752* | 0.3981** | 0.5113* | 0.3071*** | ||
| 冬季 | 趋势斜率/(℃/10a) | -0.113 | -0.239 | 0.053 | -0.161 | -0.040 | -0.154 | |
| 趋势系数 | -0.0556 | -0.1192 | 0.0224 | -0.0794 | -0.0200 | -0.0894 | ||
| 降水量 | 春季 | 趋势斜率/(mm/10a) | 3.665 | 7.969 | 3.082 | -0.052 | 5.049 | 5.979 |
| 趋势系数 | 0.1261 | 0.3114*** | 0.1473 | 0.0024 | 0.0985 | 0.1921 | ||
| 夏季 | 趋势斜率/(mm/10a) | 16.515 | 15.068 | -1.700 | 4.894 | 13.062 | 51.455 | |
| 趋势系数 | 0.3002 | 0.2322 | -0.0424 | 0.0872 | 0.1903 | 0.4955* | ||
| 秋季 | 趋势斜率/(mm/10a) | -12.194 | -4.141 | -3.665 | -6.674 | -13.284 | -3.623 | |
| 趋势系数 | -0.3500*** | -0.1367 | -0.1655 | -0.2100 | -0.2339 | -0.0906 | ||
| 冬季 | 趋势斜率/(mm/10a) | 1.603 | 2.326 | -0.155 | 0.895 | 2.034 | 1.270 | |
| 趋势系数 | 0.2236 | 0.4509* | -0.0332 | 0.1476 | 0.1436 | 0.1691 | ||
| 日照时数 | 春季 | 趋势斜率/(h/10a) | 4.172 | -12.766 | 6.074 | 8.499 | 16.096 | 2.956 |
| 趋势系数 | 0.0600 | -0.1245 | 0.0927 | 0.1114 | 0.1908 | 0.0412 | ||
| 夏季 | 趋势斜率/(h/10a) | -44.579 | -61.173 | -29.231 | -56.204 | -34.235 | -42.052 | |
| 趋势系数 | -0.4984* | -0.5318* | -0.3421*** | -0.5449* | -0.3758** | 0.3662** | ||
| 秋季 | 趋势斜率/(h/10a) | 7.114 | -1.090 | -2.053 | 9.001 | 17.460 | 12.249 | |
| 趋势系数 | 0.1114 | -0.141 | -0.0283 | 0.1261 | 0.2553 | 0.1729 | ||
| 冬季 | 趋势斜率/(h/10a) | 1.649 | -8.975 | 0.631 | 3.608 | 5.961 | 7.022 | |
| 趋势系数 | 0.0347 | -0.1792 | 0.0141 | 0.0616 | 0.1179 | 0.1346 | ||
| 蒸发量 | 春季 | 趋势斜率/(mm/10a) | 23.595 | 6.288 | -5.913 | 12.156 | 18.478 | 30.683 |
| 趋势系数 | 0.2670 | 0.0600 | -0.0574 | 0.1456 | 0.1277 | 0.3561*** | ||
| 夏季 | 趋势斜率/(mm/10a) | 6.200 | 10.232 | 62.140 | -34.714 | -1.179 | -42.991 | |
| 趋势系数 | 0.0854 | 0.1049 | 0.5874* | -0.4567* | -0.0077 | -0.4825* | ||
| 秋季 | 趋势斜率/(mm/10a) | 38.841 | 38.712 | 57.423 | 10.245 | 47.647 | 29.494 | |
| 趋势系数 | 0.5638* | 0.4549* | 0.6592* | 0.1510 | 0.4649* | 0.4938* | ||
| 冬季 | 趋势斜率/(mm/10a) | 4.305 | 14.162 | -7.992 | 6.610 | -14.454 | 25.014 | |
| 趋势系数 | 0.1342 | 0.3635*** | -0.2112 | 0.2138 | -0.2538 | 0.5840* |
注:“***”、“**”、“*”表示趋势系数分别通过了α=0.1、0.05、0.01显著性水平检验。 |
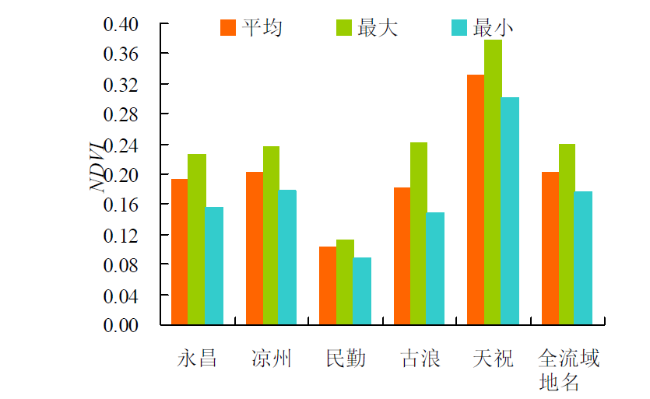
表3 石羊河流域各季节NDVI的均值、趋势斜率及趋势系数 |
| 季节 | 项目 | 全流域 | 永昌 | 民勤 | 凉州 | 古浪 | 天祝 |
|---|---|---|---|---|---|---|---|
| 春季 | 均值 | 0.6100 | 0.1567 | 0.0864 | 0.1691 | 0.1464 | 0.2465 |
| 趋势斜率/(/a) | 0.0013 | 0.0014 | 0.0004 | 0.0001 | 0.0021 | 0.0025 | |
| 趋势系数 | 0.7659* | 0.6824* | 0.7280* | 0.0469 | 0.7918* | 0.8732* | |
| 夏季 | 均值 | 0.3074 | 0.2943 | 0.1335 | 0.3166 | 0.2627 | 0.5301 |
| 趋势斜率/(/a) | 0.0035 | 0.0045 | 0.0011 | 0.0033 | 0.0048 | 0.0039 | |
| 趋势系数 | 0.7426* | 0.7573* | 0.7515* | 0.7057* | 0.6470* | 0.6884* | |
| 秋季 | 均值 | 0.2144 | 0.1961 | 0.1080 | 0.2113 | 0.1991 | 0.3577 |
| 趋势斜率/(/a) | 0.0028 | 0.0026 | 0.0008 | 0.0022 | 0.0047 | 0.0035 | |
| 趋势系数 | 0.8117* | 0.9177* | 0.6768* | 0.6968* | 0.7648* | 0.7517* | |
| 冬季 | 均值 | 0.1258 | 0.1207 | 0.0807 | 0.1144 | 0.1188 | 0.1945 |
| 趋势斜率/(/a) | 0.0016 | 0.0017 | 0.0007 | 0.0019 | 0.0022 | 0.0017 | |
| 趋势系数 | 0.9287* | 0.7645* | 0.9220* | 0.9262* | 0.8589* | 0.7837* |
注:*表示趋势系数通过了α=0.01显著性水平检验。 |
表4 石羊河流域气候要素与NDVI的相关系数 |
| 气候因素 | 时段 | 全流域 | 永昌 | 民勤 | 凉州 | 古浪 | 天祝 |
|---|---|---|---|---|---|---|---|
| 气温/℃ | 年 | 0..3538*** | 0.2732 | 0.4425** | 0.3592*** | 0.2657 | 0.2030 |
| 春季 | 0.5251** | 0.2863 | 0.6264* | 0.2447 | 0.4902** | 0.5489* | |
| 夏季 | 0.2057 | 0.2052 | 0.2906 | 0.1790 | 0.1166 | -0.0281 | |
| 秋季 | 0.1581 | 0.0852 | 0.2160 | 0.0871 | 0.1229 | 0.1482 | |
| 冬季 | 0.1006 | 0.0415 | 0.0975 | -0.0010 | 0.0220 | 0.2840 | |
| 降水量/mm | 年 | 0.5462* | 0.4930** | 0.0677 | 0.3665*** | 0.4672** | 0.7006* |
| 春季 | 0.3046 | 0.3392*** | 0.0520 | 0.3508 | 0.1953 | 0.3886*** | |
| 夏季 | 0.5728* | 0.4255** | 0.1019 | 0.3815*** | 0.5676* | 0.6209* | |
| 秋季 | 0.0324 | 0.1100 | -0.2665 | -0.1046 | 0.1333 | 0.0801 | |
| 冬季 | 0.1381 | 0.4965** | -0.1774 | 0.1242 | -0.0212 | 0.2795 | |
| 日照时数/h | 年 | -0.3679*** | -0.5063** | -0.1632 | -0.4010*** | -0.1348 | 0.0091 |
| 春季 | -0.0860 | -0.2235 | 0.0445 | -0.4795** | 0.1329 | 0.1291 | |
| 夏季 | -0.4561** | -0.4309** | -0.3697*** | -0.4266** | -0.3795*** | -0.2530 | |
| 秋季 | -0.0380 | -0.3309 | 0.0453 | 0.0557 | 0.1125 | -0.0512 | |
| 冬季 | 0.0660 | -0.2098 | 0.1644 | 0.1090 | 0.0906 | 0.1632 | |
| 蒸发量/mm | 年 | 0.0961 | 0.0746 | 0.3660*** | -0.2211 | -0.1984 | 0.0726 |
| 春季 | 0.3210 | -0.0536 | 0.1171 | -0.0087 | 0.0009 | 0.4454** | |
| 夏季 | -0.3518*** | -0.3207 | 0.2178 | -0.5744* | -0.2787 | -0.7036* | |
| 秋季 | 0.4003*** | 0.3960*** | 0.5247* | -0.0422 | -0.1818 | 0.2367 | |
| 冬季 | 0.2829 | 0.3787*** | -0.1217 | 0.3239 | 0.1421 | 0.7373* |
注:***、**、*表示相关系数通过了α=0.1、0.05、0.01显著性水平检验,分别为相关性很显著、显著、较显著。 |
| [1] |
|
| [2] |
朱永华, 席小康, 马鹏飞, 等. 植被净初级生产力时空变化及其影响因素分析[J]. 内蒙古农业大学学报(自然科学版), 2022, 43(1):21-26.
|
| [3] |
朱永华, 张生, 赵胜男, 等. 气候变化与人类活动对地下水埋深变化的影响[J]. 农业机械学报, 2017, 48(9):199-205.
|
| [4] |
李茜荣. 2000—2019年云贵两省极端气温对植被NDVI变化的影响研究[D]. 兰州: 西北师范大学, 2021.
|
| [5] |
罗叙, 李建平, 张翼, 等. 荒漠草原土壤水分时空变化对降水变化的响应[J]. 水土保持研究, 2021, 28(4):142-150,158.
|
| [6] |
乔翠平, 王金娜, 王艳艳, 等. 毛乌素沙地风积沙表面蒸发试验研究[J]. 华北水利水电大学学报(自然科学版), 2021, 42(5):102-108.
|
| [7] |
|
| [8] |
|
| [9] |
|
| [10] |
|
| [11] |
施雅风, 沈永平, 胡汝骥, 等. 西北气候由暖干向暖湿转型的信号、影响和前景初步探讨[J]. 冰川冻土, 2002, 24(3):219-226.
|
| [12] |
方精云, 朴世龙, 贺金生, 等. 近20年来中国植被活动在增强[J]. 中国科学(C辑), 2003, 33(6):554-565.
|
| [13] |
赵倩倩, 张京朋, 赵天保, 等. 2000年以来中国区域植被变化及其对气候变化的响应[J]. 高原气象, 2021, 40(2):292-301.
|
| [14] |
单楠. 京津风沙源区植被指数(NDVI)对气候变化响应研究[D]. 北京: 中国林业科学研究院, 2013.
|
| [15] |
王志鹏, 张宪洲, 何永涛, 等. 2000-2015年青藏高原草地归一化植被指数对降水变化的响应[J]. 应用生态学报, 2018, 29(7):75-83.
|
| [16] |
陈婉佳, 刘蓉蓉, 何政伟. 基于MODIS的植被指数变化研究及其与气候因子的关系分析[J]. 测绘与空间地理信息, 2015, 38(9):77-80.
|
| [17] |
杨晓玲, 丁文魁, 杨金虎, 等. 河西走廊东部近50年气候变化特征及区内5站对比分析[J]. 干旱区资源与环境, 2011, 29(5):259-268.
|
| [18] |
张存杰. 全球变暖对西北地区干旱气候变化的影响研究[D]. 兰州: 中国科学院寒区旱区环境与工程研究所, 2009.
|
| [19] |
王莺, 李耀辉, 孙旭映. 气候变化对黄河源区生态环境的影响[J]. 草业科学, 2015, 3(4):539-551.
|
| [20] |
王锦波, 杨晓玲, 张义海, 等. 张掖市归一化植被指数与气候变化的相关性研究[J]. 中国农学通报, 2019, 35(15):85-90.
|
| [21] |
颉耀文, 陈发虎. 基于数字遥感图像的民勤绿洲20年变化研究[J]. 干旱区研究, 2002, 19(1):69-74.
|
| [22] |
李忆春, 陈发虎. 民勤盆地水资源可持续利用对策——2000年民勤水资源利用调查[J]. 山地学报, 2001, 19(5):465-469.
|
| [23] |
韩涛, 王大为. 2000—2014年石羊河流域植被覆盖变化研究[J]. 中国农学通报, 2017, 33(13):66-74.
|
| [24] |
张立峰. 西北生态环境脆弱区典型内陆河流域植被覆盖变化及其影响因素研究[D]. 兰州: 兰州交通大学, 2017.
|
| [25] |
罗晓玲, 杨梅, 李岩瑛, 等. 基于NDVI的石羊河流域植被演变特征及其对沙尘暴的影响分析[J]. 水土保持学报, 2022, 36(2):84-91.
|
| [26] |
吴文斌, 杨鹏, 唐华俊, 等. 两种NDVI时间序列数据拟合方法比较[J]. 农业工程学报, 2009, 25(11):183-188.
|
| [27] |
邓书斌. ENVI遥感图像处理方法[M]. 北京: 科学出版社, 2010.
|
| [28] |
李娜, 殷学永, 马金柱, 等. 基于MODIS的河南省植被指数提取与分析[J]. 安徽农业科学, 2011, 39(28):17599-17600,17603.
|
| [29] |
胡晓雯, 曹爽, 赵显富. 基于植被指数的绿地信息提取的比较[J]. 南京信息工程大学学报(自然科学版), 2012, 4(5):420-425.
|
| [30] |
魏凤英. 现代气候统计诊断与预测技术(第二版)[M]. 北京: 气象出版社, 2007:37-41.
|
| [31] |
施能, 陈家其, 屠其璞. 中国近100年来4个年代际的气候变化特征[J]. 气象学报, 1995, 53(4):431-439.
|
| [32] |
施能, 马丽, 袁晓玉, 等. 近50a浙江省气候变化特征分析[J]. 南京气象学院学报, 2001, 24(2):207-213.
|
| [33] |
|
| [34] |
张建勇, 高冉, 胡骏, 等. 灰色关联度和Pearson相关系数的应用比较[J]. 赤峰学院学报(自然科学版), 2014, 30(11):1-2.
|
| [35] |
王平, 沈润平. 基于CLM模型的植被覆盖变化对黄土高原气温和降水的影响研究[J]. 科学技术与工程, 2013, 13(20):5754-5760.
|
| [36] |
崔林丽, 史军. 中国华东及其周边地区NDVI对气温和降水的季节响应[J]. 资源科学, 2012, 34(1):81-90.
|
| [37] |
焦珂伟, 高江波, 吴绍洪, 等. 植被活动对气候变化的响应过程研究进展[J]. 生态学报, 2018, 38(6):2229-2238.
|
/
| 〈 |
|
〉 |