
Received date: 2023-09-20
Online published: 2024-09-29
Copyright
Wyrtki jet is an easterly jet that occurs during the monsoon transition period in the equatorial Indian Ocean. It generates abundant zonal redistribution of heat, salt, and water masses, which plays an important role in ocean thermohaline circulation of the eastern Indian Ocean and even global ocean. The intraseasonal variability of Wyrtki jet is related to the equatorial Kelvin waves and has a significant impact on the intraseasonal variability of the Indonesian throughflow in the outflow straits. It is also a triggering factor for the Indian Ocean Dipole. In addition, intraseasonal variability of Wyrtki jet can regulate the seasonal and interannual variabilities of Wyrtki jet across time scales, making it a potential important participant in climate variation of the tropical Indian Ocean and even the global world. Therefore, conducting in-depth research on the intraseasonal variability of Wyrtki jet is of great scientific significance for a profound understanding of the ocean circulation in tropical Indian Ocean as well as the process and mechanism of air-sea interaction in the Indian Ocean basin. This article mainly introduces the current research status of the intraseasonal variability of Wyrtki jet, and summarizes its generation mechanism as well as its seasonal and interannual variation characteristics. On this basis, future research on the intraseasonal variability of Wyrtki jet is prospected. We suggest that future research on the intraseasonal variability of Wyrtki jet can be conducted from two aspects: the correlation between the intraseasonal variability of Wyrtki jet and the Asian monsoon, and the correlation between the intraseasonal variability of Wyrtki jet and large-scale air-sea interaction events. Furthermore, it is pointed out that in the future, various methods such as observation, ocean circulation model and machine learning technology should be used to obtain data of Wyrtki jet. Based on these data, we can further clarify the impact of the intraseasonal variability of Wyrtki jet on local and global ocean and atmosphere, thereby improving understanding of the tropical Indian Ocean and global ocean circulation.
GuoJiao CAO , TengFei XU , ZeXun WEI . Research progress on intraseasonal variability of Wyrtki jet[J]. Progress in Geophysics, 2024 , 39(4) : 1293 -1303 . DOI: 10.6038/pg2024HH0415
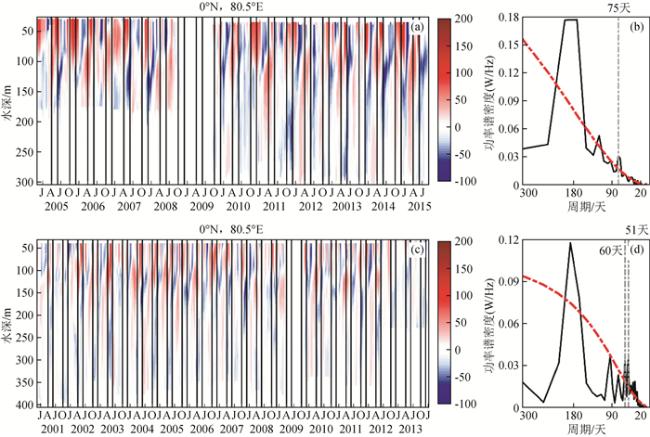
图1 (a) 0°N,80.5°E RAMA浮标纬向流(单位:cm/s),黑色框标注了春季(4—5月)和秋季(10—11月);(b)为(a)上100 m平均纬向流的功率谱;(c,d)同(a,b),为0°N,90°E结果(a)—(h)依次代表滞后时间为-20天至+15天,只保留了能够通过95%置信度检验的部分(参考Iskandar和McPhaden(2011)文章内容重绘). Fig 1 (a) Zonal current data from RAMA buoy located at 0°N, 80.5°E (unit: cm/s), the black boxes indicate April—May and October—November; (b) is the power spectrum of the zonal current averaged in the upper 100 m; (c, d) are same as (a, b), but for RAMA buoy located at 0°N, 90°E |
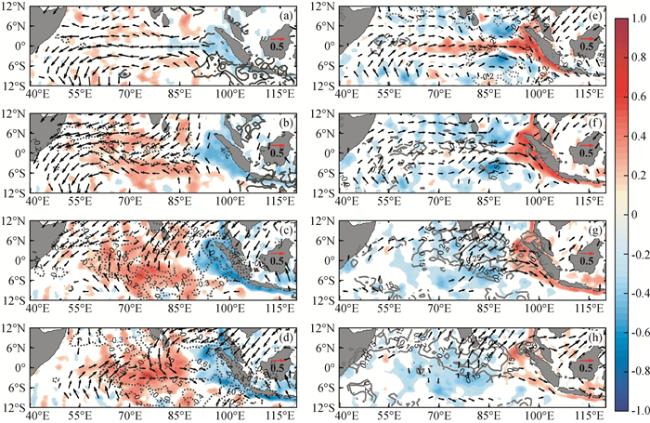
图2 季节内(20~90天波段)海表面高度异常(填色)、向外长波辐射(等值线)和海表面风场(箭头)与0°、90°E处季节内表层平均(40~100 m)纬向流的超前滞后相关系数演变图Fig 2 Maps of intraseasonal sea surface level anomaly (shading), outgoing longwave radiation (contour), and sea surface wind field (arrows) regressed onto intraseasonal depth-averaged (40~100 m) zonal currents at 0°, 90°E (a)—(h) Represents a lag time of -20 days to +15 days in sequence. Value that are not significant at 95% confidence limit have been masked (redraw referred to Iskandar and McPhaden(2011)). |
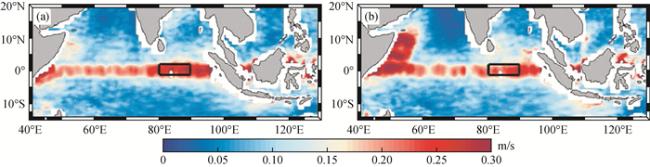
图3 (a) 北半球春季(4—5月)和(b)秋季(10—11月)0~30 m垂向平均纬向流季节内信号标准差的水平分布(单位:m/s)黑色框为Wyrtki急流存在显著季节内变化的海域. Fig 3 (a) Standard deviation of intraseasonal zonal current (unit: m/s) averaged in the upper 30 m during boreal spring (April—May) and (b) fall (October—November) The black boxes indicate areas with significant intraseasonal variabilities. |
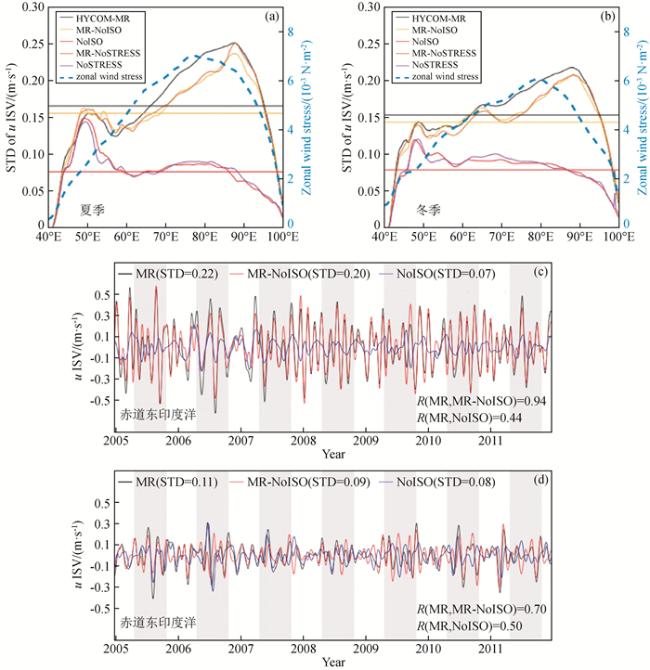
图4 (a) 北半球夏季(5—10月)季节内表层纬向流(单位:m/s)标准差沿赤道的分布,纬向流取5~50 m、2°S—2°N范围内的平均值,黑色线为考虑所有因素的HYCOM模式结果,黄色线表征大气季节内振荡的作用,红线表征海洋内部不稳定性的作用,橙色线表征季节内风应力的作用;(b)同(a),但为冬季(11—4月)的结果;(c)2°S—2°N、80°E—90°E区域5~50 m平均季节内表层纬向流的时间序列,黑色线为考虑所有因素的HYCOM模式结果,红色线表示相同情况下仅由大气季节内振荡作用产生的季节内表层纬向流,蓝色线表示相同情况下仅由海洋内部不稳定性作用产生的季节内表层纬向流,灰色阴影部分表示北半球夏季(5—10月);(d)同(c), 但为2°S—2°N、45°E—55°E区域的结果(引自Zhong等(2022))Fig 4 (a) The standard deviations of the intraseasonal zonal current (unit: m/s) along the equator during boreal summer (May—October). The intraseasonal zonal current is averaged over 5~50 m, 2°S—2°N. The black line represents the result of the HYCOM model considering all factors, the yellow line represents the role of intraseasonal atmospheric oscillations, the red line represents the role of oceanic internal instabilities, and the orange line represents the role of intraseasonal wind stress; (b) is the same as (a), but for data during boreal winter (November—April); (c) Time series of the intraseasonal zonal current averaged over 5~50 m, 2°S—2°N, 80°E—90°E from the HYCOM model considering all factors (black line). The red line represents the intraseasonal zonal current generated solely by the intraseasonal atmospheric oscillations under the same conditions, while the blue line represents the intraseasonal zonal current generated solely by the oceanic internal instabilities. Gray shading indicates boreal summer (May—October); (d) is same as (c), but for the result averaged over 2°S—2°N, 45°E—55°E (Cited from Zhong et al., 2022) |
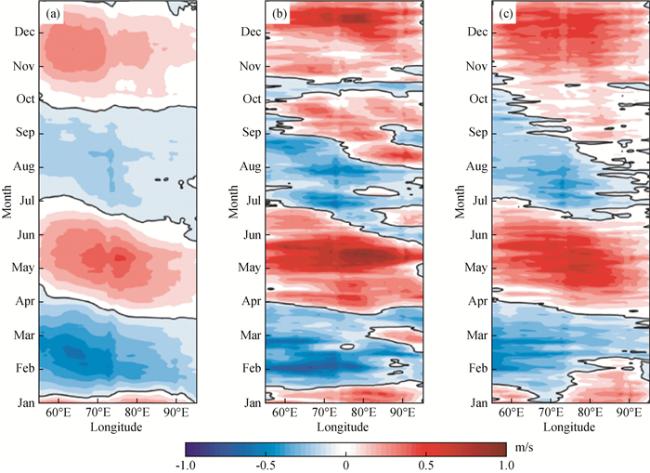
图5 (a) 气候态日平均强迫场驱动产生的赤道印度洋表层纬向流(2°N—2°S平均, 单位:m/s)经度-时间变化图;(b)同(a), 为2013年日平均强迫场驱动的结果;(c)同(b),但是在强迫场中滤除了季节内信号(引自Duan等(2016))Fig 5 (a) Time-longitude diagram of simulated surface zonal current (averaged over 2°N—2°S with unit m/s) along the equatorial Indian Ocean forced by daily forcing fields from climatology; (b) is same as (a), but for the results from models forced by daily forcing fields from 2013;The forcing fields in (c) are same as those in (b) except for subtracting signals of intraseasonal atmospheric oscillation (Cited from Duan et al., 2016) |
感谢审稿专家提出的修改意见和编辑部的大力支持!
|
|
|
|
|
|
|
|
|
|
|
|
|
|
|
|
|
|
|
|
|
|
|
|
|
|
|
|
|
|
|
|
|
|
|
|
|
|
|
|
|
|
|
|
|
|
|
|
|
|
|
|
|
|
|
|
|
|
|
|
|
|
|
|
|
|
|
|
|
|
|
|
|
|
|
|
|
|
|
|
|
|
|
|
|
|
|
|
|
|
|
|
|
|
|
|
|
|
|
|
|
|
|
|
|
|
|
|
|
|
|
|
|
|
|
|
|
|
/
| 〈 |
|
〉 |