
Forward modeling study of three-dimensional time-lapse magnetotelluric method considering induced polarization effect
Received date: 2023-10-25
Online published: 2024-09-29
Copyright
The Magnetotelluric (MT) method is widely used in the exploration of oil and gas resources. The time-lapse MT method can monitor reservoir dynamic distribution and interface changes by observing the time-lapse MT response caused by the change of underground electrical structures and interfaces. Traditional time-lapse MT methods monitoring simulation are based on isotropic theory and regular grids. However, the induced polarization (IP) effect is widely present in reservoirs, ignoring which can lead to interpretation errors and difficulties in time-lapse monitoring of reservoirs, especially for unconventional reservoirs with complex terrain and high water content in the later phases of development. First of all, in order to solve these problems, the Cole-Cole complex resistivity model is used in the vector Helmholtz equation to characterize the IP effect of the reservoir medium. Then, the vector Helmholtz equation discretized by the Galerkin finite element method with unstructured tetrahedral grids, has been implemented to a 3D time-lapse electromagnetic algorithm that considers the IP effect. Thirdly, the analytical solution of the ID model considering IP effect is used to verify the correctness of the 3D algorithm in this paper. Further, different IP parameter variations are set and analyzed to determine the characteristic responses of the reservoirs and discuss the resolution ability of the time-lapse electromagnetic monitoring. At last, a realistic reservoir model in the Fuling area is set up to analyze the time-lapse electromagnetic anomalies generated before and after the displacement of the reservoir. The results show that the significant differences in the time-lapse MT responses caused by changes in the IP parameters of the reservoir can be used to infer the time-lapse change process of the reservoir. In the process of reservoir displacement enhancement, the response difference is distinguished by the sensitivity to the boundary of the displacement swept region, where △ρxya can effectively respond to the change of the interface in the x direction, while △ρyxa targets the y-direction.
BoShuai DAI , Xin HUANG , XiaoYue CAO , LiangJun YAN , XingBing XIE . Forward modeling study of three-dimensional time-lapse magnetotelluric method considering induced polarization effect[J]. Progress in Geophysics, 2024 , 39(4) : 1565 -1585 . DOI: 10.6038/pg2024HH0474
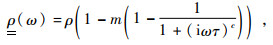
 ,ρ为真电阻率;ρ0为零频电阻率;m为极化率;τ为时间常数;c为频率相关系数.
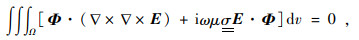
 代入式(3)可得:


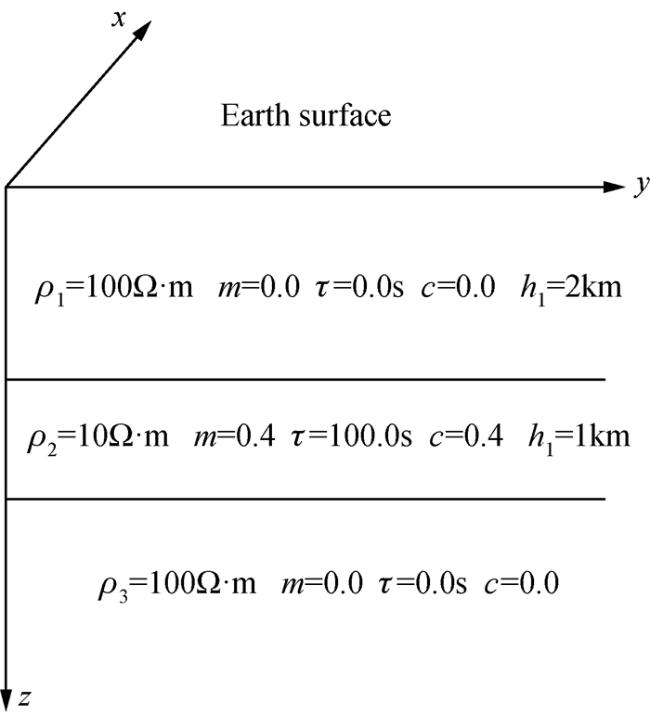
表1 层状介质模型参数Table 1 Parameters of the layered medium model |
| 地层序号 | 真电阻率 ρ/(Ω·m) | 厚度/m | 极化率m | 时间常数τ/s | 频率相关系数c |
| 1 | 100 | 2000 | 0.0 | 0.0 | 0.0 |
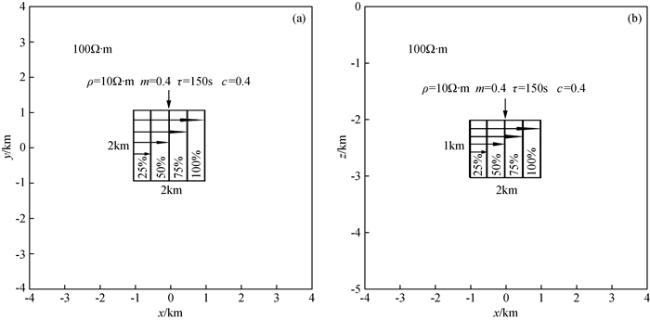
| 2 | 10 | 1000 | 0.4 | 100.0 | 0.4 |
| 3 | 100 | — | 0.0 | 0.0 | 0.0 |
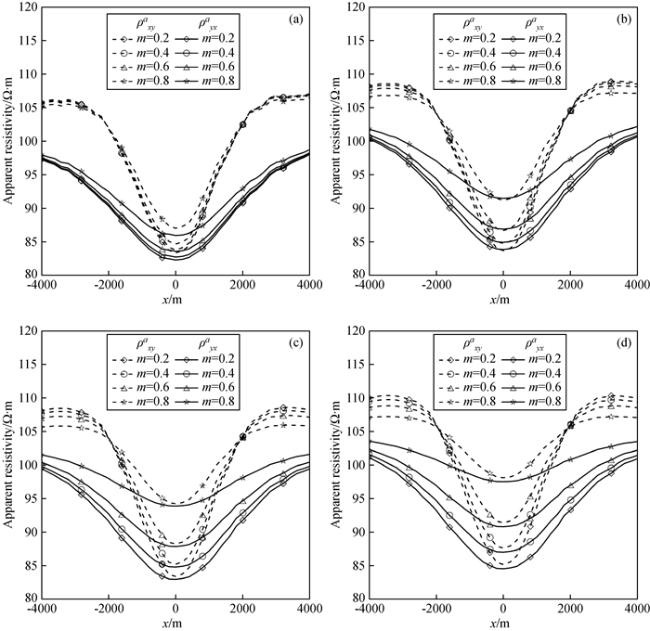
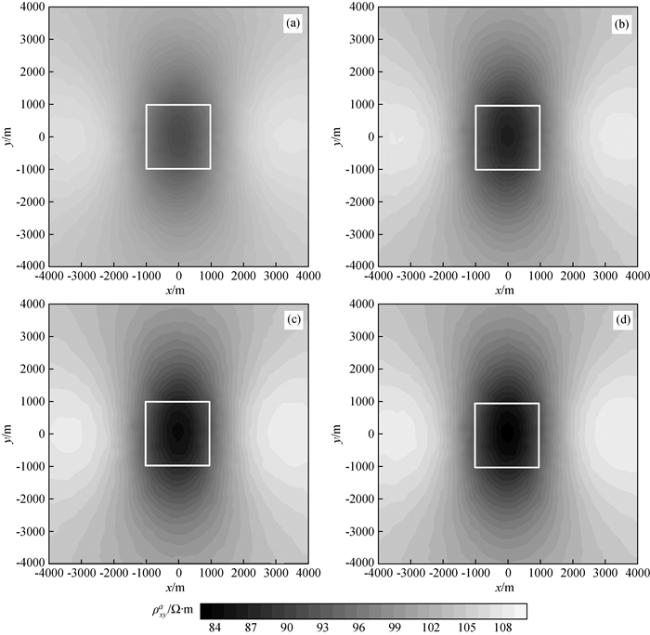
图9 频率10-2 Hz视电阻率ρxya等值线图Fig 9 Contour maps of apparent resistivity ρxya at frequency 10-2 Hz (a)τ=102 s; (b)τ=101 s; (c)τ=10-1 s; (d)τ=10-2 s. |
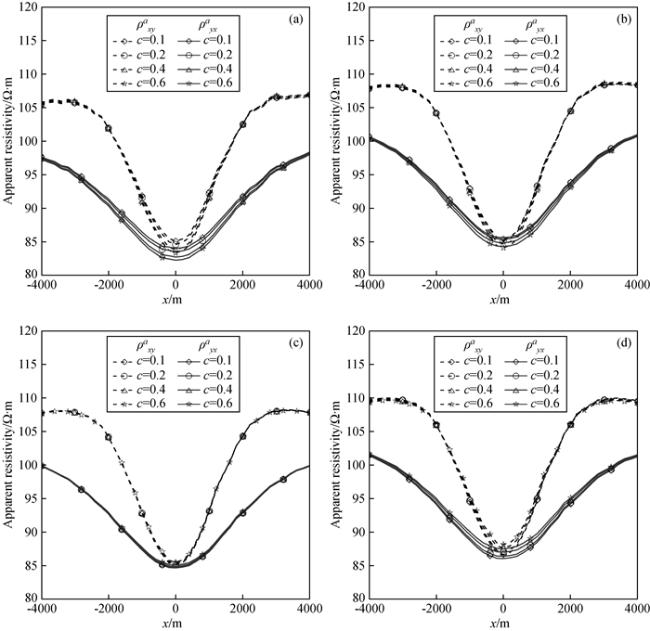
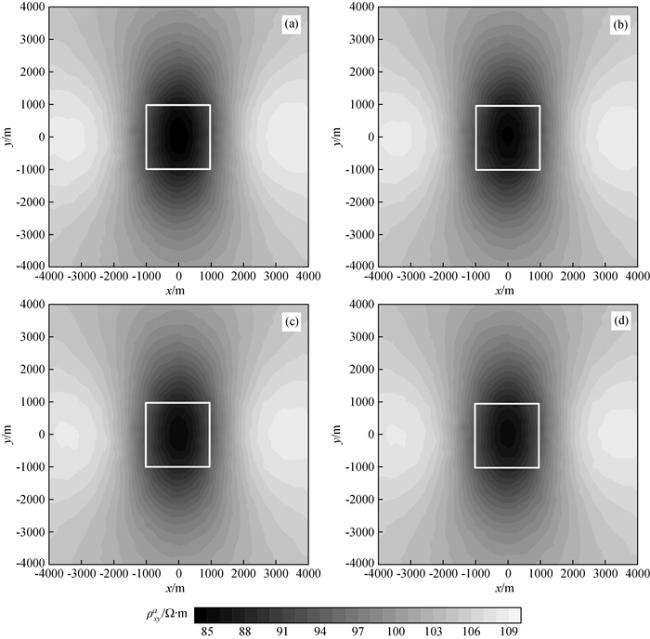
图12 频率10-2 Hz视电阻率ρxya等值线图Fig 12 Contour maps of apparent resistivity ρxya at frequency 10-2 Hz (a)c=0.6; (b)c=0.4; (c)c=0.2; (d)c=0.1. |
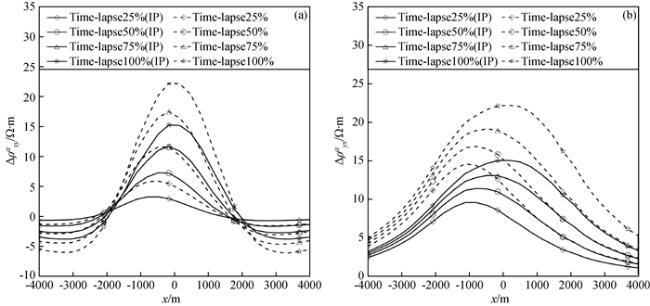
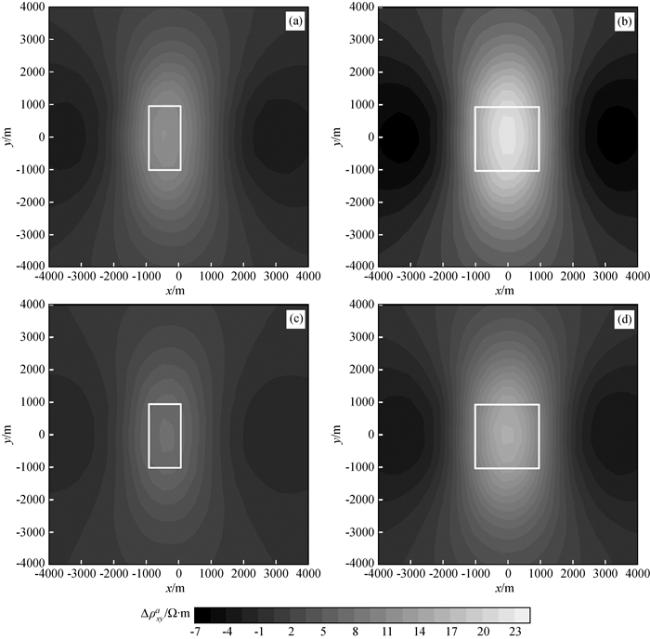
图16 驱替阶段Δρxya等值线图(a)驱替50%; (b)驱替100%; (c)有IP驱替50%; (d)有IP驱替100%. Fig 16 Contour maps of Δρxyaduring displacement stages (a) Displacement 50%; (b) Displacement 100%; (c) Displacement 50% with IP; (d) Displacement 100% with IP. |
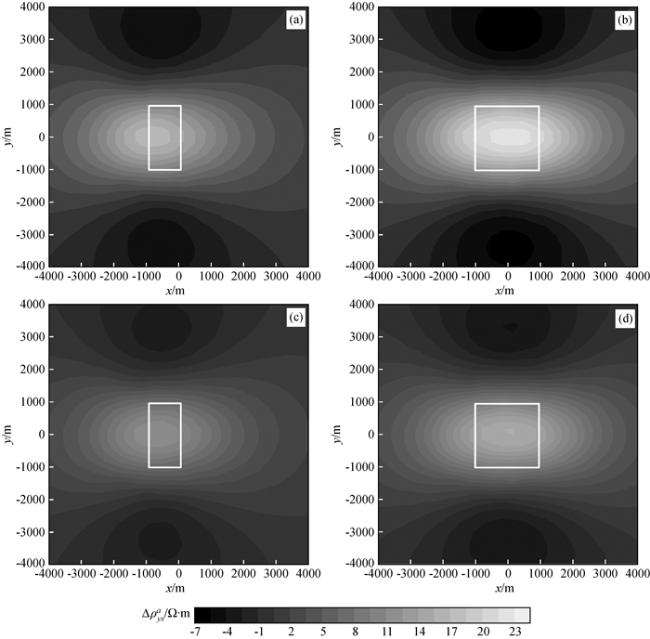
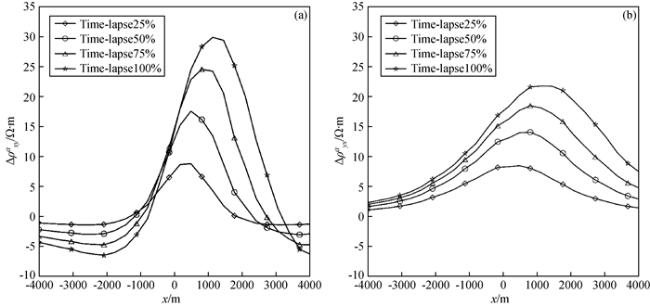
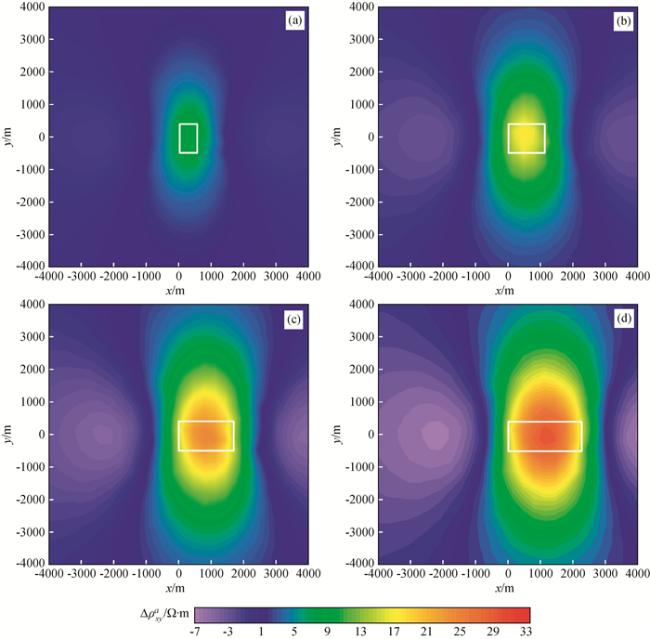
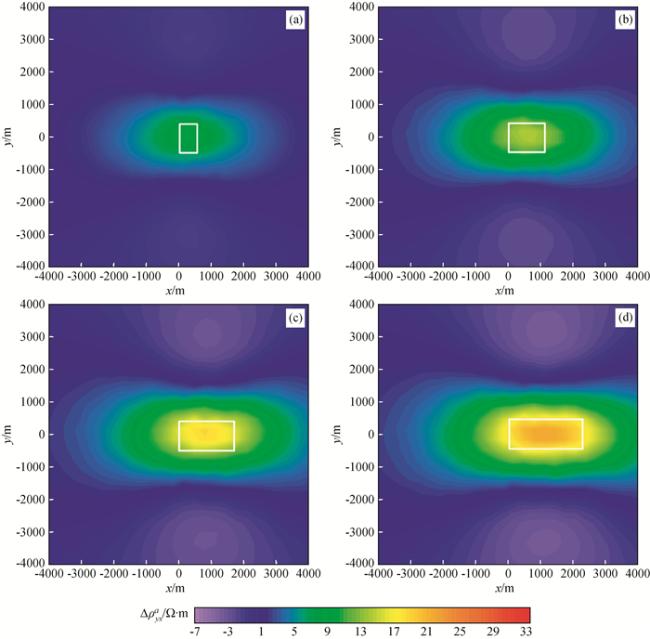
图20 压裂阶段Δρxya等值线图(a)有IP压裂25%; (b)有IP压裂50%; (c)有IP压裂75%; (d)有IP压裂100%. Fig 20 Contour maps of Δρxya during fracturing stages (a) Fracturing 25% with IP; (b) Fracturing 50% with IP; (c) Fracturing 75% with IP; (d) Fracturing 100% with IP. |
感谢长江大学EMLAB研究团队成员在文章准备过程中提供的帮助,感谢审稿专家对本文提出的修改建议.
|
|
|
|
|
|
|
|
|
|
|
|
|
|
|
|
|
|
|
|
|
|
|
|
|
|
|
|
|
|
|
|
|
|
|
|
|
|
|
|
|
|
|
|
|
|
|
|
|
|
|
|
|
|
|
|
|
|
|
|
|
|
|
|
|
|
|
|
|
|
|
|
|
|
|
|
|
|
|
|
|
|
/
| 〈 |
|
〉 |


