
Dynamic assessment of ecological environment quality in the ecological functional zone of central Guizhou city and its driving factor analysis
Received date: 2023-11-25
Online published: 2024-12-19
Copyright
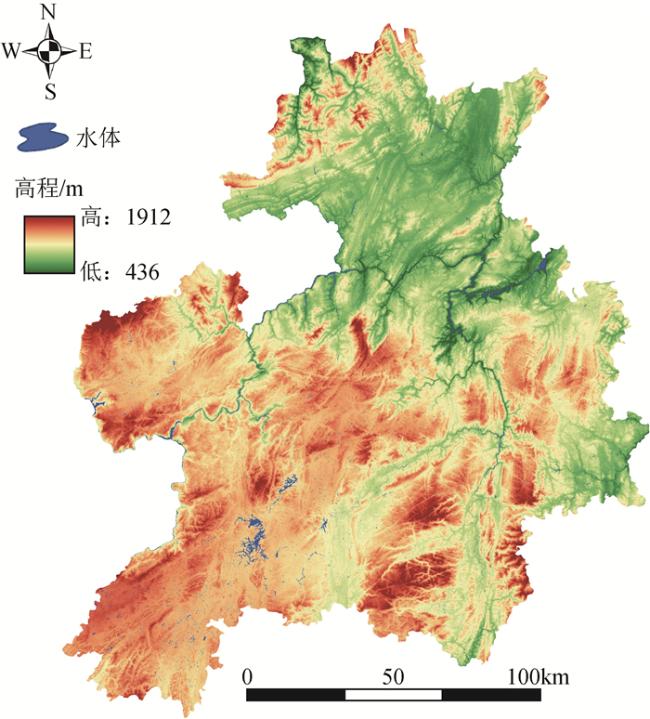
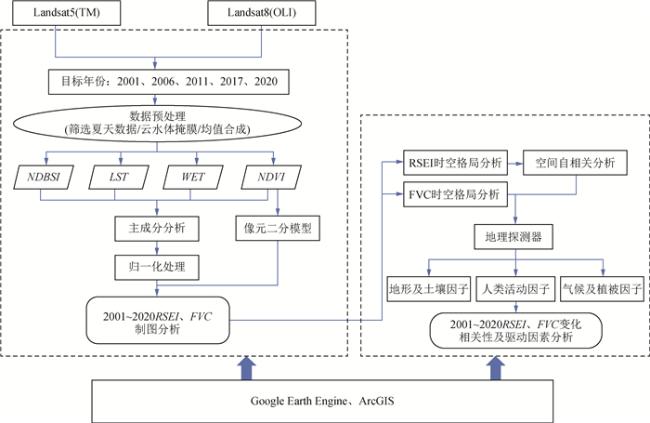
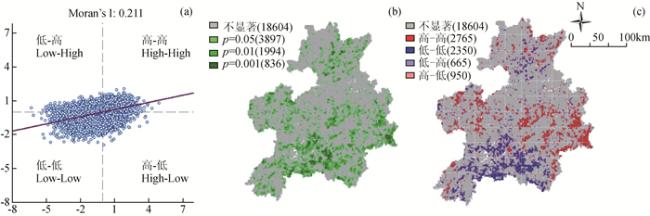
The urban ecological functional zone in central Guizhou, positioned as the core area and growth pole for urban construction in the typical karst region of Southwest China, is the focal point of this study. Addressing the scientific challenge of comprehensively elucidating and dynamically evaluating the spatiotemporal trends in ecological environment quality, this paper, based on the Google Earth Engine (GEE) cloud platform, employs remote sensing ecological index and pixel dichotomous model for vegetation coverage to extract spatiotemporal information on ecological environment quality and vegetation coverage in the central Guizhou urban ecological functional zone. The study further integrates Moran's I index and Geographic Detector to quantitatively identify and analyze the key factors and driving mechanisms of ecological quality changes. Research results indicate that the ecological quality of the urban ecological functional zone in central Guizhou exhibited an overall positive trend from 2001 to 2020. The Remote Sensing Ecological Index increased from 0.742 to 0.796, and vegetation coverage rose from 0.588 to 0.758. The spatial distribution and temporal evolution trends between the two were essentially similar, with a high correlation of 0.893.Notably, regions demonstrating improved ecological quality were predominantly concentrated in areas such as Fuquan City, Wudang District, Qianxi City, and Kaiyang County, with respective average increases of 9.34%, 7.48%, 7.32%, and 6.46%. Conversely, districts including Huaxi, Guanshanhu, Baiyun, and Pingba exhibited a declining trend in ecological environment quality, with decreases of 4.62%, 2.77%, 2.54%, and 2.15%.The determination of driving factors for ecological environment quality indicates that natural factors, primarily represented by vegetation coverage, and anthropogenic factors, characterized by land use and population density, are the predominant factors influencing the ecological environment quality in the central Guizhou urban ecological functional zone. This research contributes valuable insights to assist decision-making in enhancing urban ecological civilization construction and accelerating sustainable social and economic development in Guizhou Province.
WenYan LI , AnJun LAN , ZeMeng FAN , Dan WANG . Dynamic assessment of ecological environment quality in the ecological functional zone of central Guizhou city and its driving factor analysis[J]. Progress in Geophysics, 2024 , 39(5) : 1749 -1762 . DOI: 10.6038/pg2024HH0408


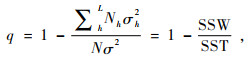
表1 主成分分析结果Table 1 Result of PCA analysis |
| 年份 | 指标 | PCA1 | PCA2 | PCA3 | PCA4 |
| 2001 | NDVI | 0.996036 | -0.039806 | -0.066996 | -0.042897 |
| WET | 0.055185 | 0.407061 | 0.825882 | -0.386231 | |
| NDBSI | -0.069532 | -0.173022 | -0.340973 | -0.921394 | |
| LST | -0.005752 | -0.895980 | 0.444036 | 0.004363 | |
| 特征值 | 0.004744 | 0.000232 | 0.000203 | 0.000006 | |
| 贡献率/% | 91.49 | 4.47 | 3.92 | 0.12 | |
| 2006 | NDVI | 0.899267 | 0.440499 | -0.079230 | -0.001109 |
| WET | 0.114848 | -0.054196 | 0.991700 | -0.006290 | |
| NDBSI | -0.001843 | 0.000034 | -0.006121 | -0.999980 | |
| LST | -0.422048 | 0.896116 | 0.098707 | 0.000291 | |
| 特征值 | 0.006779 | 0.001915 | 0.101072 | 0.000000 | |
| 贡献率/% | 76.52 | 21.62 | 1.86 | 0.00 | |
| 2011 | NDVI | 0.884668 | 0.360012 | -0.272001 | -0.117340 |
| WET | 0.096361 | -0.150426 | 0.483886 | -0.856703 | |
| NDBSI | -0.371816 | 0.175171 | -0.760776 | -0.502283 | |
| LST | -0.264253 | 0.903924 | 0.336288 | 0.001503 | |
| 特征值 | 0.012087 | 0.001373 | 0.000493 | 0.000045 | |
| 贡献率/% | 86.35 | 9.81 | 3.52 | 0.32 | |
| 2017 | NDVI | 0.754024 | 0.521000 | -0.363764 | -0.166456 |
| WET | 0.138999 | -0.162900 | 0.451211 | -0.866339 | |
| NDBSI | -0.525124 | 0.122000 | -0.698301 | -0.470889 | |
| LST | -0.369285 | 0.828900 | 0.420072 | 0.003639 | |
| 特征值 | 0.012189 | 0.001868 | 0.000870 | 0.000096 | |
| 贡献率/% | 81.14 | 12.43 | 5.79 | 0.64 | |
| 2020 | NDVI | 0.979386 | 0.168375 | -0.108091 | -0.027730 |
| WET | 0.121277 | -0.095843 | 0.980565 | -0.120821 | |
| NDBSI | -0.040842 | -0.001168 | -0.117323 | -0.992253 | |
| LST | -0.156290 | 0.981052 | 0.114207 | -0.008225 | |
| 特征值 | 0.007654 | 0.003033 | 0.000251 | 0.000003 | |
| 贡献率/% | 70.96 | 27.72 | 1.29 | 0.03 |
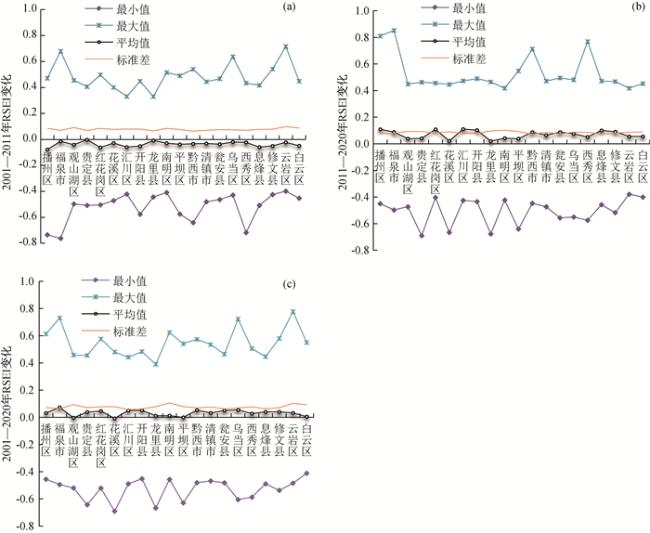
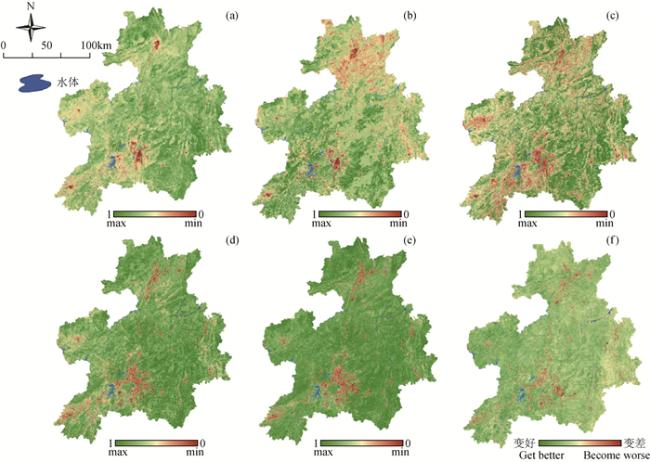
图3 2001—2020年黔中城市功能区生态环境质量指数及变化分布Figure 3 Ecological environment quality index and variation distribution of central Guizhou urban functional areas from 2001 to 2020 |
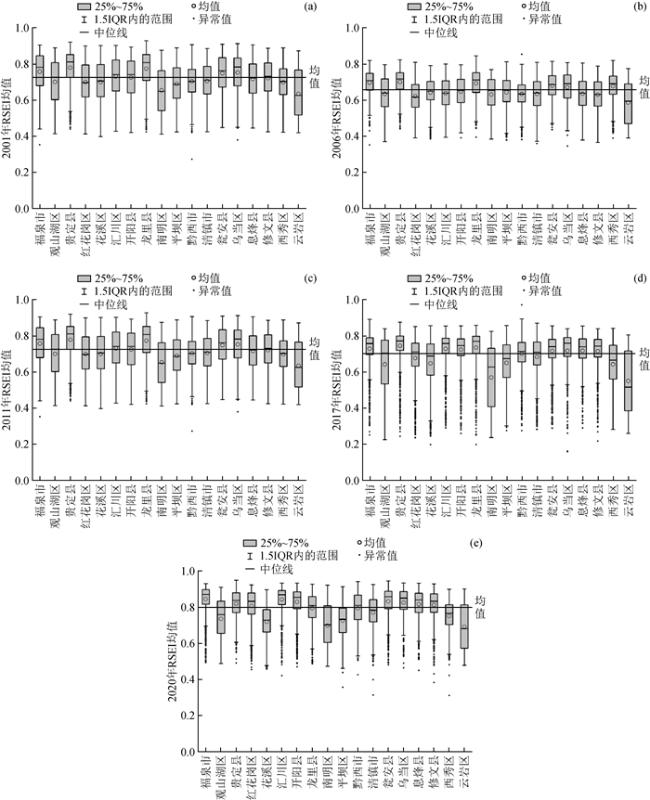
表2 各期RSEI统计表Table 2 RSEI statistics table for each period |
| 生态指数(RSEI) | 最小值 | 最大值 | 均值 | 标准差 |
| 2001 | 0 | 1 | 0.758 | 0.065 |
| 2006 | 0 | 1 | 0.652 | 0.083 |
| 2011 | 0 | 1 | 0.719 | 0.106 |
| 2017 | 0 | 1 | 0.697 | 0.110 |
| 2020 | 0 | 1 | 0.796 | 0.911 |
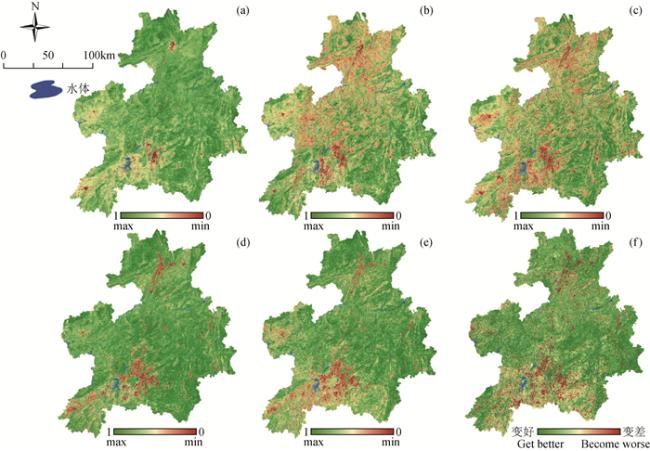
图7 2001—2020年黔中城市生态功能区植被覆盖度(FVC)图(a—e)及变化图(f)Figure 7 Vegetation coverage (FVC) map (a—e) and change map (f) of ecological function zone in central Guizhou city from 2001 to 2020 |
表3 各期FVC统计表Table 3 Statistics table for each period |
| 植被覆盖度(FVC) | 最小值 | 最大值 | 均值 | 标准差 |
| 2001 | 0 | 1 | 0.588 | 0.090 |
| 2006 | 0 | 1 | 0.648 | 0.089 |
| 2011 | 0 | 1 | 0.556 | 0.130 |
| 2017 | 0 | 1 | 0.735 | 0.116 |
| 2020 | 0 | 1 | 0.742 | 0.115 |
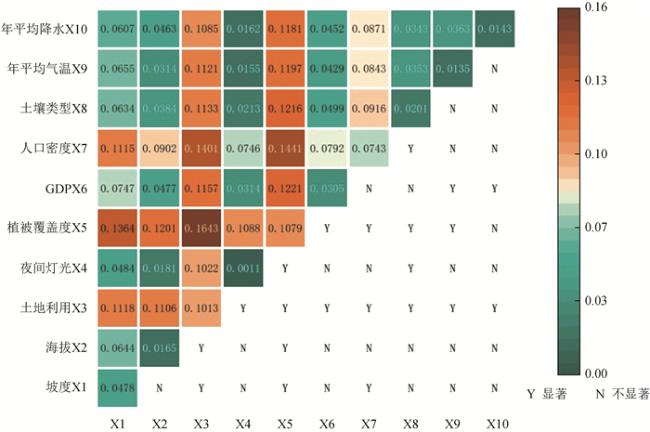
表4 单因子探测结果Table 4 The results of single detection |
| 探测因子 | 解释力q | 显著水平p | q值排序 | |
| 地形及土壤影响因子 | 海拔 | 0.017 | 0 | 7 |
| 坡度 | 0.048 | 0 | 4 | |
| 土壤类型 | 0.020 | 0 | 6 | |
| 人类活动影响因子 | 土地利用类型 | 0.101 | 0 | 2 |
| 夜间灯光 | 0.001 | 0 | 10 | |
| 人口密度 | 0.074 | 0 | 3 | |
| GDP | 0.031 | 0 | 5 | |
| 气候及植被影响因子 | 年平均降水 | 0.014 | 0 | 8 |
| 年平均气温 | 0.014 | 0 | 9 | |
| 植被覆盖度 | 0.108 | 0 | 1 | |
感谢审稿专家提出的修改意见和编辑部的大力支持!
|
|
|
|
|
|
|
|
|
|
|
|
|
|
|
|
|
|
|
|
|
|
|
|
|
|
|
|
|
|
|
|
|
|
|
|
|
|
|
|
|
|
|
|
|
|
|
|
|
|
|
|
|
|
|
|
|
|
|
|
|
|
|
|
|
|
|
|
|
|
|
|
|
|
|
|
|
|
|
|
|
|
|
|
|
|
|
|
|
|
|
|
|
|
|
|
|
|
|
|
|
|
|
|
|
|
|
|
|
|
|
|
|
|
/
| 〈 |
|
〉 |