
Study on the joint inversion of surface wave dispersion curves and H/V to obtain shear velocity and radial anisotropy of crust and uppermost mantle
Received date: 2023-09-15
Online published: 2024-12-19
Copyright
The radial anisotropy reflects the deformation of materials and the direction of principle stress. Currently, the dispersive characteristics of Love-wave and Rayleigh-wave phase and group velocities have been widely used to determine the shear velocity and radial anisotropy of crust and uppermost mantle. However, the shear velocity and radial anisotropy of the shallow crust especially the sediments are poorly constrained in the dispersion inversion within relatively long periods (e.g., >5 s). Furthermore, the inverted results at deeper depths can be biased due to inaccurate shear velocity and radial anisotropy at shallow depths in dispersion inversion. Compared to surface wave dispersion, the Rayleigh-wave Horizontal-to-Vertical (H/V) ratios of particle motion are particularly sensitive to shallower shear velocity. Based on the similar spatial resolution of surface-wave phase and group velocities and H/V, we propose a method for constructing Vs profiles and radial anisotropy based on the joint inversion of the Love-wave and Rayleigh-wave dispersion curves and H/V. According to the practical case of the western Bohai Bay Basin and synthetic test, the accuracy of the shear velocity and radial anisotropy of crust, especially the sediments, is considerably improved by the joint inversion including H/V. The proposed method is beneficial to further study on the state of crustal deformation and associated tectonic stress.
HongRui XU , TianJian CHENG , QiaoMu QI , JinChang FU , Chuan LI . Study on the joint inversion of surface wave dispersion curves and H/V to obtain shear velocity and radial anisotropy of crust and uppermost mantle[J]. Progress in Geophysics, 2024 , 39(5) : 1800 -1809 . DOI: 10.6038/pg2024HH0399
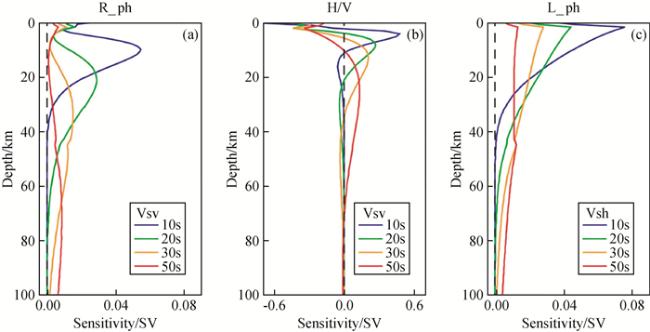
图1 周期10 s、20 s、30 s和50 s的(a)瑞雷面波相速度和(b)H/V以及(c)勒夫面波相速度分别对不同深度的Vsv和Vsh的敏感度,计算所用模型为Shen等(2016)发布的位于渤海盆地西缘的平均模型Figure 1 Sensitivity kernels of (a) Rayleigh-wave phase velocities, (b) H/V and (c) Love-wave phase velocities to perturbations of Vsv or Vsh at 10, 20, 30 and 40 s periods, which is based on the the averge model of western Bohai Bay Basin published from Shen et al. (2016) |
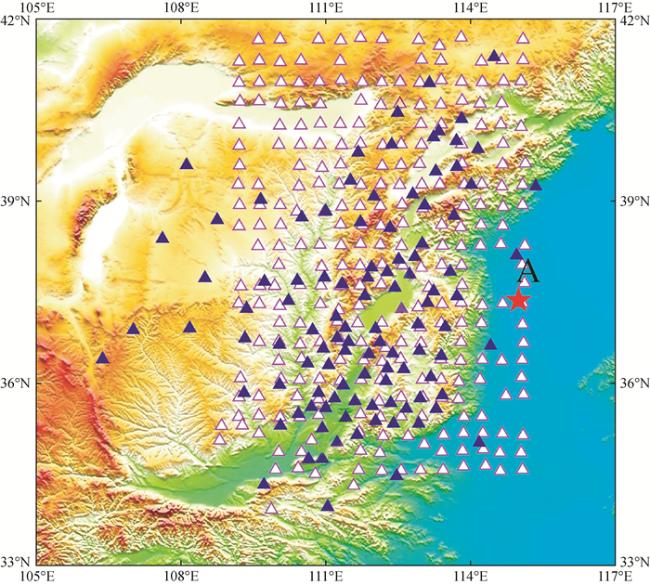
图2 研究区的地震台站分布图蓝色三角形代表研究中使用的106个EOBSArray台站(Xu et al., 2020).本文收集了Huang等(2021)基于白色三角形所示的ChinArray的295个地震台站测量的H/V.图中红色五角星标注了本文采用的实际案例的所在位置. Figure 2 The seismic station distributions in our study region The blue triangles represent the 106 EOBSArray stations(Xu et al., 2020). The white triangles mark the 295 seismic stations during the Phase Ⅲ deployment of the ChinArray Project among which we collect the H/V measurements from Huang et al. (2021). The red star denote the location of the practical case used in this study. |
 ,
,
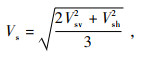
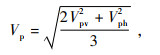
 ,其中,Vpv和Vph分别是沿垂直方向和水平方向传播的纵波速度,ρ是密度,η是一个无量纲的参数.由此可见,模型的主要参数是不同深度的Vsv, Vsh, Vph, Vpv, ρ, 以及横波速度的径向各向异性γ和纵波速度的径向各向异性ε.γ和ε的具体定义如下:
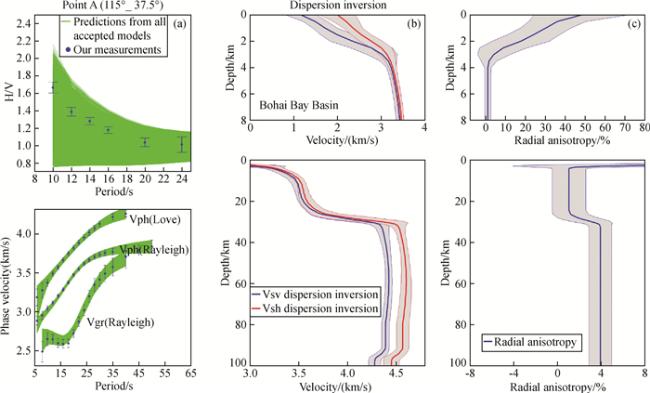
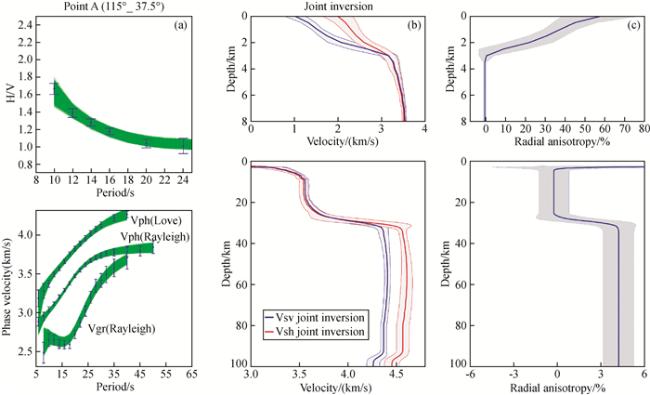
3 以图 2中点A为例,面波频散单独反演的结果(a)蓝色误差棒代表观测的面波频散和H/V及对应的不确定度,绿色实线代表基于MCMC反演方法得到的所有被接受模型正演预测的面波频散和H/V;(b)蓝色和红色实线分别代表所有被接受的Vsv和Vsh模型的平均值;(c)蓝色实线代表所有被接受模型的径向各向异性的平均值.在图(b,c)中,灰色区域的宽度代表所有被接受模型参数的标准差. The result of dispersion inversion at point A identified in Fig. 2 (a)The blue error bars represent the observed H/V and dispersion curves with associated uncertainties, the green lines represent the predictions computed from all accepted models from the MCMC inversion; (b) The means of the Vsv and Vsh distributions are identified with the blue and red lines; (c) The means of the radial anisotropy distributions are identified with blue lines. In (b, c), the one standard deviation contours of model parameters are shown with gray corridors. |
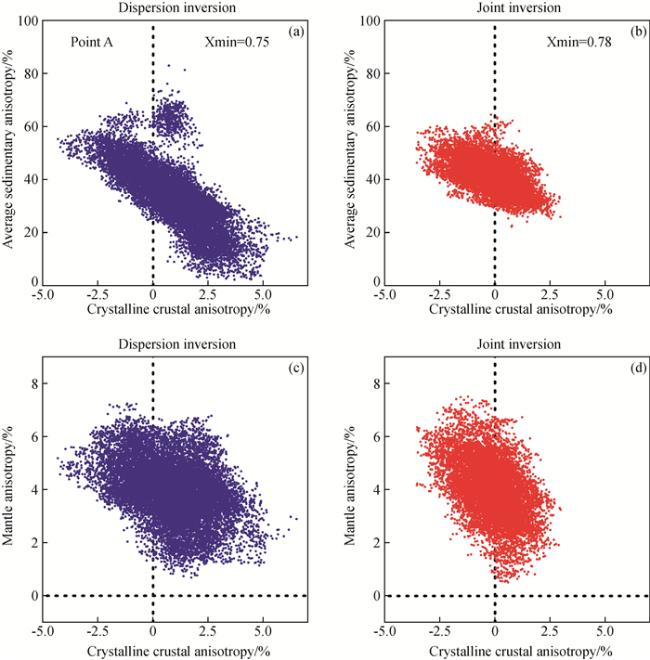
图5 以图 2中A点为例,(a)基于相速度频散单独反演和(b)联合反演得到的所有被接受模型的平均沉积层的径向各向异性与结晶地壳的径向各向异性的分布;(c,d)与(a,b)类似,但是为所有被接受模型的地幔的径向各项异性与结晶地壳的径向各向异性的分布Figure 5 The distributions of average sedimentary anisotropy and crystalline crustal anisotropy from all accepted models for point A based on (a) dispersion inversion and (b) joint inversion, respectively; (c, d) similar to (a, b), but for the distributions of mantle anisotropy and crystalline crustal anisotropy from all accepted models |
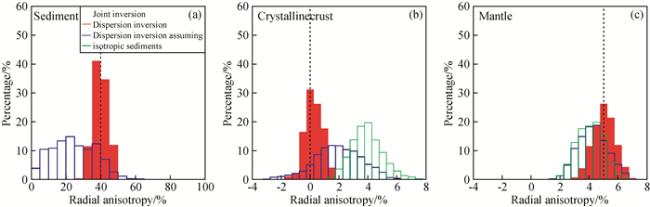
6 基于理论模型反演计算得到的(a)沉积层、(b)结晶地壳和(c)地幔的横波速度径向各向异性的后验概率分布蓝色和红色柱状图分别为面波相速度频散单独反演和引入H/V联合反演得到的径向各向异性的后验概率分布;此外,绿色柱状图为基于面波相速度频散反演并假设各向同性沉积层得到的径向各向异性的后验概率分布.本文采用的理论模型为Shen等(2016)发布的位于渤海盆地西缘的平均模型.黑色虚线代表理论模型的沉积层(40%)、结晶地壳(0%)和地幔(5%)的横波速度径向各向异性. The posterior distributions of (a) sedimentary, (b) crystalline crustal, (c) mantle anisotropy based on a synthetic mode The blue and red histograms represent the posterior distributions of radial anisotropy from dispersion inversion alone and joint inverson including H/V. Moreover, the green histogram represent the posterior distribution of radial ansitropy from dispersion inversion assuming isotropic sediments. The syethic model is the averge model of western Bohai Bay Basin published from Shen et al. (2016). The black dshed lines represent the radial anisotropy of sediment (40%), crystlline crust (0%) and mantle (5%) of the synthetic model, respectively. |
感谢审稿专家提出的修改意见和编辑部的大力支持!
|
|
|
|
|
|
|
|
|
|
|
|
|
|
|
|
|
|
|
|
|
|
|
|
|
|
|
|
|
|
|
|
|
|
|
|
|
|
|
|
|
|
|
|
|
|
|
|
|
|
|
|
|
|
|
|
|
|
|
|
|
|
|
|
|
|
|
|
|
|
|
|
|
|
|
|
|
|
|
|
|
|
|
|
|
|
|
|
|
|
|
|
|
|
|
|
|
|
|
|
|
|
|
|
|
|
|
|
|
|
/
| 〈 |
|
〉 |