
Forward modeling analysis and description of beach-bar sand reservoir with strong shielding
Received date: 2023-10-14
Online published: 2024-12-19
Copyright
Beach-bar sand reservoir is a common oil and gas reservoir developed in various basins in China. Although it has good potential for oil and gas development, it is difficult to describe. There are relatively few studies on seismic insider reflection characteristics of beach bar sand with strong shielding. In this paper, the finite difference forward modeling of acoustic equation is carried out for the beach bar sand with strong shielding. Through the forward modeling analysis of the seismic response of the beach bar sand reservoir with strong shielding under different conditions such as different main frequency, different formation velocity and multiple sets of sand bodies, we can see that the higher the main frequency is in a certain range, the smaller the formation velocity is, and the smaller the influence range of strong shielding on the thin layer is. For multiple groups of sand bodies, the seismic response often can not directly indicate the characteristics of sand bodies, and the weak reflection signal is the result of the superposition of multiple groups of sand bodies. Combined with Sanhebei industrial area in northern Jiangsu Basin, The research ideas and countermeasures of first lifting frequency and then shielding the last 90° phase shift can effectively separate the overburden cap layer in view of the double-compound beach bar sand reservoir with complex cap layer and weak reservoir signal. Then, the influence of strong reflection on the underlying reservoir is eliminated by the de-strong shielding process. Finally, the 90° phase shift technique is used to describe the beach bar sand body, and satisfactory results are obtained, which provides a feasible method for the exploration of such complex oil and gas reservoirs.
ZhiPeng GUI , QiQi SHAO , JunHua ZHANG , LianJun XIA , Zhen LUO , YouZhuang SUN . Forward modeling analysis and description of beach-bar sand reservoir with strong shielding[J]. Progress in Geophysics, 2024 , 39(5) : 1911 -1922 . DOI: 10.6038/pg2024HH0357
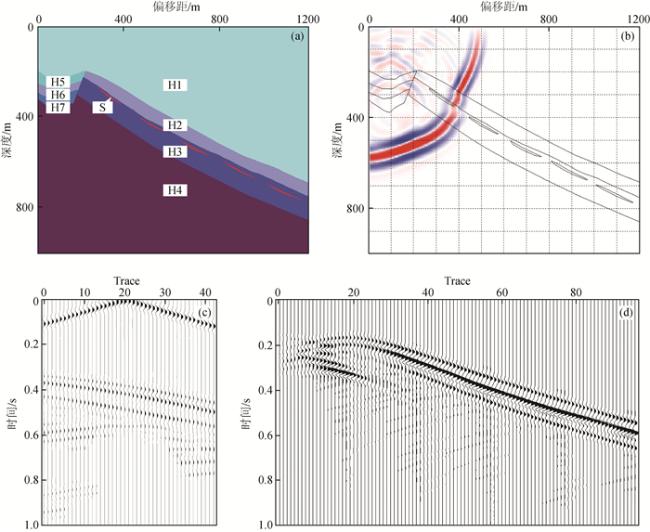
图2 正演模型及正演过程(a)速度模型; (b)波场快照; (c)单炮记录; (d)水平叠加. Fig 2 Model and process of forward (a) Velocity model; (b) Wave field snapshot; (c) Singleshot records; (d) Horizontal stacking. |
表1 速度模型参数Table 1 The parameters of velocity model |
| 参数 | H1 | H2 | H3 | H4 | H5 | H6 | H7 | S | |
| 低速 | 速度/(m/s) | 2300 | 2500 | 3000 | 3300 | 2400 | 2500 | 2800 | 3150 |
| 密度/(g/cm3) | 2.18 | 2.20 | 2.32 | 2.40 | 2.19 | 2.20 | 2.30 | 2.36 | |
| 中速 | 速度/(m/s) | 2500 | 2700 | 3500 | 3800 | 2600 | 2700 | 3000 | 3650 |
| 密度/(g/cm3) | 2.20 | 2.28 | 2.44 | 2.50 | 2.24 | 2.28 | 2.32 | 2.47 | |
| 高速 | 速度/(m/s) | 2800 | 3000 | 4000 | 4200 | 2900 | 3000 | 3200 | 4100 |
| 密度/(g/cm3) | 2.30 | 2.32 | 2.55 | 2.57 | 2.31 | 2.32 | 2.36 | 2.56 |
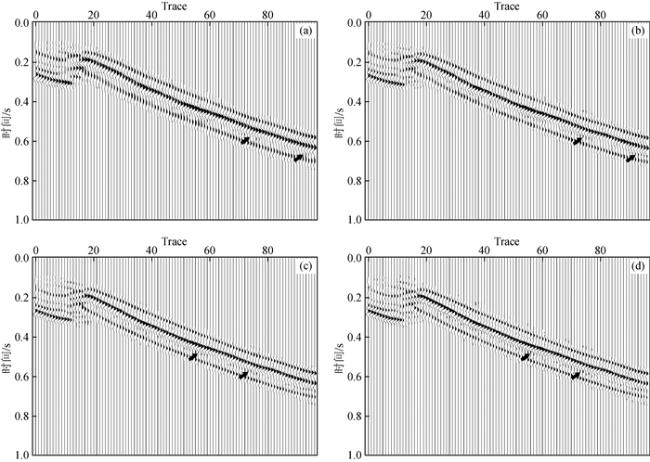
图3 低速模型不同主频叠后时间偏移剖面(a)主频25 Hz正演结果; (b)主频30 Hz正演结果; (c)主频35 Hz正演结果; (d)主频40 Hz正演结果. Fig 3 Post-stack time offset profiles of different dominant frequencies for the low-speed model (a) Forward results at the dominant frequency of 25 Hz; (b) Forward results at the dominant frequency of 30 Hz; (c) Forward results at the dominant frequency of 35 Hz; (d) Forward results at the dominant frequency of 40 Hz. |
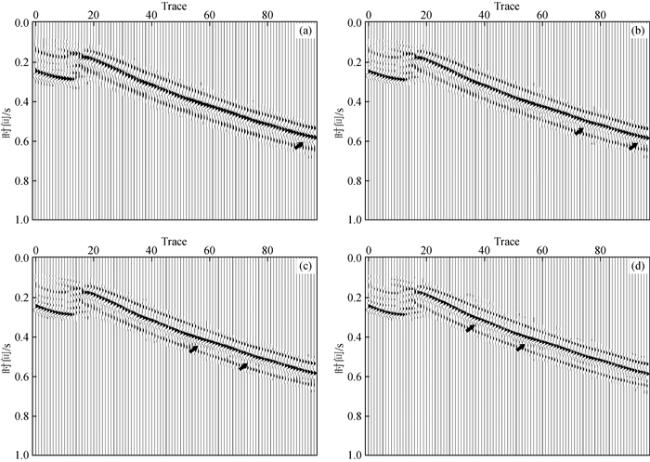
图4 中速模型不同主频叠后时间偏移剖面(a)主频25 Hz正演结果; (b)主频30 Hz正演结果; (c)主频35 Hz正演结果; (d)主频40 Hz正演结果. Fig 4 Post-stack time offset profiles of different dominant frequencies for the medium-speed model (a) Forward results at the dominant frequency of 25 Hz; (b) Forward results at the dominant frequency of 30 Hz; (c) Forward results at the dominant frequency of 35 Hz; (d) Forward results at the dominant frequency of 40 Hz. |
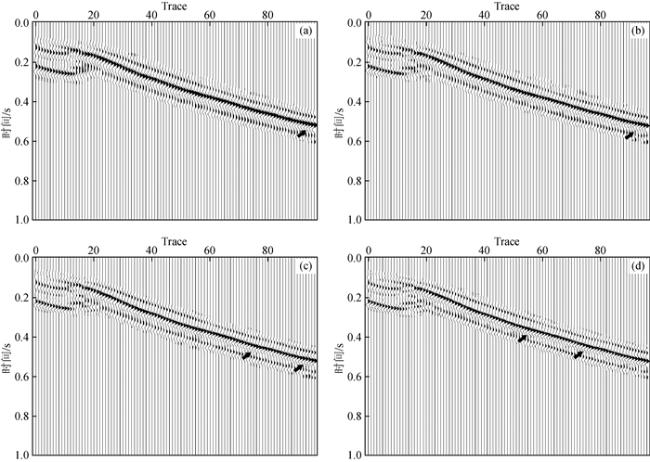
图5 高速模型不同主频叠后时间偏移剖面(a)主频25 Hz正演结果; (b)主频30 Hz正演结果; (c)主频35 Hz正演结果; (d)主频40 Hz正演结果. Fig 5 Post-stack time offset profiles of different dominant frequencies for the high-speed model (a) Forward results at the dominant frequency of 25 Hz; (b) Forward results at the dominant frequency of 30 Hz; (c) Forward results at the dominant frequency of 35 Hz; (d) Forward results at the dominant frequency of 40 Hz. |
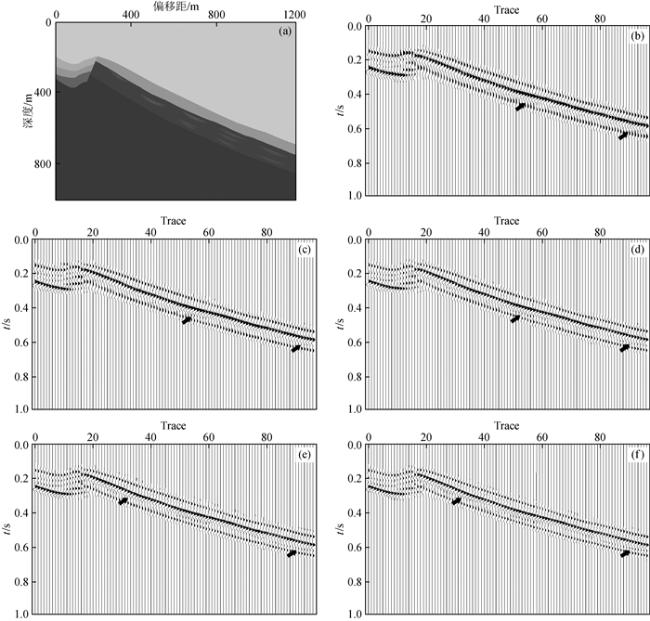
图6 多套砂组地震响应特征(a)正演模型; (b)主频25 Hz正演结果; (c)主频30 Hz正演结果; (d)主频35 Hz正演结果; (e)主频40 Hz正演结果; (f)主频45 Hz正演结果. Fig 6 Seismic response characteristics of multiple sets of sand groups (a) Forward model; (b) Forward results at the dominant frequency of 25 Hz; (c) Forward results at the dominant frequency of 30 Hz; (d) Forward results at the dominant frequency of 35 Hz; (e) Forward results at the dominant frequency of 25 Hz; (f) Forward results at the dominant frequency of 30 Hz. |
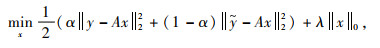
 表示高斯滤波后的频谱结果,α表示信噪比程度,0≤α≤1,λ为正则项,其他参数如式(6)所示:
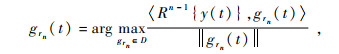
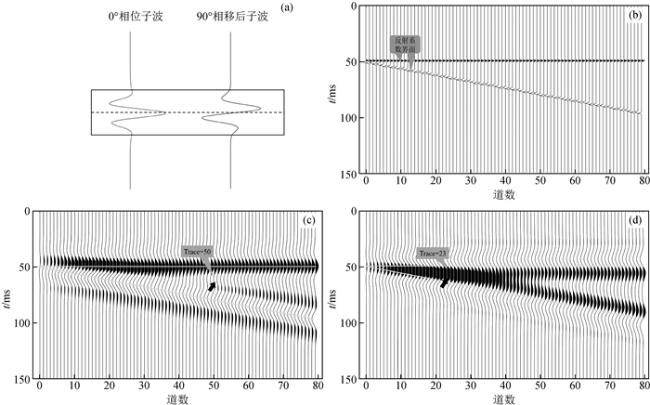
 表示对原子进行归一化处理.最后,对剥离强层后的地震剖面进行90°相移处理.
图7 零相位子波与90°相移子波分辨能力对比(a)不同子波对比; (b)反射系数剖面; (c)零相位地震剖面; (d)90°相移剖面. Fig 7 Comparison of resolving power between zero phase wavelet and 90° phase shift wavelet (a) Comparison of different wavelet; (b) Reflection coefficient profile; (c) Zero phase seismic profile; (d) 90° phase shift profile. |

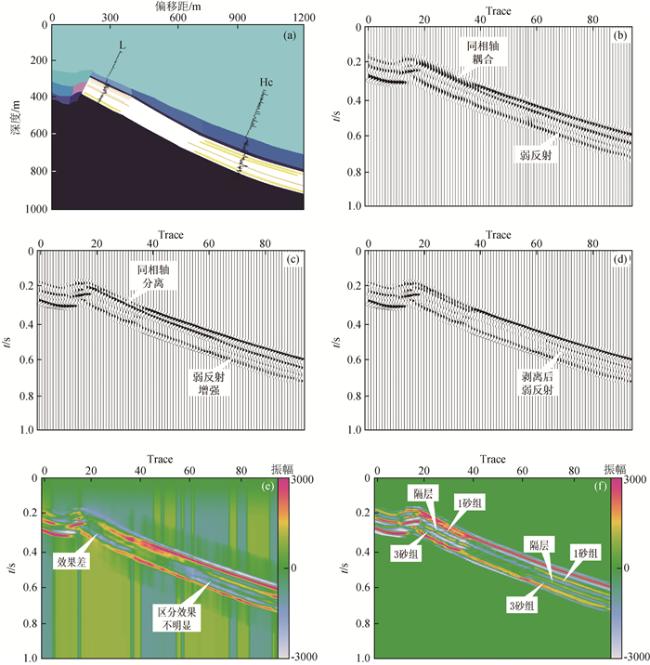
图8 模型验证(a)正演模型; (b)正演结果; (c)拓频结果; (d)去强屏蔽结果; (e)道积分剖面; (f)90°相移剖面. Fig 8 Model verification (a) Forward model; (b) The results of forward modelling; (c) The results of frequency extension; (d) The results of strong shielding removal; (e) Trace integration profile; (f) 90° phase shift profile. |
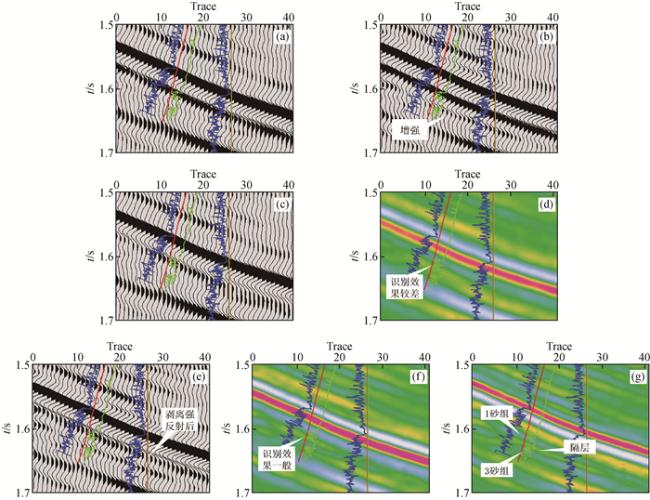
图10 实际资料处理(a)原始数据; (b)拓频结果; (c)不拓频去强屏蔽结果; (d)去强屏蔽后道积分剖面; (e)拓频后去强屏蔽结果; (f)对图(e)做道积分结果; (g)本文方法处理结果. Fig 10 Actual data processing (a) Original data; (b) The results of frequency extension; (c) The results of strong shielding removal without frequency extension; (d) Trace integration profile after strong shielding removal; (e) The results of strong shielding removal after frequency extension; (f) The resultd of trace integration of Fig.(e); (g) Processing results of methods in this paper. |
感谢审稿专家提出的修改意见和编辑部的大力支持!
|
|
|
|
|
|
|
|
|
|
|
|
|
|
|
|
|
|
|
|
|
|
|
|
|
|
|
|
|
|
|
|
|
|
|
|
|
|
|
|
|
|
|
|
|
|
|
|
|
|
|
|
|
|
/
| 〈 |
|
〉 |