
Design of multi-channel electromagnetic signal acquisition platform based on FPGA
Received date: 2023-10-18
Online published: 2024-12-19
Copyright
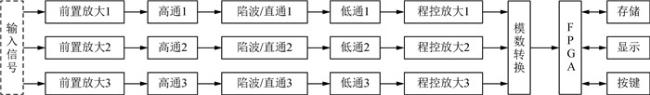
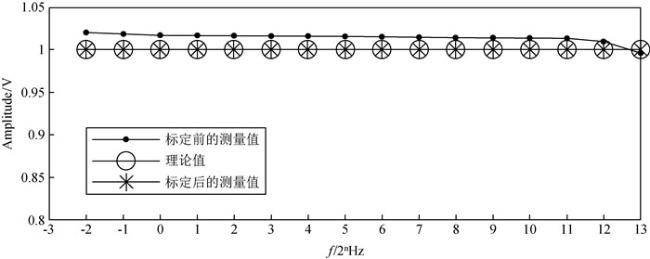
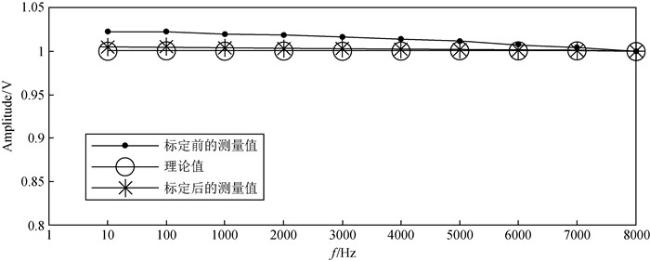
A 3-channel electromagnetic signal acquisition platform based on FPGA is designed by utilizing the rich on-chip resources and powerful parallel processing capability of FPGA. At the same time, the three signals can be pre-amplified, signal conditioning, analog-to-digital conversion and stored in the memory, and then processed by the upper computer. At room temperature, two sets of standard sinusoidal signals with frequency of 2n Hz(-2≤n≤13), and amplitude of 1 V are collected, after correction, the relative error between the actual measurement amplitude and the theoretical value of the acquisition platform is less than 0.1%, and the root mean square error of the channel is less than 0.024%. This platform has high acquisition accuracy and great potential for function expansion.
Hui CHENG , DongLin WEI , GuoHong FU . Design of multi-channel electromagnetic signal acquisition platform based on FPGA[J]. Progress in Geophysics, 2024 , 39(5) : 2034 -2045 . DOI: 10.6038/pg2024HH0343
表1 标定实验数据Table 1 Calibration experimental data |
| 测量频率2n/Hz | 理论值/V | 通道0 | 通道1 | 通道2 | |||||
| 测量值/V | 标定系数 | 测量值/V | 标定系数 | 测量值/V | 标定系数 | ||||
| -2 | 1 | 1.020065 | 0.98033 | 1.019942 | 0.980448 | 1.02007 | 0.980324 | ||
| -1 | 1 | 1.018271 | 0.982057 | 1.018207 | 0.982118 | 1.018333 | 0.981997 | ||
| 0 | 1 | 1.017161 | 0.983129 | 1.017071 | 0.983216 | 1.017196 | 0.983095 | ||
| 1 | 1 | 1.01656 | 0.98371 | 1.016458 | 0.983808 | 1.016582 | 0.983688 | ||
| 2 | 1 | 1.016293 | 0.983968 | 1.016196 | 0.984062 | 1.01632 | 0.983942 | ||
| 3 | 1 | 1.016046 | 0.984207 | 1.015952 | 0.984299 | 1.016075 | 0.98418 | ||
| 4 | 1 | 1.015583 | 0.984656 | 1.015488 | 0.984748 | 1.01561 | 0.984629 | ||
| 5 | 1 | 1.015415 | 0.984819 | 1.01532 | 0.984911 | 1.015442 | 0.984793 | ||
| 6 | 1 | 1.014926 | 0.985293 | 1.014831 | 0.985385 | 1.014953 | 0.985267 | ||
| 7 | 1 | 1.014411 | 0.985794 | 1.014318 | 0.985884 | 1.014438 | 0.985767 | ||
| 8 | 1 | 1.013959 | 0.986233 | 1.01387 | 0.98632 | 1.013989 | 0.986204 | ||
| 9 | 1 | 1.013677 | 0.986507 | 1.013594 | 0.986588 | 1.013712 | 0.986474 | ||
| 10 | 1 | 1.013492 | 0.986687 | 1.013419 | 0.986759 | 1.013534 | 0.986647 | ||
| 11 | 1 | 1.013037 | 0.987131 | 1.012985 | 0.987181 | 1.01309 | 0.987079 | ||
| 12 | 1 | 1.009493 | 0.990596 | 1.009509 | 0.99058 | 1.009578 | 0.990513 | ||
| 13 | 1 | 0.996261 | 1.003753 | 0.996492 | 1.00352 | 0.996423 | 1.00359 | ||
表2 各通道标定结果与理论值的对比Table 2 Comparison between the calibration results of each channel and the theoretical values |
| 测量频率2n/Hz | 理论值/V | 通道0 | 通道1 | 通道2 | |||||
| 标定结果/V | 误差/V | 标定结果/V | 误差/V | 标定结果/V | 误差/V | ||||
| -2 | 1 | 0.999891 | -0.00011 | 0.999879 | -0.00012 | 0.999878 | -0.00012 | ||
| -1 | 1 | 0.999928 | -0.000072 | 0.999919 | -0.000081 | 0.99992 | -0.00008 | ||
| 0 | 1 | 1.000016 | 0.000016 | 1.000018 | 0.000018 | 1.000017 | 0.000017 | ||
| 1 | 1 | 0.999993 | -0.000007 | 0.999996 | -0.000004 | 0.999996 | -0.000004 | ||
| 2 | 1 | 0.999969 | -0.000031 | 0.999969 | -0.000031 | 0.999969 | -0.000031 | ||
| 3 | 1 | 0.999957 | -0.000043 | 0.999957 | -0.000043 | 0.999957 | -0.000043 | ||
| 4 | 1 | 1.000015 | 0.000015 | 1.000015 | 0.000015 | 1.000015 | 0.000015 | ||
| 5 | 1 | 1.000004 | 0.000004 | 1.000003 | 0.000003 | 1.000003 | 0.000003 | ||
| 6 | 1 | 0.999997 | -0.000003 | 0.999998 | -0.000002 | 0.999998 | -0.000002 | ||
| 7 | 1 | 0.999999 | -0.000001 | 0.999999 | -0.000001 | 0.999999 | -0.000001 | ||
| 8 | 1 | 0.999993 | -0.000007 | 0.999991 | -0.000009 | 0.999992 | -0.000008 | ||
| 9 | 1 | 0.999976 | -0.000024 | 0.999976 | -0.000024 | 0.999975 | -0.000025 | ||
| 10 | 1 | 1.000088 | 0.000088 | 1.000087 | 0.000087 | 1.000087 | 0.000087 | ||
| 11 | 1 | 0.999982 | -0.000018 | 0.999983 | -0.000017 | 0.999983 | -0.000017 | ||
| 12 | 1 | 0.999872 | -0.000128 | 0.999871 | -0.000129 | 0.999871 | -0.000129 | ||
| 13 | 1 | 1.000238 | 0.000238 | 1.000237 | 0.000237 | 1.000238 | 0.000238 | ||
表3 验证实验数据Table 3 Verify experimental data |
| 测量频率/Hz | 理论值/V | 标定结果/V | 误差/V |
| 10 | 1 | 1.004450 | 0.004450 |
| 100 | 1 | 1.005058 | 0.005058 |
| 1000 | 1 | 1.003713 | 0.003713 |
| 2000 | 1 | 1.002986 | 0.002986 |
| 3000 | 1 | 1.002752 | 0.002752 |
| 4000 | 1 | 1.002075 | 0.002075 |
| 5000 | 1 | 1.001984 | 0.001984 |
| 6000 | 1 | 1.001677 | 0.001677 |
| 7000 | 1 | 1.000794 | 0.000794 |
| 8000 | 1 | 0.999534 | -0.00046 |
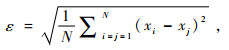
表4 各通道的均方根误差Table 4 Root mean square error of each channel |
| 测试通道 | 通道0 | 通道1 | 通道2 |
| 均方根误差/% | 0.020 | 0.021 | 0.024 |
感谢审稿专家提出的修改意见和编辑部的大力支持!
|
|
|
|
|
|
|
|
|
|
|
|
|
|
|
|
|
|
|
|
|
|
|
|
|
|
|
|
/
| 〈 |
|
〉 |