
Research on the influencing factors of gravity station construction test: a case study of Yanziyan station in Yunnan
Received date: 2024-02-26
Online published: 2025-01-14
Copyright
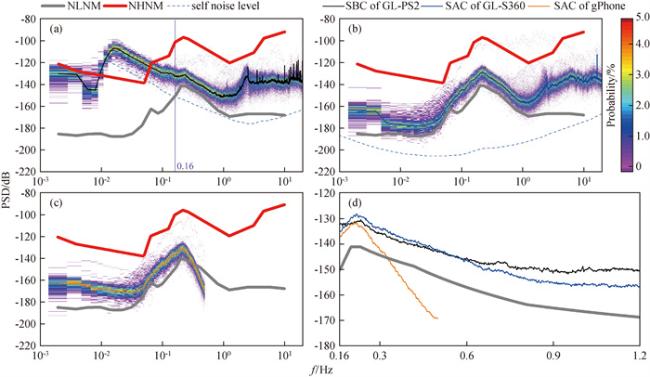
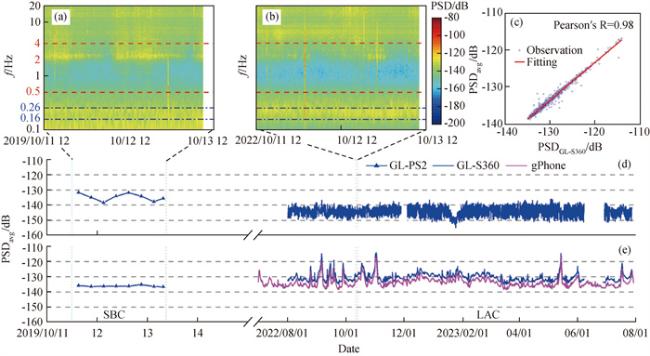
The construction of gravity observation facilities is an effective way to improve the signal-to-noise ratio of gravity observation data and to enhance the ability of instruments to detect weak signals. However, the gravity station construction tests are often affected by the testing strategy, the natural and site environment, which makes it impossible to accurately assess the construction effect of observation facilities. To this end, This paper collects the long-term observation datas of gPhone gravimeter and co-site seismometer of the four gravity stations in southwest Yunnan, as well as the test data before the construction of Yanziyan station, and uses the PSD-PDF method to calculate and compare the ambient noise before and after the construction of Yanziyan station, and analyzes and discusses the main factors and quantities affecting the test results of the gravity station building. The results show that: (1) the establishment of the observation cave of Yanziyan station can better suppress the 0.5~4 Hz high-frequency noise excited by near-field human activities, with a suppression quantity of 9.1 dB; however, the noise test results in the frequency band of 0.16~0.26 Hz vary greatly (17 dB) due to the influence of microseismic signals excited by far-field waves, and the annual variation (2~5 dB) and seasonal variation (4~8 dB) of the ambient noises are also larger than the noise variation before and after the Yanziyan station builting, which makes it impossible to determine whether the establishment of the observation cave has an inhibitory effect on the noise in the microseismic frequency band; (2) Compared with the test duration, the selection of the ambient noise test period for gravity station is more important, and the ambient noise of the microseismic frequency band from April to May in each year is characterized by a stable low value, which is an ideal ambient noise test window period; (3) The cross-correlation coefficient of power spectral density between gravimeter and co-site seismometer in southwestern Yunnan is 0.98 in the 0.16~0.26 Hz, which can be used for the integrated study of microseismic signals. The above research results can provide methods and basis for gravity station construction test, observation cave construction effect evaluation and joint multi-source data to carry out microseismic signal detection research.
Key words: Gravity; Influencing factors; PSD-PDF method; Background noise; Seasonal variation; ASSM
Wei FANG , Jin WEI , Ya HUANG , YouQi GU , MinZhang HU , GaoChuan LIU , QingGu CUI . Research on the influencing factors of gravity station construction test: a case study of Yanziyan station in Yunnan[J]. Progress in Geophysics, 2024 , 39(6) : 2126 -2136 . DOI: 10.6038/pg2024HH0556
表1 数据信息与仪器参数Table 1 Data information and instrument parameters |
| 序号 | 重力站名称 | 站点简称 | 仪器类型 | 仪器型号 | 频响范围 | 采样频率/Hz | 数据起至时间 | 数据时长 |
| 注:DC为Direct Current的简称,代表频率为0 Hz的直流信号. | ||||||||
| 1 | 燕子岩 | LUD | 地震计 | GL-PS2 | 2 s~50 Hz | 100 | 2019.10.11~13 | 45 h |
| 地震计 | GL-S360 | 360 s~50 Hz | 100 | 2022.08—2023.07 | 1.0 a | |||
| 重力仪 | gPhone | DC~1 Hz | 1 | 2021.05—2023.07 | 2.1 a | |||
| 2 | 云龙 | YUL | 地震计 | BBVS-60 | 60 s~50 Hz | 100 | 2019.01—2023.04 | 4.3 a |
| 重力仪 | gPhone | DC~1 Hz | 1 | 2019.01—2023.04 | 4.3 a | |||
| 3 | 孟连 | MEL | 地震计 | JS-120 | 120 s~50 Hz | 100 | 2019.01—2023.04 | 4.3 a |
| 重力仪 | gPhone | DC~1 Hz | 1 | 2019.01—2023.04 | 4.3 a | |||
| 4 | 腾冲 | TCG | 地震计 | CTS-1 | 120 s~50 Hz | 100 | 2021.03—2023.04 | 2 a |
| 重力仪 | gPhone | DC~1 Hz | 1 | 2022.01—2023.04 | 1.3 a | |||
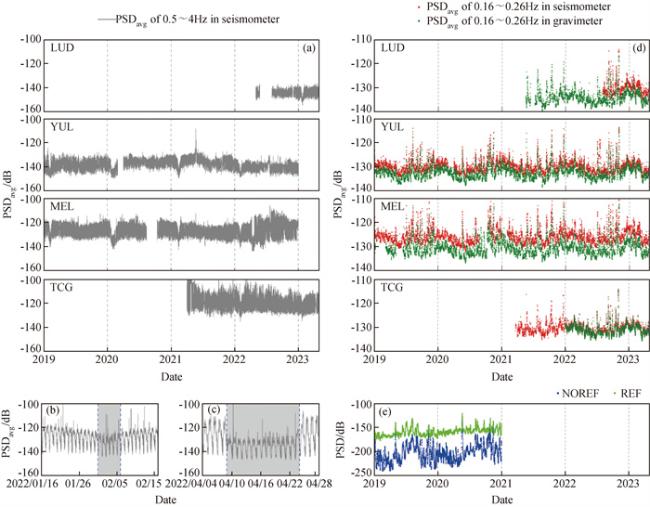
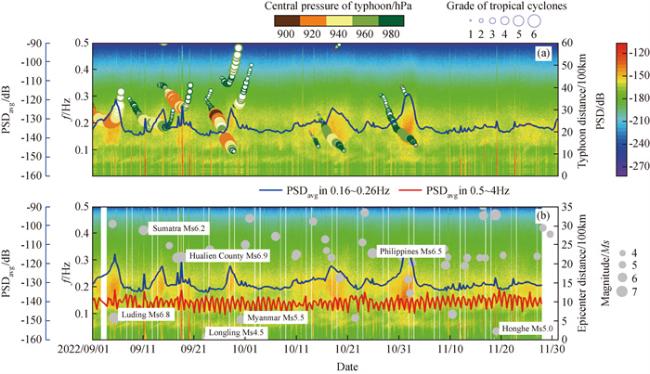
图3 滇西南同址重力仪和地震计功率谱密度(PSDavg)时变分析Fig 3 Time-varying analysis of co-site gravitometer and seismometer Power Spectral Density (PSDavg) in southwestern Yunnan |
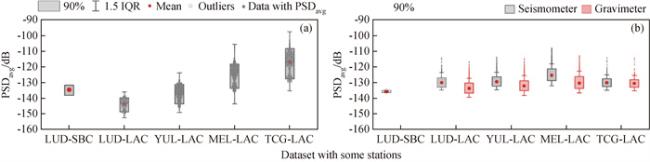
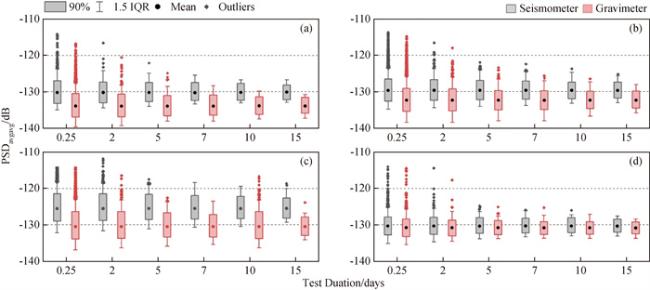
图4 滇西南同址重力仪和地震计在0.5~4 Hz高频段(a)和0.16~0.26 Hz微震频段(b)的功率谱密度(PSDavg)箱线图和数据分布情况Fig 4 The boxplot and data distribution of the Power Spectral Density (PSDavg) of co-site gravimeter and seismometer in the southwestern Yunnan with the 0.5~4 Hz high frequency bands (a) and 0.16~0.26 Hz microseismic bands (b) |
感谢国家重力台网中心提供重力观测数据,感谢审稿专家提出的修改意见和编辑部的大力支持.
|
|
|
|
|
|
|
|
|
|
|
|
|
|
|
|
|
|
|
|
|
|
|
|
|
|
|
|
|
|
|
|
|
|
|
|
|
|
|
|
|
|
|
|
|
|
|
|
|
|
|
|
|
|
|
|
|
|
|
|
|
|
|
|
|
|
|
|
|
|
|
|
|
|
|
|
|
|
|
|
|
|
|
|
|
|
|
|
|
|
|
|
|
|
|
|
|
|
|
|
|
|
|
|
|
|
|
|
/
| 〈 |
|
〉 |