
Extraction of interannual signals from superconducting gravimeter data and their characterization
Received date: 2023-12-26
Online published: 2025-01-14
Copyright
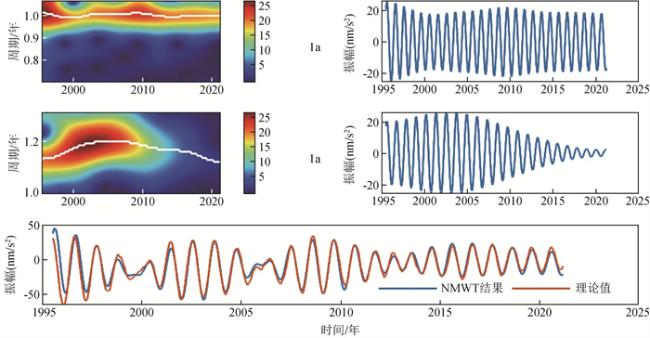
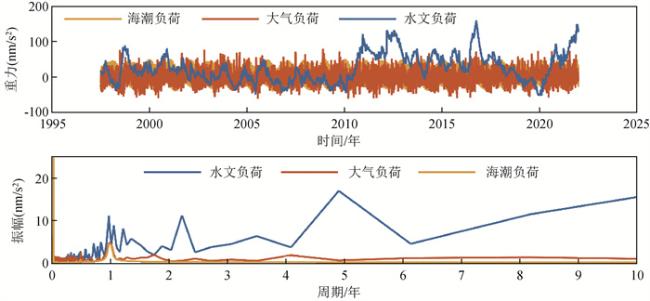
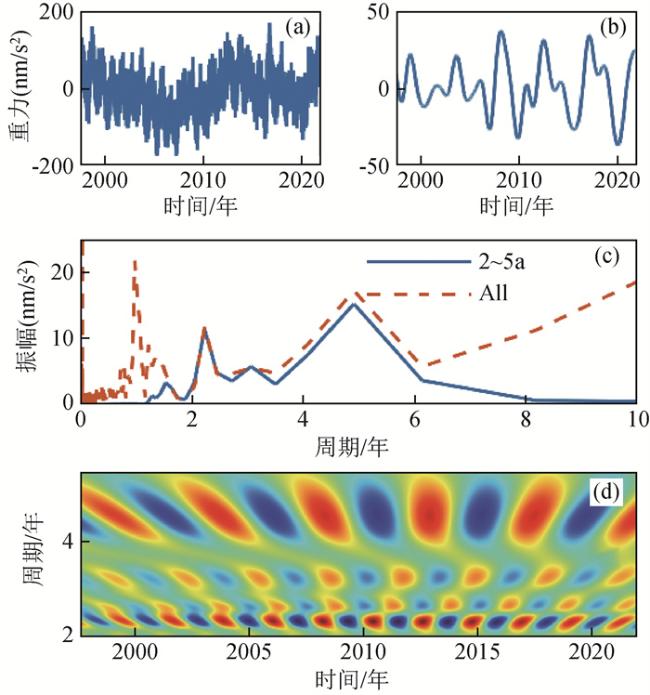
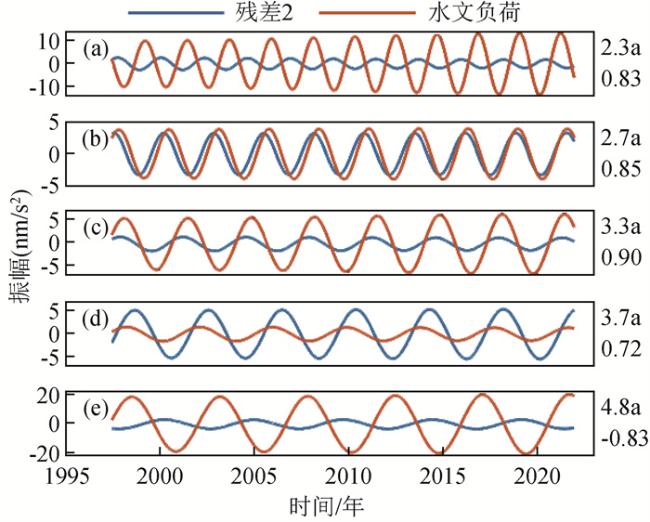
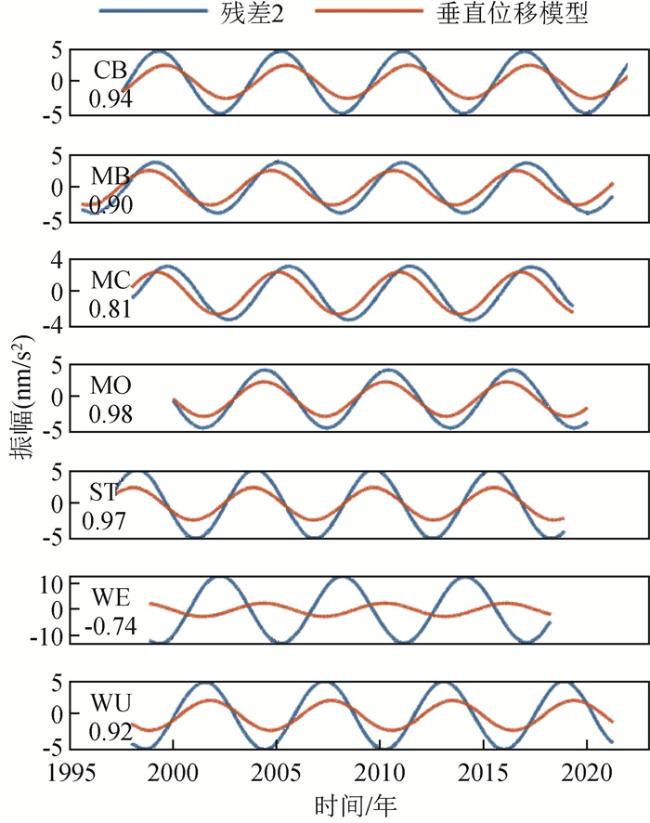
The gravity variation of the Earth is a comprehensive reflection of the global mass and its motion, and the superconducting gravimeter is capable of observing small changes in the gravity field. In order to characterize the cyclic variations of gravity on interannual scales and the physical mechanisms behind them, in this paper, for the observation data of seven superconducting gravimeter stations, after deducting the instrument drift, synthetic tide, and atmospheric loading effects to obtain the gravity residuals, the normal Morlet wavelet transform method is utilized to identify and extract the signals with the periods of 1 a and 1.2 a, respectively, and the gravimetric factors of the pole tide associated with the Chandler wobble are estimated by the least-squares method. Then residuals are deducted from gravity pole tide, obvious interannual signals common to the stations are extracted, which have periods of 2.3 a, 2.7 a, 3.3 a, 3.7 a, 4.8 a and 6 a, and their corresponding mean amplitudes are obtained in the time domain. The sources of these periodic signals are preliminarily analyzed, in which the variations on the 2 a to 5 a scales have a high correlation with hydrological loads, and the 6 a signals in the residuals are highly correlated with the sequence of gravity variations computed from the GNSS-observed model of the vertical displacements of the Earth's surface 6 a.
XiZhi HU , GenYou LIU . Extraction of interannual signals from superconducting gravimeter data and their characterization[J]. Progress in Geophysics, 2024 , 39(6) : 2137 -2152 . DOI: 10.6038/pg2024HH0487
表1 所选超导重力数据情况Table 1 The case of selected superconducting gravity data |
| 台站名称 | 仪器名称 | 经度和纬度 | 高程/m | 观测时段 |
| Canberra(CB) | GWR C031 | 35.3206°S, 149.0077°E | 762.75 | 1997-07-01—2021-12-31 |
| Medicina(MC) | GWR C023 | 44.5219°N, 11.6450°E | 28.00 | 1998-01-01—2019-04-30 |
| Membach(MB) | GWR C021 | 50.6085°N, 6.0095°E | 250.00 | 1995-08-05—2021-03-31 |
| Moxa(MO) | CD034_L | 50.6450°N, 11.6160°E | 455.00 | 2000-01-02—2019-12-31 |
| Strasbourg(ST) | GWR C026 | 48.6217°N, 7.6838°E | 180.00 | 1997-02-27—2018-11-12 |
| Wettzell(WE) | GWR CD029_U | 49.1440°N, 12.8780°E | 613.70 | 1998-11-05—2010-08-31, 2013-01-01—2018-03-31 |
| GWR CD030_U | 2010-09-01—2012-12-31 | |||
| Wuhan(WU) | GWR T004 TT70 C032 | 30.5159°N, 114.4898°E | 80.00 | 1997-12-21—2012-07-28 |
| OSG 065 | 30.5158°N, 114.4898°E | 89.30 | 2013-03-28—2021-03-31 |
表2 各台站重力残差中年际周期信号的周期和平均振幅Table 2 Period and average amplitude of the interannual cycle signal in the gravity residuals at each station |
 | CB | MB | MC | MO | ST | WE | WU |
| 1 | 19.7 | 20.1 | 8.2 | 18.2 | 28.3 | 18.2 | 17.3 |
| 1.2 | 14.0 | 15.3 | 17.9 | 12.3 | 15.2 | 14.9 | 11.0 |
| 2.3 | 2.19 | 7.20 | 2.57 | 1.53 | 4.37 | 3.82 | 7.71 |
| 2.7 | 3.3 | 4.4 | 2.3 | 2.5 | 7.8 | 8.0 | 4.3 |
| 3.3 | 1.4 | 1.1 | 3.9 | 4.3 | 2.6 | 2.3 | 11.3 |
| 3.7 | 5.3 | 4.2 | 2.7 | 2.6 | 2.5 | 2.3 | 3.2 |
| 4.8 | 3.2 | 9.0 | 8.3 | 12.9 | 4.9 | 5.8 | 2.1 |
| 6 | 4.6 | 3.7 | 3.9 | 4.3 | 5.4 | 4.3 | 5.2 |
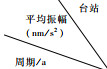
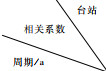
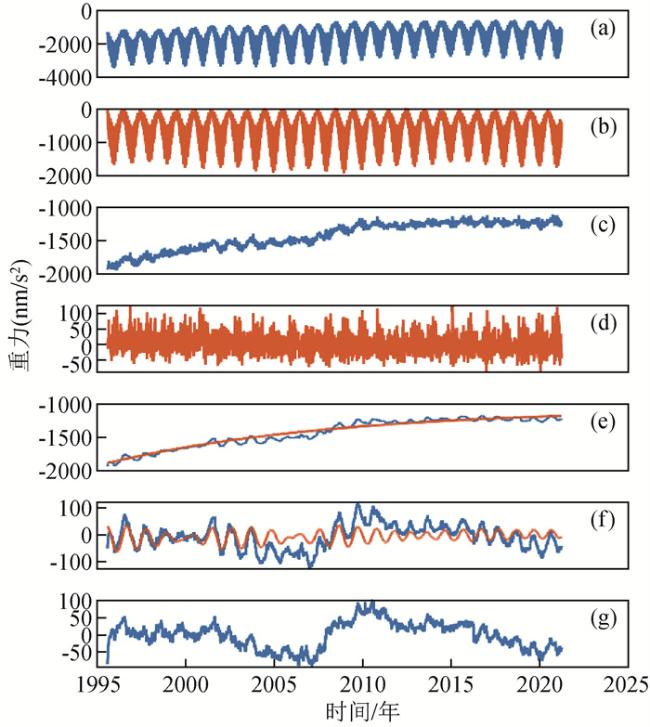
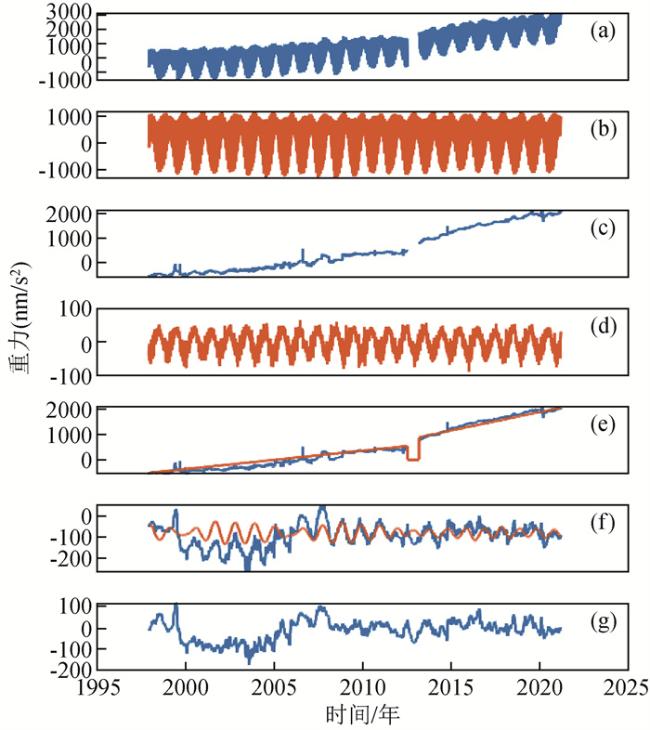
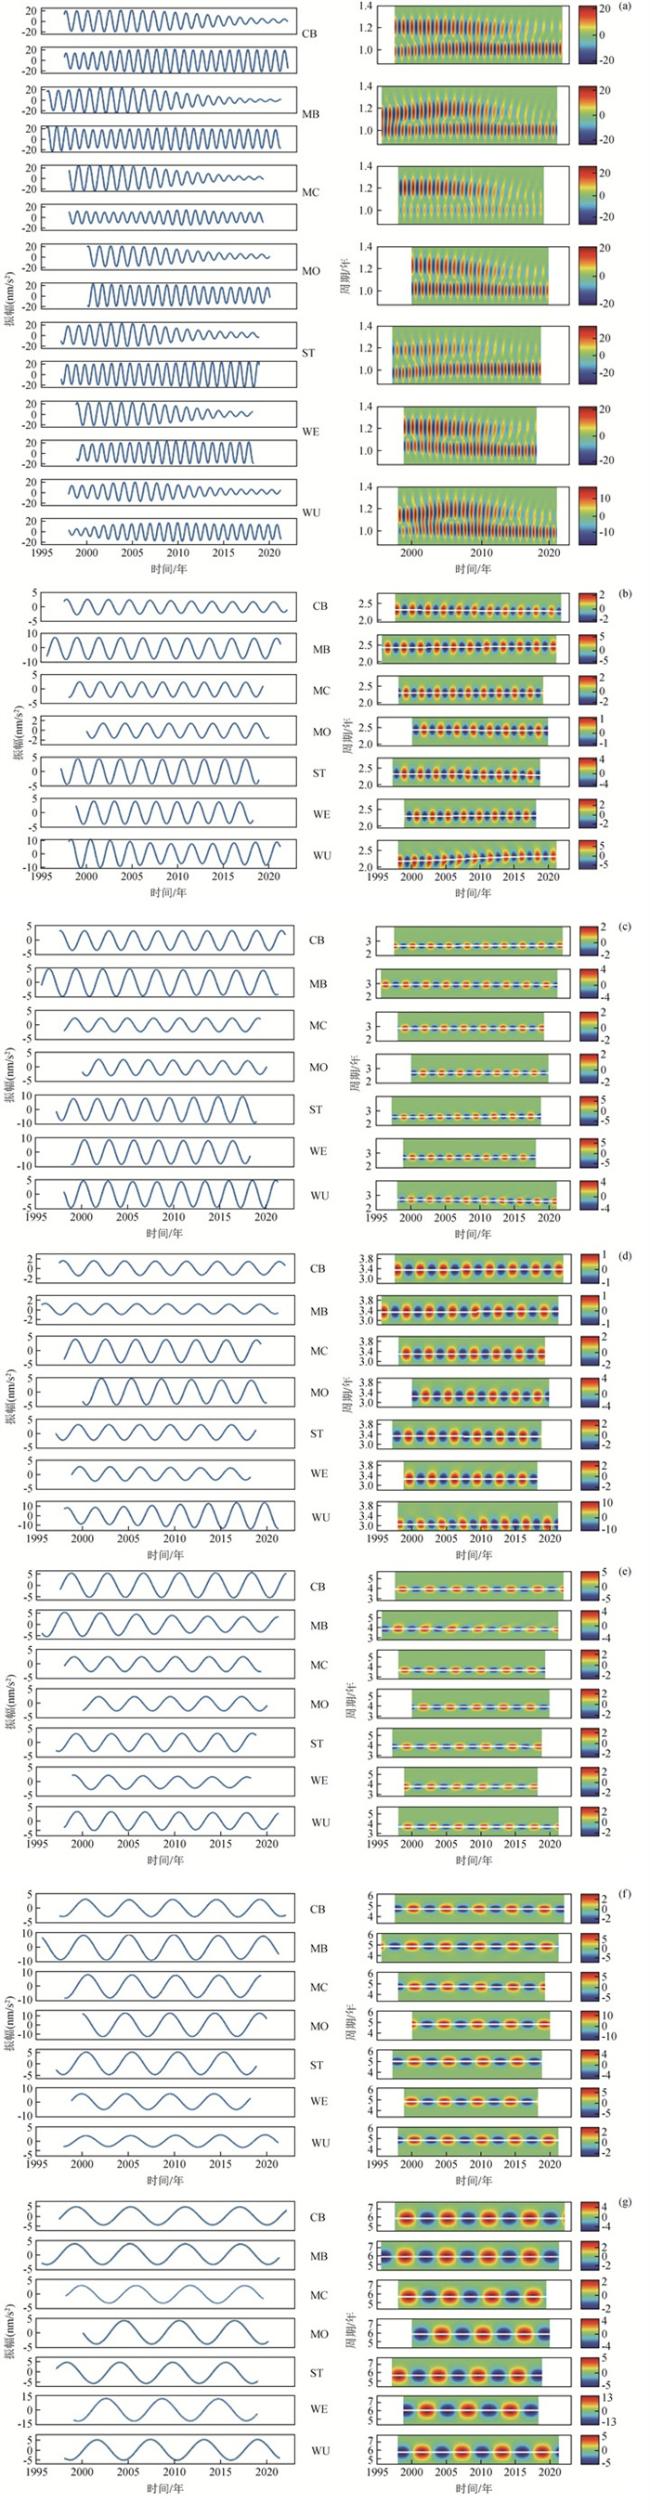
图6 各站时域提取的年际信号的周期、振幅和NMWT时频系数谱(a)1 a与1.2 a信号;(b)2.3 a信号;(c)2.7 a信号;(d)3.3 a信号;(e)3.7 a信号;(f)4.8 a信号;(g)6 a信号.图(a)左列子图每两行为同一台站的1 a和1.2 a信号,其中奇数行为1.2 a信号,偶数行为1 a信号. Fig 6 Period, amplitude and NMWT time-frequency coefficient spectra of the interannual signals extracted in the time domain from each station (a)1 a and 1.2 a signals; (b)2.3 a signal; (c)2.7 a signal; (d)3.3 a signal; (e)3.7 a signal; (f)4.8 a signal; (g)6 a signal. In the subgraph of the left column of (a), every two rows are 1 a and 1.2 a signals of the same station, where the odd rows are 1.2 a signals and the even rows are 1 a signals. |
表3 基于NMWT和极值点延拓策略、Daubechies小波滤波和EEMD得到的各台站Chandler周期的极潮潮汐因子Table 3 Pole tide gravimetric factors at the Chandler period at each station derived from NMWT and extreme point extension strategy, Daubechies wavelet filtering and EEMD |
| 台站 | 方法 | δ | κ/(°) |
| CB | NMWT+EPE | 1.1556±0.0092 | 0.0351±1.5009 |
| Daubechies | 1.0974±0.0144 | 11.1854±1.2708 | |
| EEMD | 1.2677±0.0122 | 16.7882±1.0961 | |
| MB | NMWT+EPE | 1.2295±0.0103 | 8.4993±0.6281 |
| Daubechies | 1.1400±0.0152 | 7.7133±1.0466 | |
| EEMD | 1.3165±0.0221 | -2.7277±1.8523 | |
| MC | NMWT+EPE | 1.1191±0.0099 | 0.9178±0.8698 |
| Daubechies | 1.1103±0.0127 | 4.5842±1.0548 | |
| EEMD | 1.3232±0.0216 | -2.2010±2.0141 | |
| MO | NMWT+EPE | 1.1648±0.0123 | 0.0087±0.9882 |
| Daubechies | 1.0599±0.0141 | 5.3561±1.0155 | |
| EEMD | 1.2874±0.0201 | 0.8317±1.3013 | |
| ST | NMWT+EPE | 1.2628±0.0338 | 2.7441±0.4809 |
| Daubechies | 1.2852±0.0424 | 19.3586±0.7759 | |
| EEMD | 1.1202±0.0831 | -3.0710±1.0014 | |
| WE | NMWT+EPE | 1.2010±0.0121 | 16.4063±0.5642 |
| Daubechies | 1.0890±0.0182 | 19.4593±0.8266 | |
| EEMD | 1.2602±0.0402 | 13.1109±1.4165 | |
| WU | NMWT+EPE | 1.2028±0.0137 | 12.4857±0.6156 |
| Daubechies | 1.0756±0.0173 | 4.6767±1.1960 | |
| EEMD | 1.2128±0.0637 | 9.1753±1.1708 |
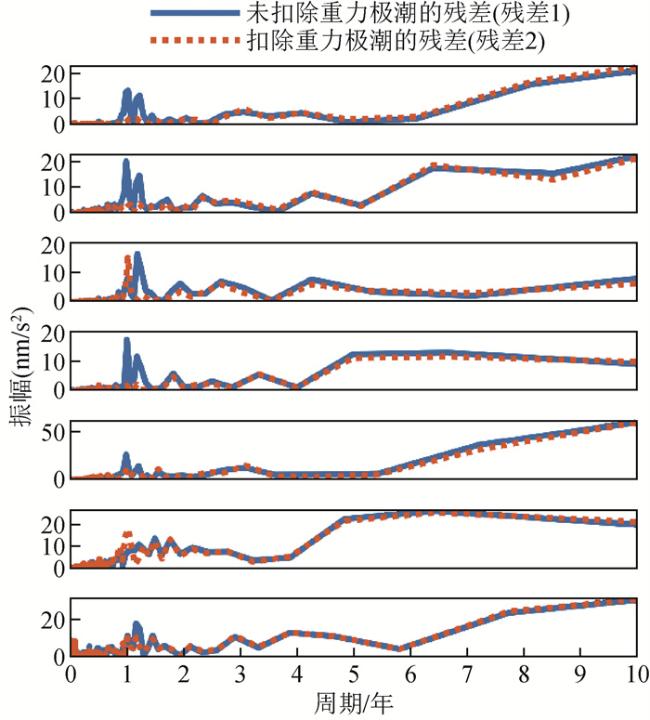
表4 各台站重力残差2与水文负荷中2~5年周期信号的相关系数Table 4 Correlation coefficients between the 2~5-year cycle signals extracted from the gravity residuals 2 and those extracted from the hydrologic loadings at each station |
 | CB | MB | MC | MO | ST | WE | WU |
| 2.3 | -0.83 | -0.74 | 0.63 | -0.86 | 0.69 | 0.78 | -0.18 |
| 2.7 | 0.85 | 0.82 | 0.89 | -0.12 | 0.73 | 0.67 | 0.94 |
| 3.3 | 0.90 | -0.82 | -0.73 | 0.70 | 0.86 | -0.54 | -0.95 |
| 3.7 | 0.72 | 0.70 | 0.61 | 0.75 | 0.61 | 0.43 | 0.68 |
| 4.8 | -0.83 | -0.85 | 0.93 | -0.95 | 0.57 | 0.62 | -0.92 |
感谢陈晓东副研究员提供了Wuhan站1997年12月至2021年3月的h1数据,IGETS提供了超导重力仪Level3数据,IGETS的Dr. Christoph Förste将超导重力仪数据库中Wuhan站部分错误的Level2数据予以及时修正,EOST Loading Service提供了地表重力载荷数据.
|
|
|
|
|
|
|
|
|
|
|
|
|
|
|
|
|
|
|
|
|
|
|
|
|
|
|
|
|
|
|
|
|
|
|
|
|
|
|
|
|
|
|
|
|
|
|
|
|
|
|
|
|
|
|
|
|
|
|
|
|
|
|
|
|
|
|
|
|
|
|
|
|
|
|
|
|
|
|
|
|
|
|
|
|
|
|
|
|
|
|
|
|
|
|
|
|
|
/
| 〈 |
|
〉 |