
Improved 1 -D Vp model from artificial seismic sounding profiles in eastern Guangdong
Received date: 2024-02-24
Online published: 2025-01-14
Copyright
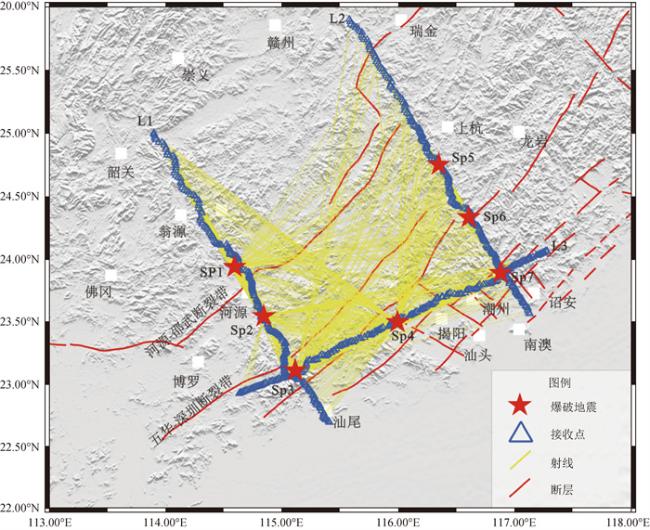
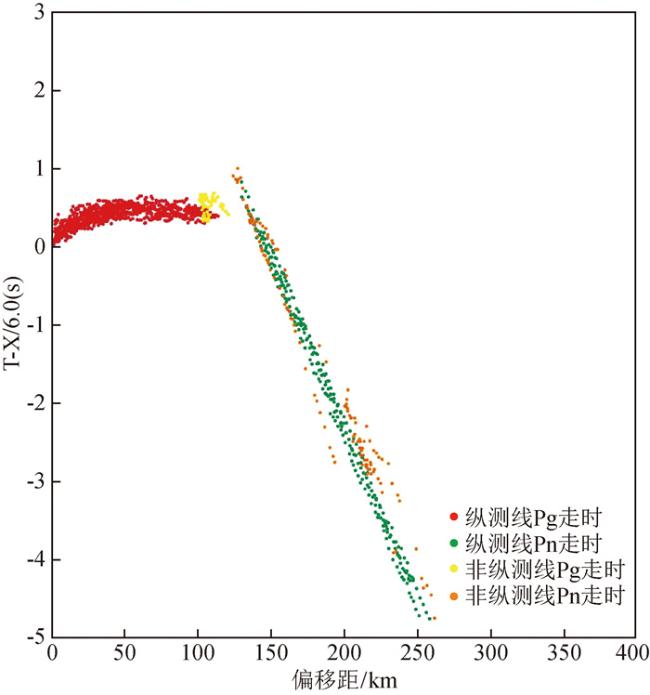
The eastern Guangdong is situated on the southeast coast, where active faults are prevalent, posing a certain risk of moderate to strong earthquake activity. Due to the limitations of previous data, the study of one-dimensional velocity models in this area is insufficient, which has restricted the progress of seismic location and crustal structure imaging to a certain extent. The advantage of studying the internal structure of the earth using artificial seismic data lies in accurately known source time and location. Based on data from a wide-angle reflection/refraction detection project carried out by the Geophysical Prospecting Center of Eastern Guangdong in 2021, we have analyzed Pg and Pn travel time data and utilized the minimum one-dimensional velocity model method (VELEST) to construct a one-dimensional P-wave velocity model in eastern Guangdong area. The results indicate that the crustal velocity structure in this area is relatively stable, with velocities above the basement (approximately 2 km) ranging from 4.49 to 5.74 km/s. The crustal velocity structure at a depth of 12 km can be divided into upper and lower layers, with velocities around 6.6 km/s for depths between 12~30 km in the middle and lower crust. Comparison reveals that the root mean square of travel time residual calculated by our one-dimensional velocity model for eastern Guangdong is relatively small at 0.28 s, with travel time residual statistics centered on 0.0 s indicating a concentrated distribution. This suggests that our model aligns more closely with actual crustal velocity structures within our study area. This new model provides a fundamental basis and reference for seismic location and tomography within this region's research efforts.
JiaJia SONG , ZhuoXin YANG , XiangHui SONG , ShuaiJun WANG , QingDong WANG , HanQi LIU , Liang WANG , XueYing ZHANG . Improved 1 -D Vp model from artificial seismic sounding profiles in eastern Guangdong[J]. Progress in Geophysics, 2024 , 39(6) : 2165 -2175 . DOI: 10.6038/pg2024HH0589
表1 人工爆破激发记录表Table 1 The source parameters of dynamites |
| 人工地震炮点编号 | 东经/(°) | 北纬/(°) | 井深/m | 激发时间 | TNT药量/T |
| SP1 | 114.5917 | 23.9398 | 80 | 2021-07-07 01:30 13.562 | 2.5 |
| SP2 | 114.8424 | 23.5457 | 80 | 2021-07-10 01:30 14.498 | 2.5 |
| SP3 | 115.1110 | 23.1110 | 80 | 2021-07-26 01:30 13.908 | 2.5 |
| SP4 | 115.9888 | 23.4981 | 80 | 2021-07-31 01:30 14.366 | 2.5 |
| SP5 | 116.3414 | 24.7506 | 80 | 2021-12-27 01:30 16.848 | 2.5 |
| SP6 | 116.5997 | 24.3330 | 80 | 2021-12-29 01:30 15.848 | 2.5 |
| SP7 | 116.8711 | 23.8901 | 80 | 2021-08-11 01:30 15.611 | 2.5 |
图11 粤东一维P波速度模型计算结果(初始模型为平均模型)(a)粤东一维速度模型与珠江口模型、TF模型、Crust1.0模型、华南模型及平均模型的对比;(b)不同速度模型对应走时均方根差的变化;(c)粤东一维P波速度模型值. Fig 11 Calculation results of 1 -D P-wave velocity model for the eastern Guangdong (the initial model is the average model) (a) Comparison of 1 -D velocity model in eastern Guangdong with Zhu-jiang-kou model, TF model, Crust1.0 model, South China model and the average model; (b) The corresponding variation of travel time root mean square residuals (RMS) to different velocity model; (c) The values of Vp velocity model in the eastern Guangdong. |
图12 不同模型的走时残差直方图对比(a)、(b)、(c)、(d)依次为粤东一维模型与华南模型、Crust1.0模型、TF模型、珠江口模型的直方图对比. Fig 12 Comparison of traveltime residuals statistics to different models (a)、(b)、(c) and (d) show residual statistics comparison between the 1 -D model of the eastern Guangdong and the South China model, Crust1.0, TF-model and Zhu-jiang-kou model, respectively. |
本文所用图件由GMT(GMT: http://gmt.soest.hawaii.edu/)软件绘制.感谢中国地震局地球物理勘探中心参与粤东项目的全体工作人员,感谢刘宝峰老师在本文震相分析及走时拾取中提供的宝贵建议.
|
|
|
|
|
|
|
|
|
|
|
|
|
|
|
|
|
|
|
|
|
|
|
|
|
|
|
|
|
|
|
|
|
|
|
|
|
|
|
|
|
|
|
|
|
|
|
|
|
|
|
|
|
|
|
|
|
|
|
|
|
|
|
|
|
|
|
|
|
|
|
|
|
|
|
|
|
|
|
|
|
|
|
|
|
|
|
|
|
|
|
|
|
|
|
|
|
|
/
| 〈 |
|
〉 |


