
Typical characteristics and progress in studies of the fluid injection-induced earthquake
Received date: 2023-08-31
Online published: 2025-01-14
Copyright
In recent years, large-scale global development of the shale gas, geothermal and other energy resources has led to a large number of seismic activities in some energy exploitation areas, which have caused great social impact. This has sparked the attention of experts and academics, extensive research has been carried out and a large number of reviews have been published. This paper focuses on the fluid injection-induced earthquake caused by three typical fluid injection activities, namely wastewater reinjection, hydraulic fracturing and enhanced geothermal system.Through a large number of literature research, the author comprehensively analyzed the research status and progress of the fluid injection-induced seismic activities, summarized the spatio-temporal characteristics of fluid injection-induced seismicies, and combed the research progress of source parameters and source mechanism solutions, stress and its changes, fluid injection-induced seismic prediction and risk management and control.After comprehensive analysis, We find that: 1.Seismicity induced by fluid injection is closely related to industrial operations in time, most of which occur during injection operation and peak seismic rate during injection operation. 2.The spatial distribution of fluid injection-induced seismicity correlates with the location of the operating wells, the depth of the operating reservoir and the distribution of pre-existing faults in the area. It mainly shows the characteristics of near well hole, shallow depth, and induced earthqukes cluster along the pre-existing faults. 3.The source parameters of some fluid injection induced earthquake, such as small stress drop and non-double force component of the source mechanism solution, but whether the source parameters and the non-double couple component of the source mechanism solution are still controversial as an indicator to identify induced earthquakes. 4.The stress study of fluid injection induced earthquakes can determine the regional stress field of induced earthquakes, evaluate the stress state of pre-existing faults, and simulate the change of pore pressure to determine the seismic mechanism of induced seismic activity.5.Although some understanding of the relevant research on induced seismic activity has been obtained, further case studies and richer theoretical studies are needed to determine the seismic mechanism and characteristics of the fluid injection induced earthquake.
Key words: Water disposal; Hydraulic fracturing; Enhanced geothermal system
Na ZHANG , LianQing ZHOU , ZhiHeng LI , ZengPing WEN . Typical characteristics and progress in studies of the fluid injection-induced earthquake[J]. Progress in Geophysics, 2024 , 39(6) : 2188 -2206 . DOI: 10.6038/pg2024HH0330
表1 与诱发地震相关的流体注入过程(改自Atkinson et al., 2020)Table 1 The fluid injection process associated with induced earthquakes(modified from Atkinson et al., 2020) |
| 工业活动 | 目的 | 典型的注水方式 | 作业储层 |
| 废水回注 | 将废(盐)水注入现有透水地层进行处置 | 用于注入废(盐)水的单口直井 | 可渗透储层,岩石能够快速摄取和传递注入的流体(如石灰岩). |
| 水力压裂 | 在富烃源岩中创造新的裂缝,以改进开采 | 在水平井或垂直井注入水或者支撑剂 | 低渗透率的高有机质含量烃源岩(油、气、凝析油, 如页岩) |
| 增强型地热系统 | 在地热发电过程中,为两个井之间的水循环创造/增强渗透途径 | 直井,在井间进行流体循环 | 低渗透热源,防止流体泄漏(如花岗岩) |
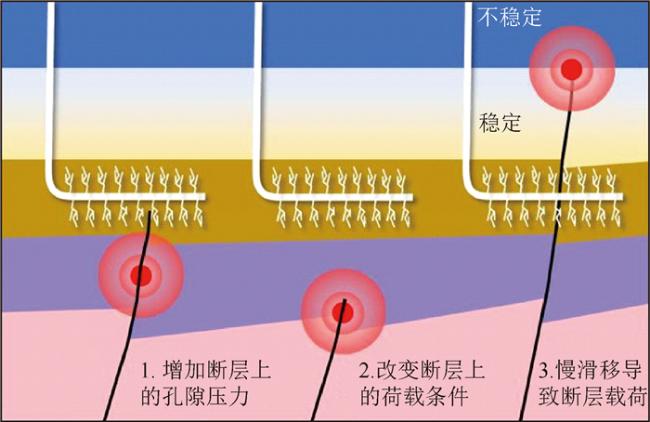
图1 流体注入诱发地震的三种诱发机制(引自张捷等, 2021)Fig 1 Three main mechanisms of the fluid injection induced earthquakes(modified from Zhang et al., 2021) |
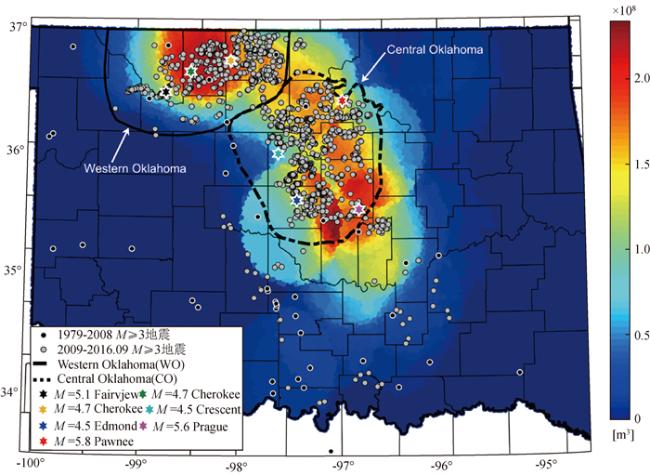
图2 美国Oklahoma州地区废水回注与地震活动分布(改自Langenbruch and Zoback., 2016; 张捷等,2021)背景颜色显示了俄克拉荷马州不同地区2009年至2015年12月期间注入废水累积体积(m3).黑色圆圈代表(1979—2008年的地震活动,灰色圆圈代表2009—2016- 09地震活动.彩色五角星代表几次M≥4.5地震活动. Fig 2 Waste saltwater disposal and earthquakes in Oklahoma (modified from Langenbruch and Zoback, 2016; Zhang et al., 2021) The background color shows the cumulative volume (m3) of saltwater injected into the Arbuckle formation between 2009 and December 2015 in different areas of Oklahoma. Black circles are earthquakes from 1979—2008, Gray circles are earthquakes from 2009—2016.09. Colored stars show the locations of M≥4.5 earthquakes. |
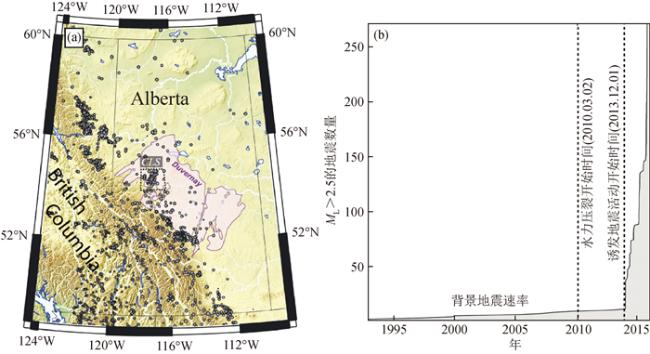
图3 加拿大Duvernay Play地区地震活动的空间和时间分布(改自Schultz et al., 2017;张捷等,2021)(a)浅紫色区域为Duvernay Play区域,灰色圆圈代表地震活动,CLS虚线框为the Crooked Lake序列; Fig 3 Spatial and temporal distribution of seismic activity in Duvernay Play, Canada (modified from Schultz et al., 2017; Zhang et al., 2021) (a) Purple area shows the Duvernay Formation, the gray circles show the seismicity, CLS dashed lines show the the Crooked Lake Sequences; |
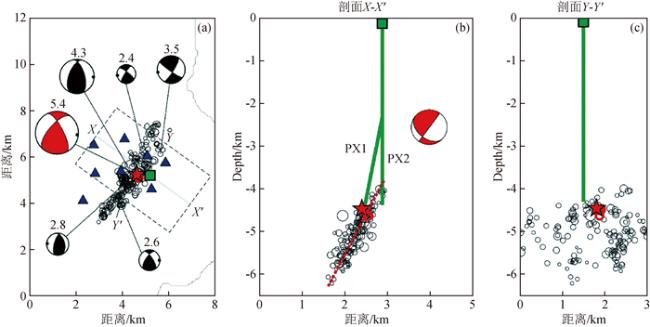
图4 诱发地震活动典型空间分布图(修改自Kim et al., 2018)(a)Pohang序列主震(红色五角星)、前震(红色圆),震后3 h的余震(黑色空心圆)分布.绿色正方形为水力压裂操作井台.蓝色三角形为地震台.红色海滩球代表了主震的震源机制.黑色海滩球表示代表性余震的震源机制解; Fig 4 Typical spatial distribution of induced seismicity (modified from Kim et al., 2018) (a)Epicenters of foreshocks (red circles), mainshock (red star), and aftershocks (black open circles) recorded in the first 3 hours after the mainshock. The location of the Pochang EGS is indicated by a green square. Blue triangles represent the seismic stations. The red beach ball represents the source mechanism of the mainshock. Black beach balls show the focal mechanism solutions of the aftershocks; |
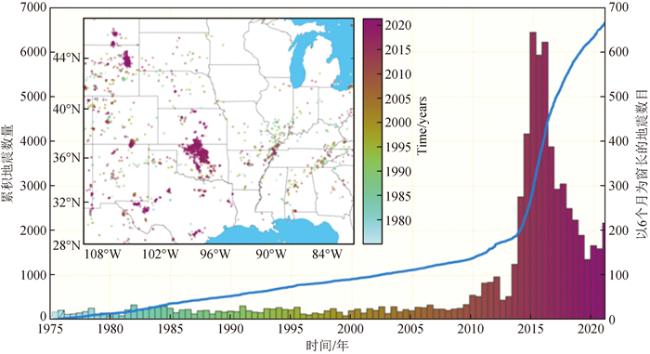
图5 1975年至2020年美国中大陆3级以上地震次数的演变数据来自USGS的ANSS目录(2017).统计数据显示,由于向美国俄克拉荷马州的Arbuckle地层注入大量废水,地震次数急剧增加.这个数字是Rubinstein和Mahani(2015)和Ellsworth(2013)的更新版本.图改自 https://eos.org/editors-vox/understanding-and-anticipating-induced-seismicity. Fig 5 Evolution of the number of earthquakes of a magnitude greater than 3 between 1975 and 2020 in mid-continental USA The data comes from the ANSS catalogue of USGS (2017). The statistics show the dramatic increase of the number of earthquakes attributed to the injection of significant amounts of wastewater into the Arbuckle formation in Oklahoma, USA. This figure is an update of versions by Rubinstein and Mahani (2015) and Ellsworth (2013)(modified from https://eos.org/editors-vox/understanding-and-anticipating-induced-seismicity). |
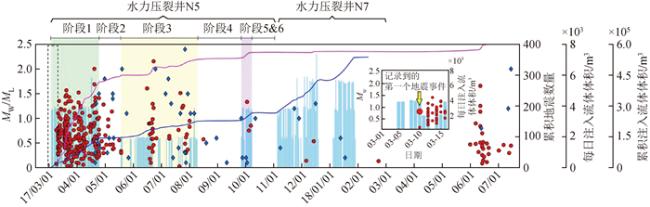
图6 中国长宁页岩气区块N5、N7井区地震活动和水力压裂操作的时间的关系(图改自Tan et al., 2020)插图显示了水压致裂(黑色虚线框)前10天记录到的地震.彩色矩形表示N5井水力压裂的不同阶段. Fig 6 Timing of the earthquakes and hydraulic fracturing stimulation at the studied well pads (modified from Tan et al., 2020) The inset shows the earthquakes recorded in the first 10 days of hydraulic fracturing (black dashed box). The colored rectangles denote the different phases of the fracturing process at the well pad N5. |
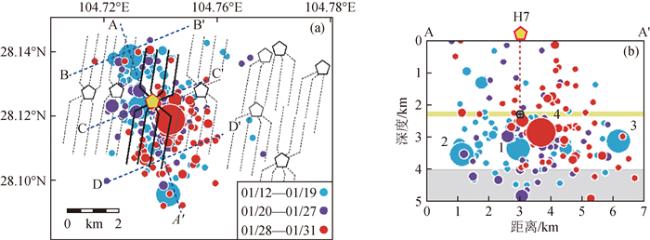
图7 诱发地震活动典型空间分布图以四川盆地2017- 01 -12—19期间由水力压裂引起的H7井附近地区的地震活动分布特征为例(引自Meng et al., 2019). (a)水平方向的分布;(b)垂直方向的分布.其中不同颜色代表不同发震时间段,圆表示地震活动,其大小代表着震级的大小;橙色线代表水力压裂井深,灰色代表基底深度. Fig 7 Typical spatial distribution of induced seismicity The distribution characteristics of seismic activity in the vicinity of well H7 caused by hydraulic fracturing during 2017- 01 -12—19 in Sichuan Basin (modified from Meng et al., 2019). (a) Horizontal distribution; (b) Vertical distribution. Among them, different colors represent different seismic times, circles represent seismicity and are scaled on the basis of magnitude; The orange line represents the depth of the hydraulic fracturing well, and the gray line represents the crystalline basement rocks. |
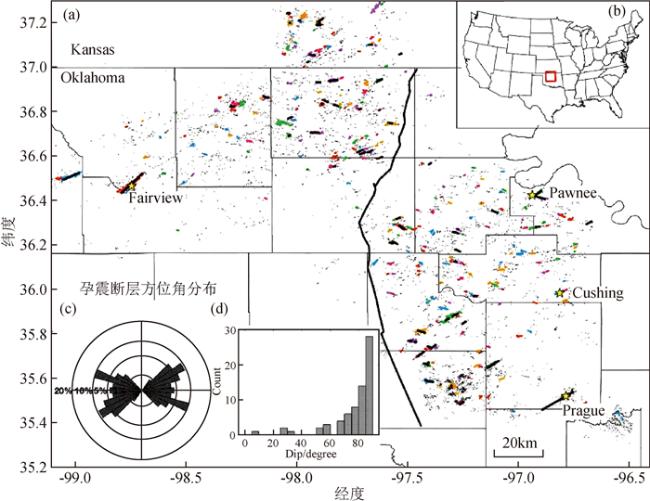
图8 基于俄克拉荷马州和堪萨斯州南部的诱发地震活动重定位结果刻画的断层分布(改自Qin et al., 2019)(a)地震丛以及所刻画断层分布.彩色代表有10个及以上地震事件的地震簇,黑色短线代表了30个及以上的事件刻画的断层.黄色五角星代表俄克拉荷马州4次M≥5地震的位置;(b)显示了研究区域的位置;(c)图(a)断层走向分布直方图;(d)图(a)断层倾角分布直方图. Fig 8 Mapped faults in Oklahoma and Southern Kansas based on the induced earthquake relocations (modified from Qin et al., 2019) (a)Earthquake clusters and mapped faults. colored dots represent the cluster with 10 and more events. the short black lines show the faults mapped from 30 and more events. Yellow stars show the location of four M≥5 earthquakes in Oklahoma; (b)The location of the study area; (c)Histogram of strike of faults in(a); (d)Histogram of dip of faults in(a). |
表2 根据不同场地的流体注入总结得到的孕震指数(改自Dinske and Shapiro, 2013)Table 2 Summary of the seismogenic indices of the fluid injection at different sites (modified from Dinske and Shapiro, 2013) |
| 场地位置 | 注水时间体积/m3 | 地震数量 | 震级 | b | Σ | |
| Basel (SUI) | 5.5 days | 10, 800 | 2313 | 1.0 | 1.65 | 0.4±0.1 |
| Cooper Basin (AUS) | 9 days | 14600 | 2834 | 0.0 | 0.75 | -0.95±0.05 |
| Ogachi (JP)1991 | 11 days | 10100 | 1504 | -2.0 | 0.74 | -2.65±0.1 |
| Ogachi (JP)1993 | 16 days | 20700 | 762 | -1.2 | 0.81 | -3.2±0.3 |
| Soultz (FR)1993 | 16 days | 25900 | 9550 | -1.0 | 1.38 | -2.0±0.1 |
| Soultz (FR)1995 | 11 days | 28500 | 3950 | -1.2 | 2.18 | -3.8±0.1 |
| Soultz (FR)1996 | 48 h | 13500 | 3325 | -1.2 | 1.77 | -3.1±0.3 |
| Soultz (FR)2000 | 6 days | 23400 | 6405 | 0.6 | 1.1 | -0.5±0.1 |
| Miscellaneous KTB (GER) | 9 h | 86 | 54 | -1.3 | 0.93 | -1.65±0.1 |
| KTB (GER)2004/2005 | 223 days | 64130 | 2405 | -1.0 | 1.1 | -4.2±0.3 |
| Paradox Valley (USA) | 1050 days | 1.7*106 | 2566 | 1.0 | 0.98 | -2.6±0.1 |
| BarnettShale (USA) | 6 days | 2840 | 844 | -3.0 | 2.86 | -9.25±0.05 |
| Cotton Valley (USA) A | 2.5 h | 1020 | 628 | -2.1 | 2.67 | -6.25±0.05 |
| Cotton Valley (USA) B | 2.5 h | 950 | 888 | -1.8 | 2.16 | -4.42±0.02 |
| Cotton Valley (USA) | 2.5 h | 333 | 369 | -2.0 | 4.12 | -9.42±0.06 |
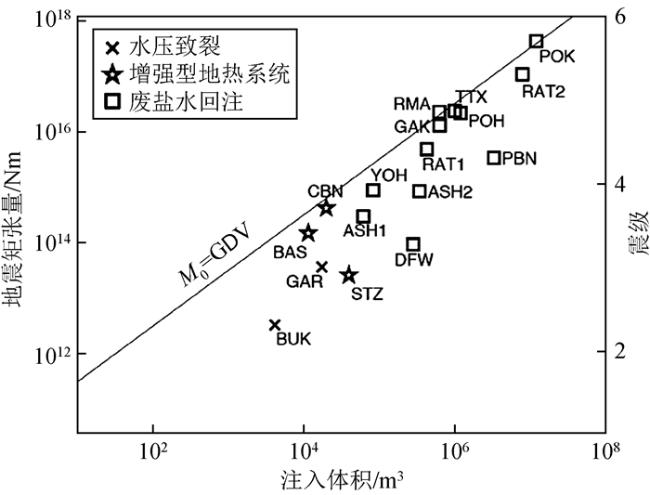
图9 最大震级(矩张量)与注入流体总量的关系估算(改自McGarr,2014)其中不同符号代表不同工业活动获得的数据. Fig 9 Estimation of the relationship between the maximum magnitude (moment tensor) and the total amount of injected fluid(modified from McGarr, 2014) The different symbols represent data obtained from different industrial activities. |
感谢审稿专家提出的修改意见和编辑部的大力支持!
|
|
|
|
|
|
|
|
|
|
|
|
|
|
|
|
|
|
|
|
|
|
|
|
|
|
|
|
|
|
|
|
|
|
|
|
|
|
|
|
|
|
|
|
|
|
|
|
|
|
|
|
|
|
|
|
|
|
|
|
|
|
|
|
|
|
|
|
|
|
|
|
|
|
|
|
|
|
|
|
|
|
|
|
|
|
|
|
|
|
|
|
|
|
|
|
|
|
|
|
|
|
|
|
|
|
|
|
|
|
|
|
|
|
|
|
|
|
|
|
|
|
|
|
|
|
|
|
|
|
|
|
|
|
|
|
|
|
|
|
|
|
|
|
|
|
|
|
|
|
|
|
|
|
|
|
|
|
|
|
|
|
|
|
|
|
|
|
|
|
|
|
|
|
|
|
|
|
|
|
|
|
|
|
|
|
|
|
|
|
|
|
|
|
|
|
|
|
|
|
|
|
|
|
|
|
|
|
|
|
|
|
|
|
|
|
|
|
|
|
|
|
|
|
|
|
|
|
|
|
|
|
/
| 〈 |
|
〉 |