
Model of permeability prediction for carbonate rocks based on digital cores
Received date: 2024-02-23
Online published: 2025-01-14
Copyright
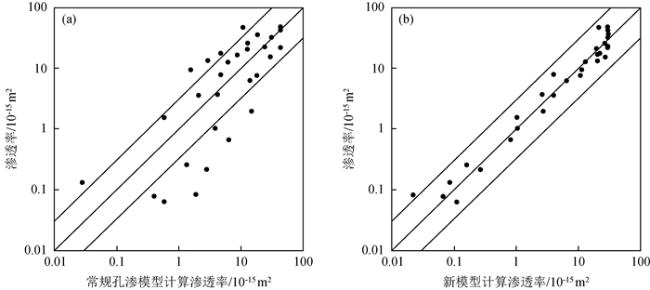
The strong heterogeneity and complex connectivity of carbonate reservoirs in the Moxi area of the Sichuan Basin result in significant errors in conventional logging prediction of permeability. In order to improve the accuracy of carbonate rock permeability prediction, a permeability prediction method based on digital core is proposed. This article takes the carbonate reservoir of the Dengying Formation in the Moxi area of the Sichuan Basin as an example, and constructs a three-dimensional digital core model based on core CT scanning data. Using connectivity algorithms to obtain connected pores, dividing each pore and throat through separation algorithms, and obtaining the geometric parameters of each pore and throat. After obtaining the geometric parameters of pores and throats, they are divided into two spatial types based on industry standards and existing research results: pores and cracks. The pore structure parameters and crack structure parameters are calculated separately. A comparative analysis was conducted on the correlation between different pore structure parameters and weighted pore structure parameters with permeability. Four pore structure parameters sensitive to permeability were selected, including average pore size, average pore throat ratio, average crack opening, and crack complexity. A multiple regression permeability prediction model was established. This article multiplies the pore structure parameters with the corresponding proportion of pore space to obtain weighted pore structure parameters, effectively improving the correlation between pore structure parameters and permeability. Compared with the traditional dual medium porosity and permeability model, this model reduces the average relative error of predicting permeability from 266.7% to 30.27%, and improves accuracy by approximately 236.4%. The results indicate that the permeability prediction model for carbonate reservoirs established by this method can effectively improve the accuracy of permeability in fractured and vuggy carbonate reservoirs, providing a new approach for calculating the permeability of complex carbonate reservoirs.
Jun ZHAO , Xuan HE , Qiang LAI , Bing YU , ZhenGuan WU . Model of permeability prediction for carbonate rocks based on digital cores[J]. Progress in Geophysics, 2024 , 39(6) : 2207 -2218 . DOI: 10.6038/pg2024HH0545
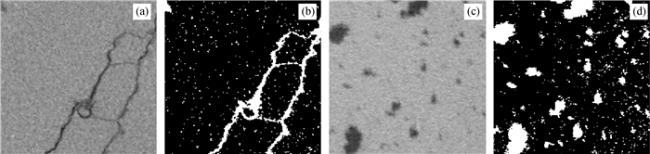
图1 岩心CT扫描图像的二值化处理(a)孔洞-裂缝型岩样CT扫描图像;(b)孔洞-裂缝型岩样CT扫描图像对应二值化图像; Fig 1 Binary processing of CT scan images of rock cores (a) CT scan images of pore-crack type rock samples; (b) CT scan images of pore-crack type rock samples correspond to binary images; |
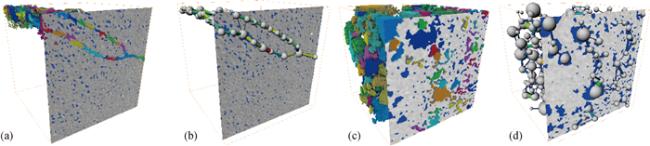
图2 基于数字岩心提取的孔隙空间模型(a)孔洞-裂缝型岩样提取得到的连通孔隙空间;(b)孔洞-裂缝型岩样连通孔隙空间孔喉球棍模型;(c)孔洞型岩样提取得到的连通孔隙空间;(d)孔洞型岩样连通孔隙空间孔喉球棍模型. Fig 2 Pore space models based on digital core extraction (a) The connected pore space obtained from the extraction of pore-crack type rock samples; (b) Pore-crack type rock sample connected pore space pore throat ball stick model; (c) The connected pore space obtained from the extraction of porous type rock samples; (d) Porous type rock sample connected pore space pore throat ball stick model. |
表1 孔隙空间类型划分标准表Table 1 Table of classification standards for pore space types |
| 孔隙空间类型 | 几何特征 |
| 孔洞 | 孔隙长宽比≤10,球形度≥0.43 |
| 裂缝 | 孔隙长宽比>10,球形度<0.43 |
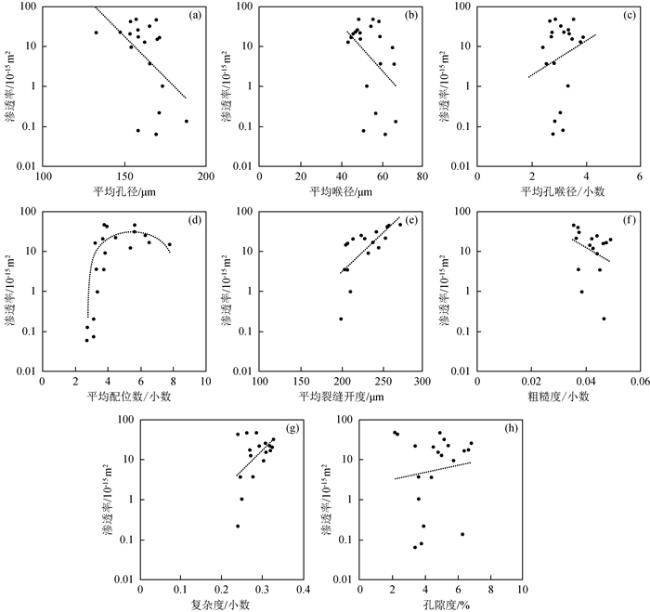
表2 孔隙结构参数与渗透率相关系数表Table 2 Table of correlation coefficients between pore structure parameters and permeability |
| 图号 | 孔隙结构参数 | 相关关系 | 相关系数R |
| a | 平均孔径 | 指数 | 0.1597 |
| b | 平均喉径 | 指数 | 0.2086 |
| c | 平均孔喉比 | 指数 | 0.1039 |
| d | 平均配位数 | 多项式(二次) | 0.6468 |
| e | 平均裂缝开度 | 指数 | 0.8055 |
| f | 裂缝粗糙度 | 指数 | 0.5804 |
| g | 裂缝复杂度 | 指数 | 0.1543 |
| h | 孔隙度 | 指数 | 0.0883 |
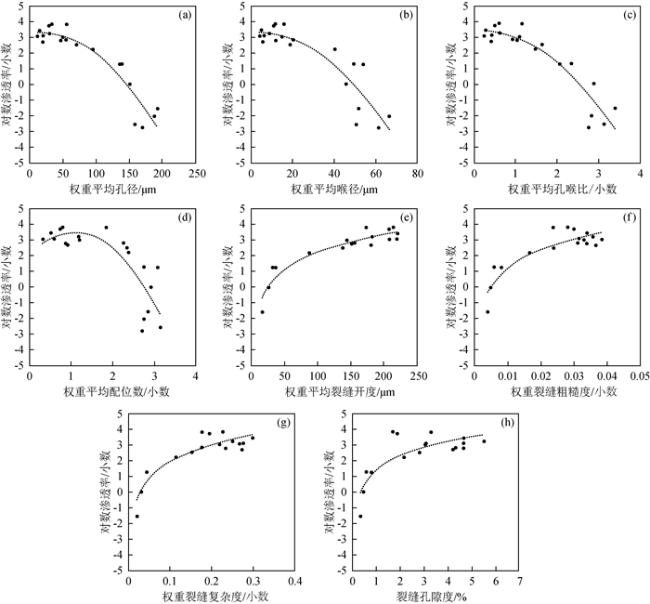
表3 权重孔隙结构参数与对数渗透率相关系数表Table 3 Table of correlation coefficients between weighted pore structure parameters and logarithmic permeability |
| 图号 | 孔隙结构参数 | 相关关系 | 相关系数R |
| a | 权重平均孔径 | 多项式(二次) | 0.9401 |
| b | 权重平均喉径 | 多项式(二次) | 0.9035 |
| c | 权重平均孔喉比 | 多项式(二次) | 0.9331 |
| d | 权重平均配位数 | 多项式(二次) | 0.8243 |
| e | 权重平均裂缝开度 | 对数 | 0.9462 |
| f | 权重裂缝粗糙度 | 对数 | 0.9013 |
| g | 权重裂缝复杂度 | 对数 | 0.9195 |
| h | 裂缝孔隙度 | 对数 | 0.8298 |
表4 建模样品孔渗参数与孔隙结构参数表Table 4 Table of pore permeability parameters and pore structure parameters for modeling samples |
| 岩心样品 编号 | ϕ/% | K/10-15 m2 | ϕb/ϕ/% | R/μm | r/μm | B | N | ε/μm | C | F |
| 1 | 4.90 | 46.44 | 32.75 | 169.2 | 48.2 | 3.51 | 5.63 | 257.3 | 0.0352 | 0.2627 |
| 2 | 2.31 | 42.36 | 18.79 | 153.7 | 58.2 | 2.64 | 3.94 | 254.9 | 0.0369 | 0.2395 |
| 3 | 6.27 | 0.134 | 100 | 188.0 | 66.4 | 2.83 | 2.75 | — | — | — |
| 4 | 3.58 | 3.67 | 83.89 | 165.3 | 59.0 | 2.80 | 3.29 | 203.2 | 0.0372 | 0.2770 |
| 5 | 2.14 | 47.17 | 21.08 | 157.0 | 55.2 | 2.84 | 3.76 | 271.0 | 0.0354 | 0.2860 |
| 6 | 4.78 | 15.13 | 11.72 | 170.0 | 49.2 | 3.46 | 7.78 | 204.5 | 0.0412 | 0.3092 |
| 7 | 3.36 | 21.69 | 8.79 | 132.5 | 48.8 | 2.72 | 3.70 | 227.6 | 0.0419 | 0.2925 |
| 8 | 3.74 | 0.079 | 100 | 158.3 | 50.7 | 3.12 | 3.14 | — | — | — |
| 9 | 6.37 | 16.58 | 26.91 | 171.5 | 44.4 | 3.86 | 3.24 | 206.8 | 0.0461 | 0.3199 |
| 10 | 4.50 | 20.64 | 32.47 | 153.3 | 45.7 | 3.36 | 3.70 | 213.2 | 0.0488 | 0.3245 |
| 11 | 6.79 | 25.64 | 18.78 | 158.3 | 47.6 | 3.32 | 6.30 | 223.7 | 0.0437 | 0.3073 |
| 12 | 3.89 | 0.216 | 91.18 | 211.2 | 56.7 | 3.73 | 3.13 | 199.0 | 0.0464 | 0.2399 |
| 13 | 5.15 | 31.74 | 9.24 | 165.3 | 54.2 | 3.05 | 5.63 | 242.5 | 0.0373 | 0.3285 |
| 14 | 3.38 | 0.064 | 100 | 169.3 | 61.4 | 2.76 | 2.71 | — | — | — |
| 15 | 3.59 | 1.02 | 87.27 | 173.2 | 52.3 | 3.31 | 3.35 | 210.3 | 0.0384 | 0.2498 |
| 16 | 6.64 | 17.31 | 34.64 | 158.2 | 58.6 | 2.70 | 6.52 | 237.5 | 0.0473 | 0.2694 |
| 17 | 5.39 | 22.44 | 13.48 | 147.5 | 46.7 | 3.16 | 4.47 | 252.9 | 0.0362 | 0.3191 |
| 18 | 4.99 | 12.63 | 43.58 | 162.2 | 43.0 | 3.77 | 5.38 | 244.6 | 0.0423 | 0.2713 |
| 19 | 4.37 | 3.59 | 81.98 | 165.6 | 65.7 | 2.52 | 3.75 | 206.5 | 0.0448 | 0.2458 |
| 20 | 5.72 | 9.34 | 62.23 | 154.2 | 64.8 | 2.38 | 3.82 | 231.8 | 0.0439 | 0.3028 |
表5 孔隙结构参数渗透率预测模型相关系数表Table 5 Correlation coefficient table of pore structure parameter permeability prediction model |
| 回归系数 | 回归系数估计值 | t Stat | 标准误差 |
| a1 | 0.3186 | 0.3238 | 0.9839 |
| a2 | -24.95 | -0.6192 | 40.28 |
| a3 | -0.3011 | -2.678 | 0.1124 |
| a4 | 0.5319 | 2.245 | 0.2369 |
| a5 | -0.1648 | -0.8094 | 0.2037 |
表6 双重介质孔渗模型相关系数表Table 6 Correlation coefficient table of dual medium pore permeability model |
| 回归系数 | 回归系数估计值 | t Stat | 标准误差 |
| a1 | 3.0079 | 3.3304 | 0.9032 |
| a2 | -105.00 | 19.705 | -5.3287 |
| a3 | -0.3059 | 0.1905 | -1.6063 |
表7 待判样品渗透率预测与常规渗透率模型误差对比分析表Table 7 Comparison analysis table of the error between the predicted permeability of the sample to be determined and the conventional permeability model |
| 岩心样品编号 | ϕ/% | K/10-15 m2 | ϕb/ϕ/% | R/μm | B | ε/μm | F | KⅠ/10-15 m2 | δⅠ/% | KⅡ/10-15 m2 | δⅡ/% |
| 21 | 3.47 | 7.87 | 83.65 | 191.1 | 2.19 | 216.7 | 0.3261 | 4.09 | 48.00 | 4.69 | 40.44 |
| 22 | 6.17 | 13.23 | 45.76 | 161.6 | 1.82 | 239.9 | 0.3232 | 20.15 | 52.34 | 2.95 | 77.68 |
| 23 | 5.42 | 0.258 | 99.88 | 279.2 | 2.20 | 242.4 | 0.1764 | 0.159 | 38.30 | 1.33 | 414.1 |
| 24 | 5.40 | 1.54 | 96.56 | 248.1 | 2.11 | 249.3 | 0.2511 | 1.02 | 33.70 | 0.582 | 62.30 |
| 25 | 2.29 | 7.59 | 67.32 | 125.6 | 2.56 | 285.9 | 0.2456 | 10.58 | 39.44 | 17.95 | 136.5 |
| 26 | 3.22 | 0.667 | 79.77 | 223.0 | 3.89 | 260.5 | 0.2562 | 0.802 | 20.25 | 6.37 | 855.5 |
| 27 | 2.27 | 0.084 | 100 | 235.8 | 3.34 | — | — | 0.022 | 73.45 | 1.88 | 2134 |
| 28 | 2.56 | 1.955 | 65.76 | 264.2 | 3.90 | 325.4 | 0.2105 | 2.71 | 38.47 | 14.74 | 653.8 |
| 29 | 4.72 | 35.64 | 22.40 | 182.3 | 2.11 | 303.8 | 0.3512 | 30.14 | 15.42 | 18.35 | 48.55 |
| 30 | 2.78 | 6.24 | 59.70 | 221.6 | 3.63 | 368.9 | 0.3018 | 6.39 | 2.38 | 13.97 | 123.8 |
感谢审稿专家提出的修改意见和编辑部的大力支持!
|
|
|
|
|
|
|
|
|
|
|
|
|
|
|
|
|
|
|
|
|
|
|
|
|
|
|
|
|
|
|
|
|
|
|
|
|
|
|
|
|
|
|
|
|
|
|
|
|
|
|
|
|
|
|
|
|
|
|
|
|
|
|
|
|
|
/
| 〈 |
|
〉 |