
3D gravity anomaly forward and inversion algorithm based on improved LinkNet
Received date: 2024-05-17
Online published: 2025-01-14
Copyright
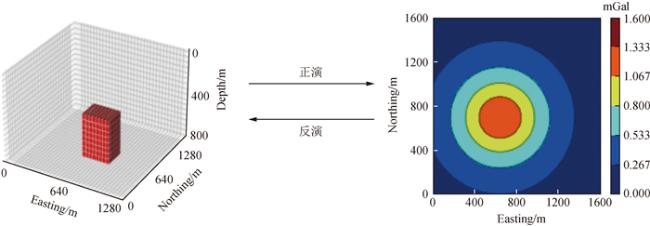
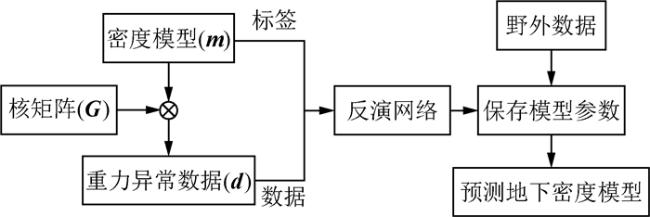
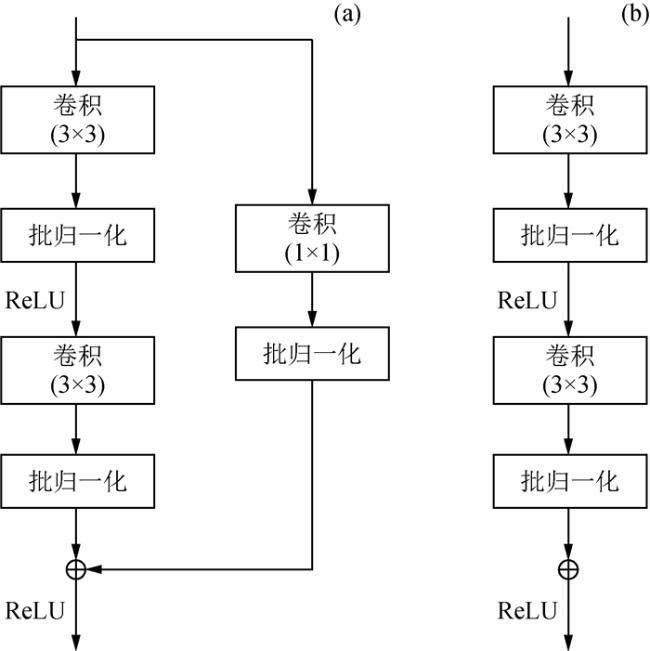
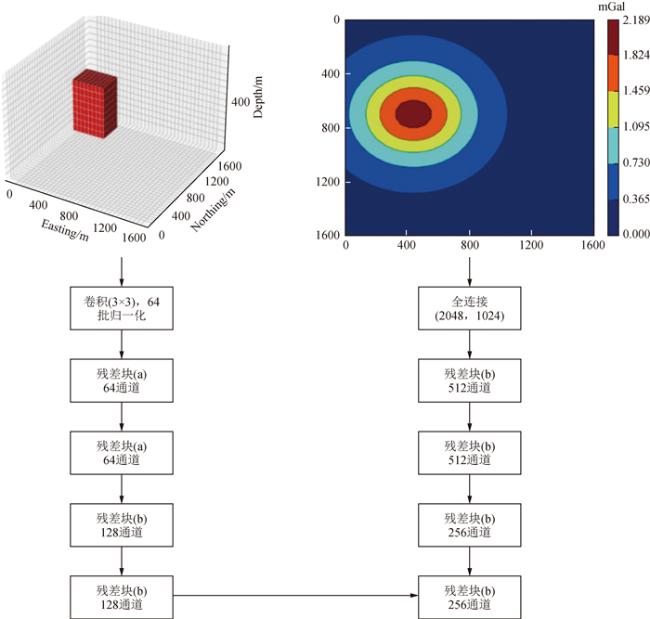
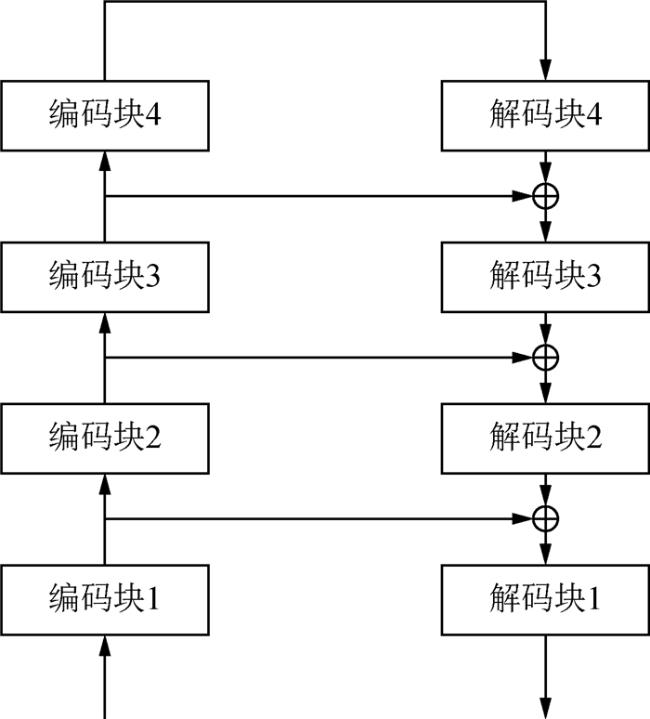
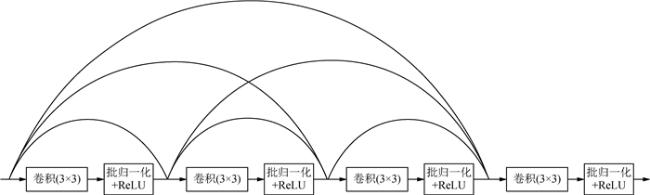
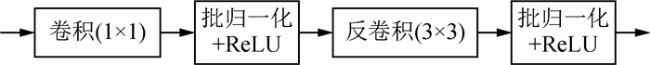
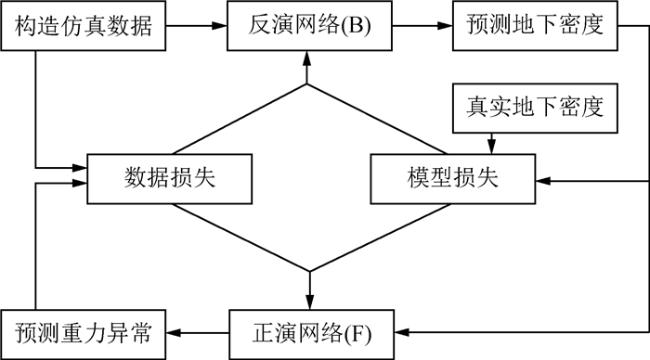
gravity exploration is one of the most widely used geophysical methods in geophysics exploration by measuring gravity anomalies caused by density anomalies and interpreting the underground density anomalies qualitatively and quantitatively. Because 3D inversion of physical properties can describe the study object of geological structure more precisely, it has become a conventional method for quantitative interpretation of gravity anomaly data. Based on LinkNet, the forward and inverse methods of 3D gravity anomaly are studied in this paper. The forward network is constructed on the basis of Residual network to realize the mapping from underground density anomaly to gravity anomaly data. The loss function uses MSE loss, which constrains the real gravity anomaly data and the prediction value of the gravity anomaly output of the forward network. The encoder module of the inversion network is changed to the form of dense connection, and the mapping of gravity anomaly data to underground density anomaly body is studied. The loss function uses Dice loss to constrain the similarity between the real density anomaly and the density anomaly predicted by the inversion network. The data loss and the model loss are constrained by the forward network and the inverse network to reduce the non-uniqueness of the solution. By comparing with the method of training only inversion network, it is found that the average relative error of training both forward and inversion network is lower on the conventional data set, which verifies the effectiveness of the method, the effect of the network is further verified on the random model and five conventional models. Finally, the effect of the network on real field data is tested.
YuJie ZHANG , HouPu LI , MengXin QIU . 3D gravity anomaly forward and inversion algorithm based on improved LinkNet[J]. Progress in Geophysics, 2024 , 39(6) : 2219 -2231 . DOI: 10.6038/pg2024HH0411
| 算法1 生成单个随机游走模型 |
| Input:最小移动次数 step1,最大移动次数 step2 Output:密度模型m 1:在{1, 2}中随机初始化模型个数 n 2:if (n == 2) then 3: step1 = step1 // 2 4: step2 = step2 // 2 5:end if 6:在[step1, step2]内随机初始化移动次数 steps 7:for (i = 0; i<n; i++) do 8: 随机初始化起始点 9: for (step = 1; step<steps; step++) do 10: 随机选择x, y, z轴,随机选择正负方向,将起始点移动一个单位 11: 若出界则移动到边界位置 12: end for 13:end for |
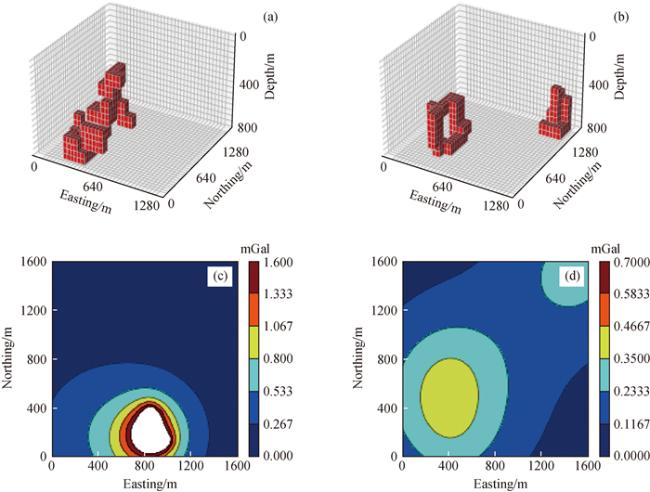
图9 随机模型可视化图(a)单个密度模型;(b)两个密度模型组合;(c)图(a)对应的重力异常数据;(d)图(b)对应的重力异常数据. Fig 9 Visualization of random model (a) The single density model; (b) The combination of two density models; (c) The corresponding gravity anomaly data of Fig.(a); (d) The corresponding gravity anomaly data of Fig.(b). |
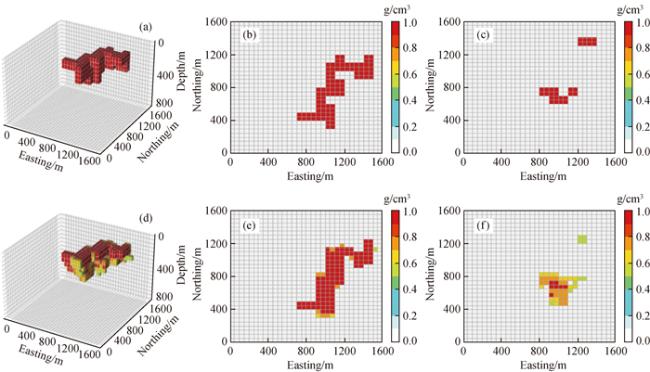
图12 单个随机模型反演结果从左到右依次为密度模型、模型深度50 m处的xoy剖面图、模型深度250 m处的xoy剖面图. Fig 12 Inversion results of single random model From left to right, they are density model, xoy profile at the model depth of 50 m, and xoy profile at the model depth of 250 m. |
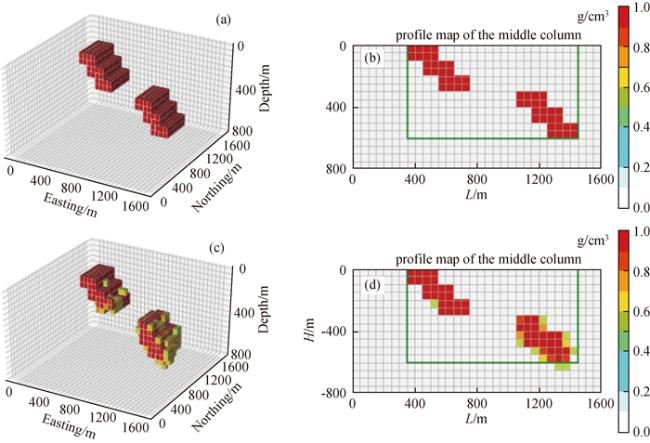
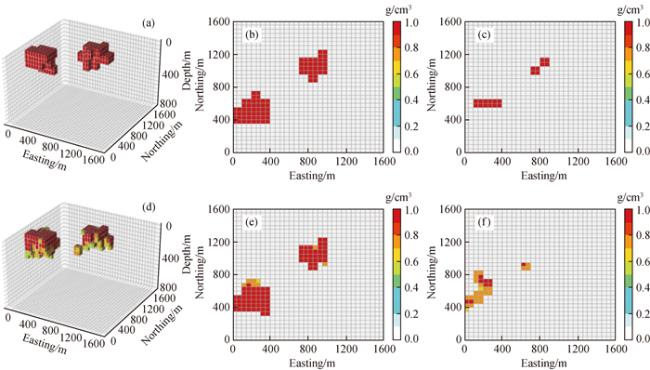
图13 两个随机模型反演结果从左到右依次为密度模型、模型深度50 m处的xoy剖面图、模型深度250 m处的xoy剖面图. Fig 13 Inversion results of two random models From left to right, they are density model, xoy profile at the model depth of 50 m, and xoy profile at the model depth of 250 m. |
表1 五种常规模型的平均相对误差Table 1 Average relative error of five conventional models |
| 反演网络 | 同时训练正、反演网络 | |
| type1 | 0.27 | 0.22 |
| type2 | 0.38 | 0.36 |
| type3 | 0.46 | 0.33 |
| type4 | 0.36 | 0.34 |
| type5 | 0.41 | 0.32 |
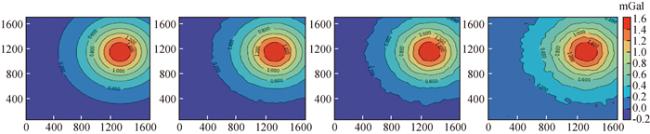
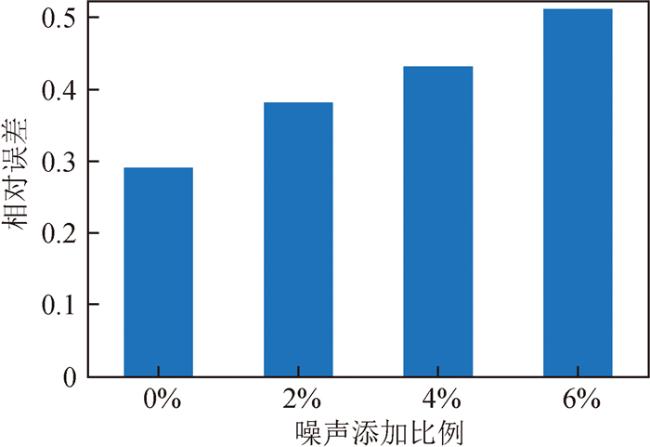
图15 不同噪声比例下的重力异常数据(a)干净的重力数据;(b)加噪比例为2%的重力数据;(c)噪比例为4%的重力数据;(d)加噪比例为6%的重力数据. Fig 15 Gravity anomaly data with different noise ratios (a) Clean gravity data; (b) Gravity data with 2% noise; (c) Gravity data with 4% noise; (d) Gravity data with 6% noise. |
感谢审稿专家提出的修改意见和编辑部的大力支持!
|
|
|
|
|
|
|
|
|
|
|
|
|
|
|
|
|
|
|
|
|
|
|
|
|
|
|
|
|
|
|
|
|
|
|
|
|
|
|
|
|
|
|
|
|
|
|
|
|
|
|
|
|
|
|
|
|
|
|
|
/
| 〈 |
|
〉 |