
Research on comprehensive logging evaluation method for identifying high-quality shale gas reservoirs based on multifractal spectra analysis: an example of Fuling shale gas reservoir
Received date: 2023-11-20
Online published: 2025-01-14
Copyright
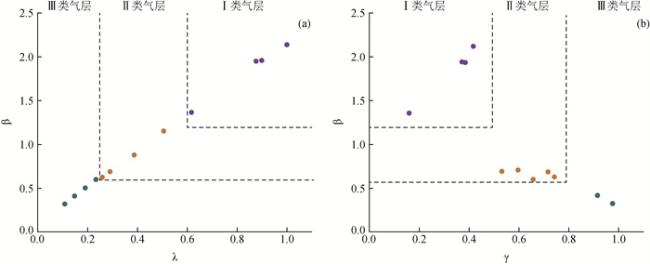
Conventional logging interpretation methods qualitatively identify shale reservoirs using shale attribute parameters and interpretation templates. However, improving the identification accuracy of complex shale reservoirs is challenging due to the numerous evaluation parameters and the complexity of model calculations. To quantitatively characterize high-quality shale reservoirs effectively, this study utilizes the JY6-2 and JY10-4 wells in the Fuling shale gas field as examples. It establishes a comprehensive evaluation method for identifying high-quality shale gas reservoirs, utilizing multi-fractal spectrum analysis of well logging. Firstly, the conventional well logs were qualitatively analyzed and evaluated using the methods of multiple fractals and R/S analysis. Subsequently, a gray relational analysis is employed to combine the production well logging, which reflects dimensionless productivity contributions, with the fractal characteristics of conventional well logs to obtain the corrected weight multifractal spectrum width Δα′ and fractal dimension D′. Comprehensive fractal evaluation indexes λ and γ are introduced, forming three categories of productivity evaluation standards for shale gas reservoirs characterized by fractals. The calculation results show that the Δα′ comprehensive fractal evaluation index for Class Ⅰ gas reservoirs is 0.6 < λ < 1, and the D′ comprehensive fractal evaluation index is 0 < γ < 0.5; for Class Ⅱ gas reservoirs, the Δα′ comprehensive fractal evaluation index is 0.25 < λ < 0.6, and the D′ comprehensive fractal evaluation index is 0.5 < γ < 0.8; for Class Ⅲ gas reservoirs, the Δα′ comprehensive fractal evaluation index is 0 < λ < 0.25, and the D′ comprehensive fractal evaluation index is 0.8 < γ < 1. Overall, the comprehensive fractal evaluation index of the high-production wells Δα′ is close to 1 and shows a decreasing trend from high to low production; the comprehensive fractal evaluation index of the low-production wells with the R/S fractal dimension D′ is close to 1 and shows a decreasing trend from low-production to high-production. Finally, Well JY8-2 is employed as a validation well to demonstrate the effectiveness of the evaluation method. This research method is a simple way to extract the multifractal spectra based on conventional logging data to evaluate comprehensive sweet spot zones. It is of great significance for identifying high-quality reservoir areas in shale gas reservoirs, and provides technical support for the effective development of shale reservoirs on a large scale.
Key words: Well logs; Multifractal spectrum; R/S analysis; Fractal dimension; Shale gas
CuiHao LIAN , JuHua LI . Research on comprehensive logging evaluation method for identifying high-quality shale gas reservoirs based on multifractal spectra analysis: an example of Fuling shale gas reservoir[J]. Progress in Geophysics, 2024 , 39(6) : 2253 -2264 . DOI: 10.6038/pg2024HH0414
表1 页岩气井无因次产量及分级表Table 1 Shale gas well dimensionless production grading scale |
| 井号 | 压裂段 | 测深/m | 垂深/m | 产气量/(m3/d) | 无因次产量 | 产能分级 |
| 焦页10-4 | 9 | 3598.88 | 2370.29 | 3672.15 | 0.693 | 中产 |
| 10 | 3504.38 | 2368.17 | 3318.18 | 0.626 | 中产 | |
| 11 | 3427.63 | 2364.9 | 2670.26 | 0.504 | 低产 | |
| 12 | 3337.755 | 2359.45 | 3728.2 | 0.704 | 中产 | |
| 13 | 3252.63 | 2354.29 | 1693.85 | 0.32 | 低产 | |
| 14 | 3161.63 | 2350.28 | 4692.51 | 0.885 | 中产 | |
| 15 | 3066.255 | 2347.3 | 2184.41 | 0.412 | 低产 | |
| 16 | 2977.255 | 2344.7 | 3170.81 | 0.598 | 低产 | |
| 17 | 2898.255 | 2342.22 | 3645.45 | 0.688 | 中产 | |
| 焦页6-2 | 10 | 3402.125 | 2548.42 | 6118.19 | 1.155 | 中产 |
| 11 | 3312.125 | 2548.69 | 7240.08 | 1.366 | 高产 | |
| 12 | 3144.875 | 2549.16 | 10335.9 | 1.95 | 高产 | |
| 13 | 3115.75 | 2549.65 | 10377.9 | 1.958 | 高产 | |
| 14 | 3005.625 | 2551.82 | 11342.2 | 2.14 | 高产 | |
| 15 | 2915.375 | 2554.97 | 27037.6 | 2.239 | 高产 | |
| 焦页8-2 | 13 | 3283.375 | 2375.55 | 2315.16 | 0.299 | 低产 |
| 14 | 3205.5 | 2375.17 | 4774.54 | 0.617 | 中产 | |
| 15 | 3176.625 | 2375.1 | 3385.66 | 0.437 | 低产 | |
| 16 | 3258.625 | 2375.42 | 3253.13 | 0.42 | 低产 | |
| 17 | 3436.75 | 2376.07 | 10287.7 | 1.328 | 高产 | |
| 18 | 3839.875 | 2376.8 | 5546.2 | 0.716 | 中产 | |
| 19 | 3857.875 | 2377.3 | 7270.92 | 0.939 | 中产 | |
| 20 | 3868.75 | 2377.64 | 9391.67 | 1.213 | 高产 | |
| 21 | 2702.5 | 2378.05 | 23472 | 3.03 | 高产 |
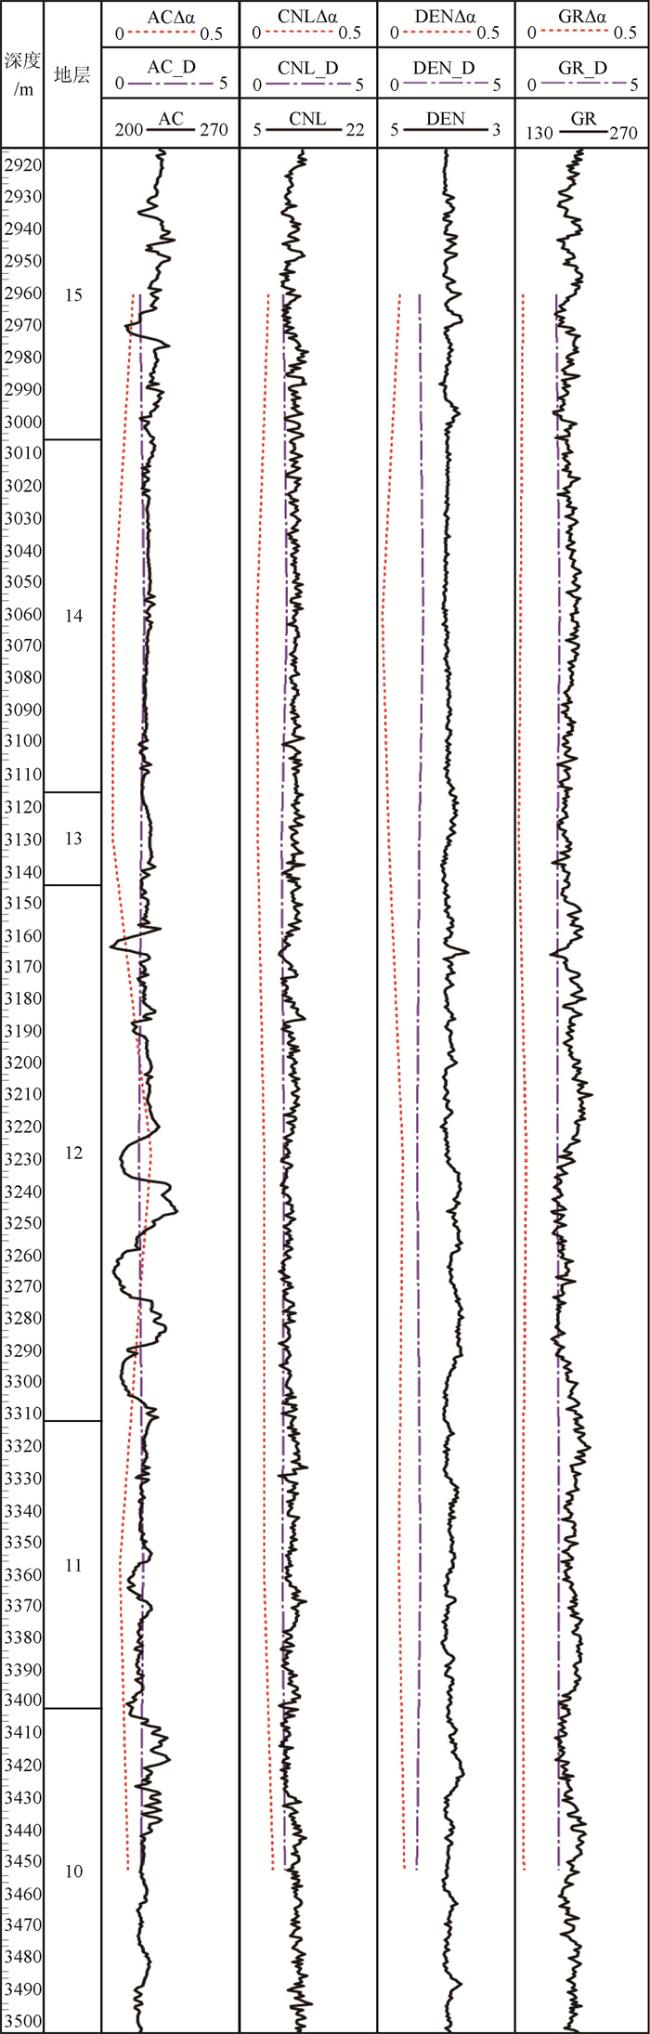
图1 测井曲线与分形相关参数关系图Fig 1 Graph of well log and fractal-related parameters relationship |
表2 焦页6-2井压裂段分形相关参数与无因次产量统计表Table 2 Fractal-related parameters and dimensionless production statistics for fractured sections of JY6-2 |
| 压裂段 | 分形参数 | AC | CNL | DEN | GR | 无因次产量 | 产能分级 | 产气量/(m3/d) |
| 10 | Δα | 0.096 | 0.122 | 0.099 | 0.033 | |||
| Δf(α) | 0.071 | -0.036 | 0.234 | -0.054 | ||||
| f(α)max | 1.074 | 1.074 | 1.074 | 1.074 | 1.155 | 中产 | 6118.19 | |
| B | -0.015 | 0.020 | -0.031 | 0.001 | ||||
| D | 1.441 | 1.648 | 1.445 | 1.587 | ||||
| 11 | Δα | 0.066 | 0.088 | 0.079 | 0.028 | |||
| Δf(α) | -0.153 | -0.042 | 0.030 | 0.038 | ||||
| f(α)max | 1.075 | 1.075 | 1.075 | 1.075 | 1.366 | 高产 | 7240.08 | |
| B | 0.012 | 0.002 | -0.007 | -0.001 | ||||
| D | 1.498 | 1.567 | 1.575 | 1.596 | ||||
| 12 | Δα | 0.178 | 0.089 | 0.093 | 0.041 | |||
| Δf(α) | -0.011 | 0.028 | 0.060 | 0.164 | ||||
| f(α)max | 1.073 | 1.073 | 1.073 | 1.073 | 1.95 | 高产 | 10335.9 | |
| B | 0.008 | -0.009 | -0.013 | -0.005 | ||||
| D | 1.359 | 1.617 | 1.456 | 1.547 | ||||
| 13 | Δα | 0.040 | 0.066 | 0.042 | 0.015 | |||
| Δf(α) | -0.185 | -0.248 | -0.177 | -0.318 | ||||
| f(α)max | 1.075 | 1.075 | 1.075 | 1.958 | 高产 | 10377.9 | ||
| B | 0.015 | 0.031 | 0.020 | 0.013 | ||||
| D | 1.436 | 1.531 | 1.536 | 1.547 | ||||
| 14 | Δα | 0.043 | 0.063 | 0.019 | 0.021 | |||
| Δf(α) | 0.017 | -0.067 | 0.019 | -0.014 | ||||
| f(α)max | 1.075 | 1.075 | 1.075 | 1.075 | 2.14 | 高产 | 11342.2 | |
| B | -0.006 | 0.005 | -0.002 | -0.002 | ||||
| D | 1.545 | 1.722 | 1.678 | 1.623 | ||||
| 15 | Δα | 0.114 | 0.105 | 0.082 | 0.030 | |||
| Δf(α) | -0.217 | -0.035 | 0.107 | -0.098 | ||||
| f(α)max | 1.074 | 1.076 | 1.075 | 1.075 | 2.239 | 高产 | 27037.6 | |
| B | 0.040 | -0.003 | -0.016 | 0.002 | ||||
| D | 1.399 | 1.595 | 1.547 | 1.498 |
表3 焦页6-2井Δα灰色关联度Table 3 Δα Grey Relational Degree for JY6-2 |
| 压裂段 | 无因次产量 | 分形谱宽Δα值 | Δα灰色关联度 | |||||||
| AC | CNL | DEN | GR | AC | CNL | DEN | GR | |||
| 10 | 0.507 | 0.096 | 0.122 | 0.099 | 0.033 | 0.7939 | 0.7821 | 0.7927 | 0.8050 | |
| 11 | 0.6 | 0.066 | 0.088 | 0.079 | 0.028 | |||||
| 12 | 0.856 | 0.178 | 0.089 | 0.093 | 0.041 | |||||
| 13 | 0.859 | 0.040 | 0.066 | 0.042 | 0.015 | |||||
| 14 | 0.939 | 0.043 | 0.063 | 0.019 | 0.021 | |||||
| 15 | 2.239 | 0.114 | 0.105 | 0.082 | 0.030 | |||||
表4 焦页6-2井D灰色关联度Table 4 D Grey Relational Degree for JY6-2 |
| 压裂段 | 无因次产量 | 分形谱宽D值 | D灰色关联度 | |||||||
| AC | CNL | DEN | GR | AC | CNL | DEN | GR | |||
| 10 | 0.507 | 1.441 | 1.648 | 1.445 | 1.587 | 0.8295 | 0.8813 | 0.8747 | 0.9163 | |
| 11 | 0.6 | 1.498 | 1.567 | 1.575 | 1.596 | |||||
| 12 | 0.856 | 1.359 | 1.617 | 1.456 | 1.547 | |||||
| 13 | 0.859 | 1.436 | 1.531 | 1.536 | 1.547 | |||||
| 14 | 0.939 | 1.545 | 1.722 | 1.678 | 1.623 | |||||
| 15 | 2.239 | 1.399 | 1.595 | 1.547 | 1.498 | |||||
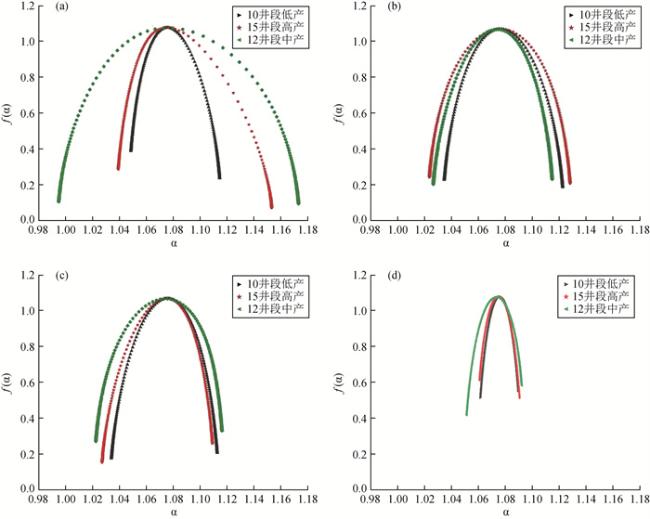
图2 焦页6-2压裂水平井不同压裂井段测井四属性多重分形谱(a)AC多重分形谱;(b)CNL多重分形谱;(c)DEN多重分形谱;(d)GR多重分形谱. Fig 2 Multifractal spectrum of four attribute well logging for different well sections of JY6-2 fractured horizontal well (a) AC multifractal spectrum; (b) CNL multifractal spectrum; (c) DEN multifractal spectrum; (d) GR multifractal spectrum. |
表5 综合分形评价指标参数Table 5 Comprehensive fractal evaluation index parameters |
| 井号 | 压裂段 | Δα′ | D′ | 无因次产量 | 产气量/(m3/d) |
| 焦页6-2 | 10 | 0.5057 | 0.3120 | 1.155 | 6118.19 |
| 11 | 0.6166 | 0.1634 | 1.366 | 7240.08 | |
| 12 | 0.8768 | 0.3898 | 1.95 | 10335.9 | |
| 13 | 0.8987 | 0.3772 | 1.958 | 10377.9 | |
| 14 | 1.0000 | 0.4222 | 2.14 | 11342.2 | |
| 焦页10-4 | 9 | 0.2894 | 0.5395 | 0.693 | 3672.15 |
| 10 | 0.2606 | 0.7505 | 0.626 | 3318.18 | |
| 11 | 0.1909 | 0.7467 | 0.504 | 2670.26 | |
| 12 | 0.2797 | 0.6050 | 0.704 | 3728.2 | |
| 13 | 0.1089 | 0.9877 | 0.32 | 1693.85 | |
| 14 | 0.3868 | 0.4728 | 0.885 | 4692.51 | |
| 15 | 0.1483 | 0.9281 | 0.412 | 2184.41 | |
| 16 | 0.2345 | 0.6656 | 0.598 | 3170.81 | |
| 17 | 0.2911 | 0.7273 | 0.688 | 3645.45 |
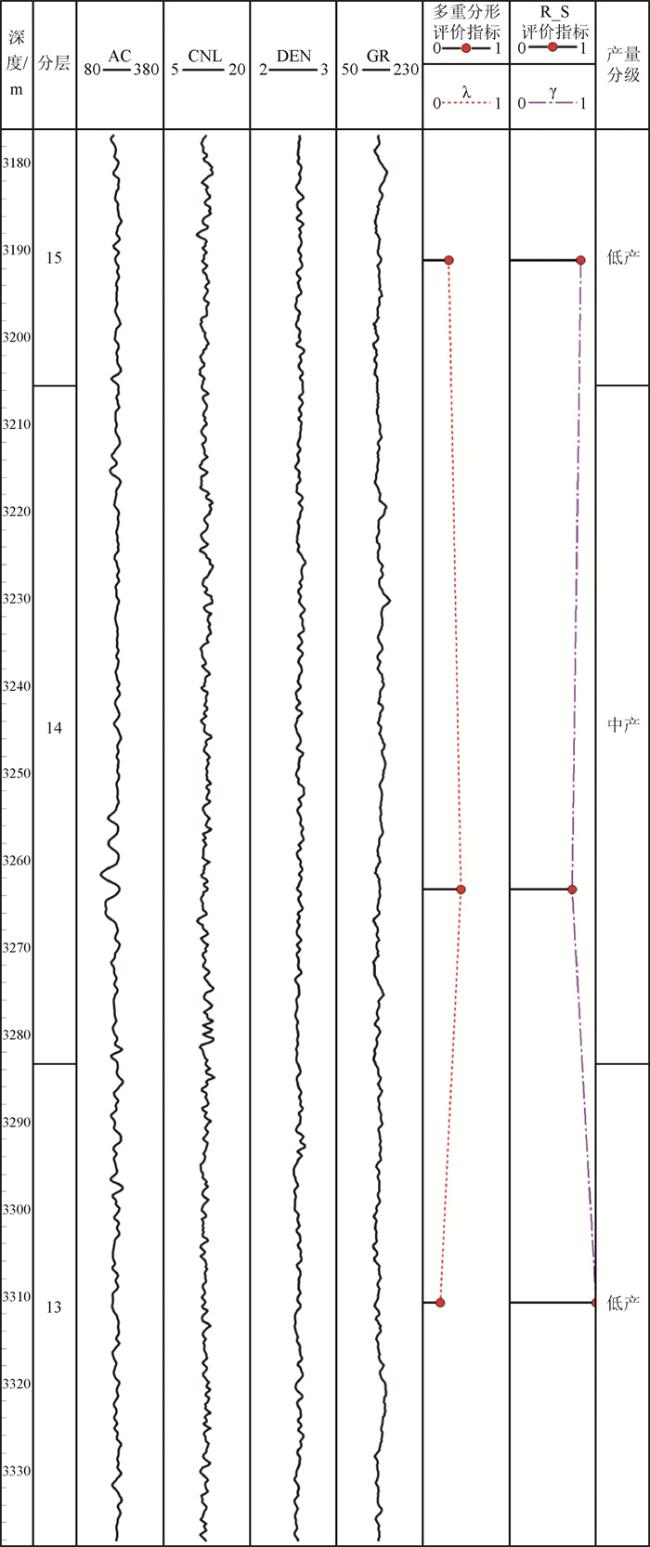
表6 焦页8-2井多重分形参数与无因次产量对比Table 6 Contrasting multifractal dimensions and dimensionless yield in JY8-2 |
| 试采段/M | 分形参数 | Ac | Cnl | Den | Gr | ΔΑ′ | D′ | 无因次产量 | 产能分级 | 产气量/(m3/d) |
| 3176.6438~3205.5 | Δα | 0.065 | 0.101 | 0.005 | 0.048 | 0.2990 | 0.8242 | 0.437 | 低产 | 3385.66 |
| Δf(α) | -0.311 | 0.049 | -0.011 | 0.327 | ||||||
| Δf(α)max | 1.078 | 1.078 | 1.078 | 1.078 | ||||||
| B | 0.017 | 0.003 | -0.003 | -0.013 | ||||||
| D | 1.515 | 1.514 | 1.523 | 1.365 | ||||||
| 3205.5~3283.375 | Δα | 0.107 | 0.072 | 0.005 | 0.039 | 0.4389 | 0.7252 | 0.617 | 中产 | 4774.54 |
| Δf(α) | -0.452 | -0.104 | 0.016 | 0.144 | ||||||
| Δf(α)max | 1.075 | 1.075 | 1.075 | 1.075 | ||||||
| B | 0.054 | 0.005 | 0.000 | -0.004 | ||||||
| D | 1.517 | 1.647 | 1.569 | 1.405 | ||||||
| 3283.375~3338.125 | Δα | 0.056 | 0.062 | 0.007 | 0.044 | 0.2008 | 1.0000 | 0.299 | 低产 | 2315.16 |
| Δf(α) | 0.007 | 0.098 | -0.044 | 0.205 | ||||||
| f(α)max | 1.074 | 1.074 | 1.074 | 1.074 | ||||||
| B | 0.000 | -0.006 | 0.001 | -0.009 | ||||||
| D | 1.579 | 1.628 | 1.536 | 1.514 |
|
|
|
|
|
|
|
|
|
|
|
|
|
|
|
|
|
|
|
|
|
|
|
|
|
|
|
|
|
|
|
|
|
|
|
|
|
|
|
|
|
|
|
|
|
|
|
|
|
|
|
|
|
|
|
|
|
|
|
|
|
|
|
|
|
|
|
|
|
|
|
|
|
|
|
|
|
|
|
|
|
|
|
|
|
|
|
|
|
|
|
|
|
|
|
|
|
|
/
| 〈 |
|
〉 |