
Subway-induced soil stress wave fundamental characteristics research
Received date: 2024-05-30
Online published: 2025-01-14
Copyright
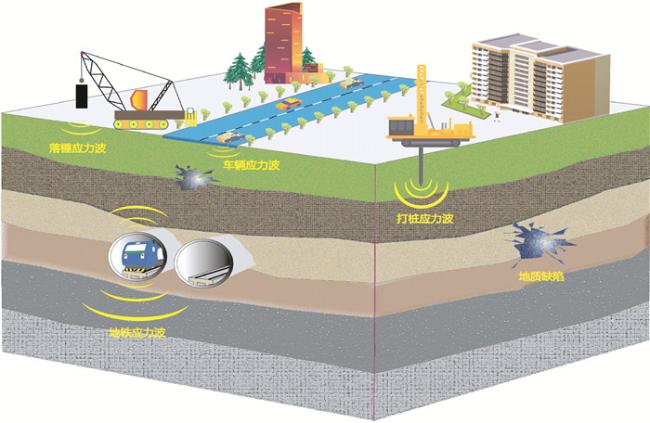
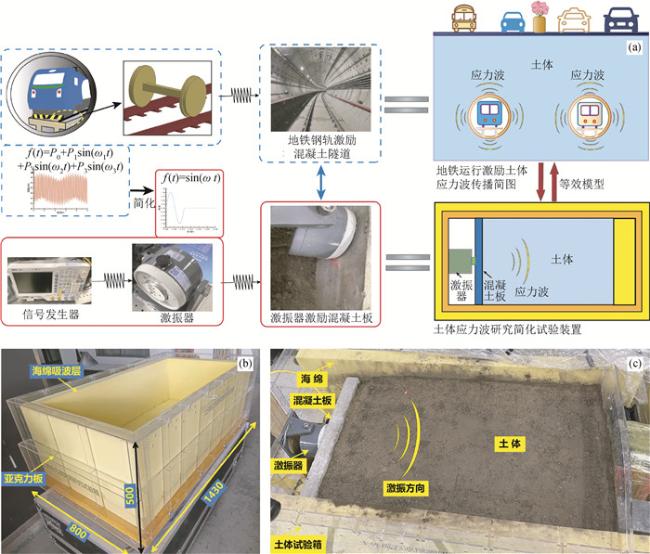
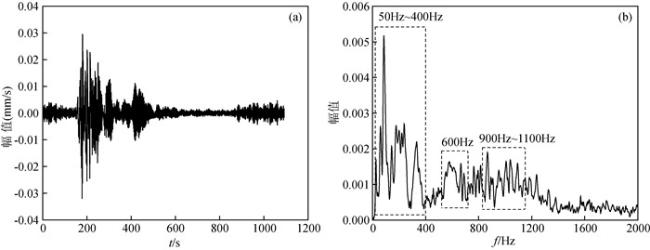
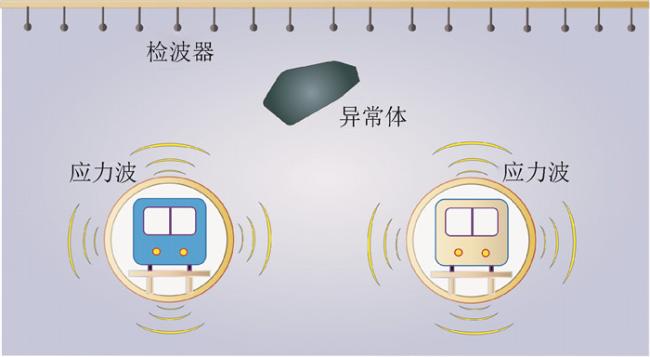
This study focuses on the propagation of vibrations generated during the operation of urban subway systems in the form of stress waves through the surrounding soil. The aim is to investigate and utilize the soil stress waves generated by subway vibrations for geological exploration around tunnels. The research begins by studying the propagation characteristics of stress waves generated by subway excitations in the soil to reveal their fundamental variations. Concrete slabs are excited using a shaker to simulate subway vibrations, and soil stress wave signal data are collected from different angles using a Laser Doppler Vibrometer(LDV) for analysis. The research findings indicate that the energy of soil stress wave signals exponentially attenuates with increasing distance from the vibration source, and higher excitation frequencies result in faster attenuation. In the direction perpendicular to the propagation of stress waves, the energy of the signals exhibits a characteristic normal distribution as the distance between measurement points and the central point increases. The arrival time of stress wave signals is extracted using the Akaike Information Criterion (AIC) method, and the wave velocity is calculated. It is observed that the stress wave velocity increases with higher excitation frequencies, indicating the dispersive nature of stress wave propagation in the soil. As the distance from the vibration source increases, the main frequency range of soil stress wave signals shifts towards lower frequencies, while the main frequency range of signals in the direction perpendicular to the signal propagation remains relatively consistent. The dominant stress waves that stably propagate to the ground are mainly low-frequency signals at 50 Hz, which can be used for detecting anomalies within the soil with a minimum scale of 0.6 m. Scanning of stress wave field maps on the surface of the soil using a LDV demonstrates that the energy of the wave field is concentrated near the surface of the soil. The scanned wave field maps visualize the propagation state of stress waves in real soil, and the obtained results can be used to validate computer simulation results. The findings of this study are of significant reference value for further exploration and utilization of soil stress waves generated by subway vibrations for geological exploration.
QingZhao KONG , XiaoHan SANG , Yang LI , Xia YANG , FuGang ZHU , Lei HAN . Subway-induced soil stress wave fundamental characteristics research[J]. Progress in Geophysics, 2024 , 39(6) : 2432 -2451 . DOI: 10.6038/pg2024II0231
表1 边界反射效果测试工况Table 1 Test conditions for boundary reflection effect |
| 边界种类 | 激励频率/Hz | ||||||||||||
| 50 | 100 | 150 | 200 | 250 | 300 | 350 | 400 | 450 | 500 | 1000 | 1500 | 2000 | |
| 海绵边界H | H-1 | H-2 | H-3 | H-4 | H-5 | H-6 | H-7 | H-8 | H-9 | H-10 | H-11 | H-12 | H-13 |
| 土体自然断面T | T-1 | T-2 | T-3 | T-4 | T-5 | T-6 | T-7 | T-8 | T-9 | T-10 | T-11 | T-12 | T-13 |
| 亚克力板边界B | B-1 | B-2 | B-3 | B-4 | B-5 | B-6 | B-7 | B-8 | B-9 | B-10 | B-11 | B-12 | B-13 |
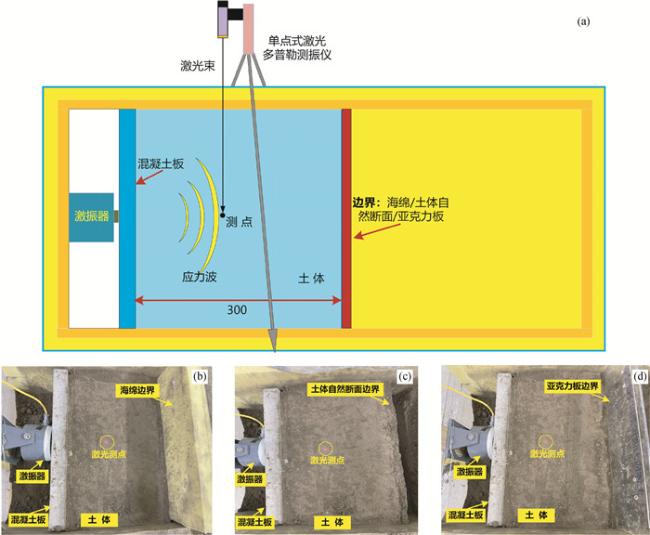
图3 边界吸波效果试验(a)试验装置示意图;(b)试验装置-海绵边界;(c)试验装置-土体自然断面;(d)试验装置-亚克力板边界. Fig 3 Boundary absorption effect testing (a)Schematic diagram of the experimental setup; (b)Experimental setup with sponge boundary; (c)Experimental setup-natural cross-section of soil; (d)Experimental setup with acrylic panel boundary. |
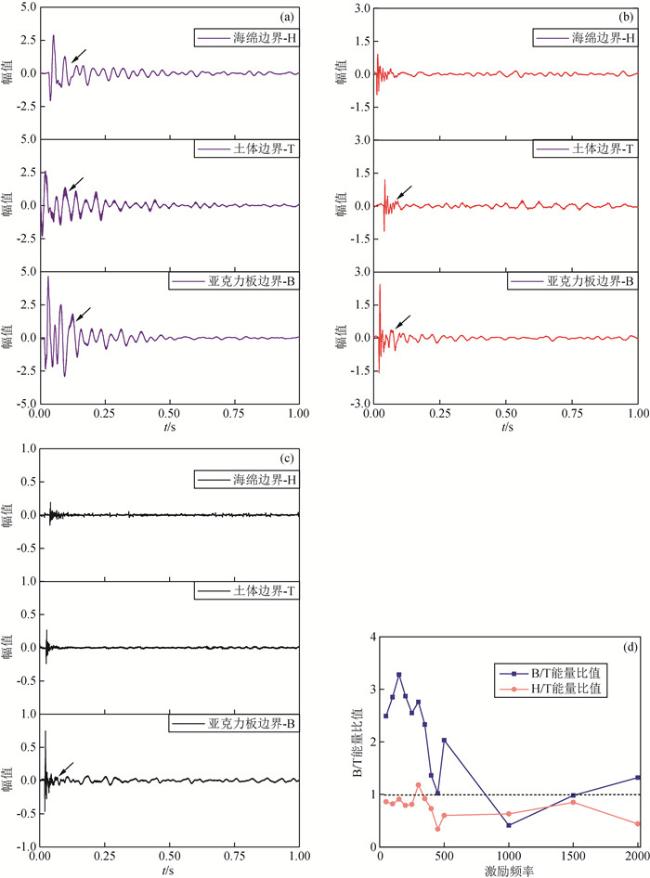
图4 各边界条件下的反射信号强度对比(a)激励信号50 Hz时域曲线;(b)激励信号250 Hz时域曲线;(c)激励信号1000 Hz时域曲线;(d)不同激励频率信号能量比值. Fig 4 Comparison of reflection signal intensity under different boundary conditions (a)Time-domain curve of the excitation signal at 50 Hz; (b)Time-domain curve of the excitation signal at 250 Hz; (c)Time-domain curve of the excitation signal at 1000 Hz; (d)Energy ratio of signals at different excitation frequencies. |
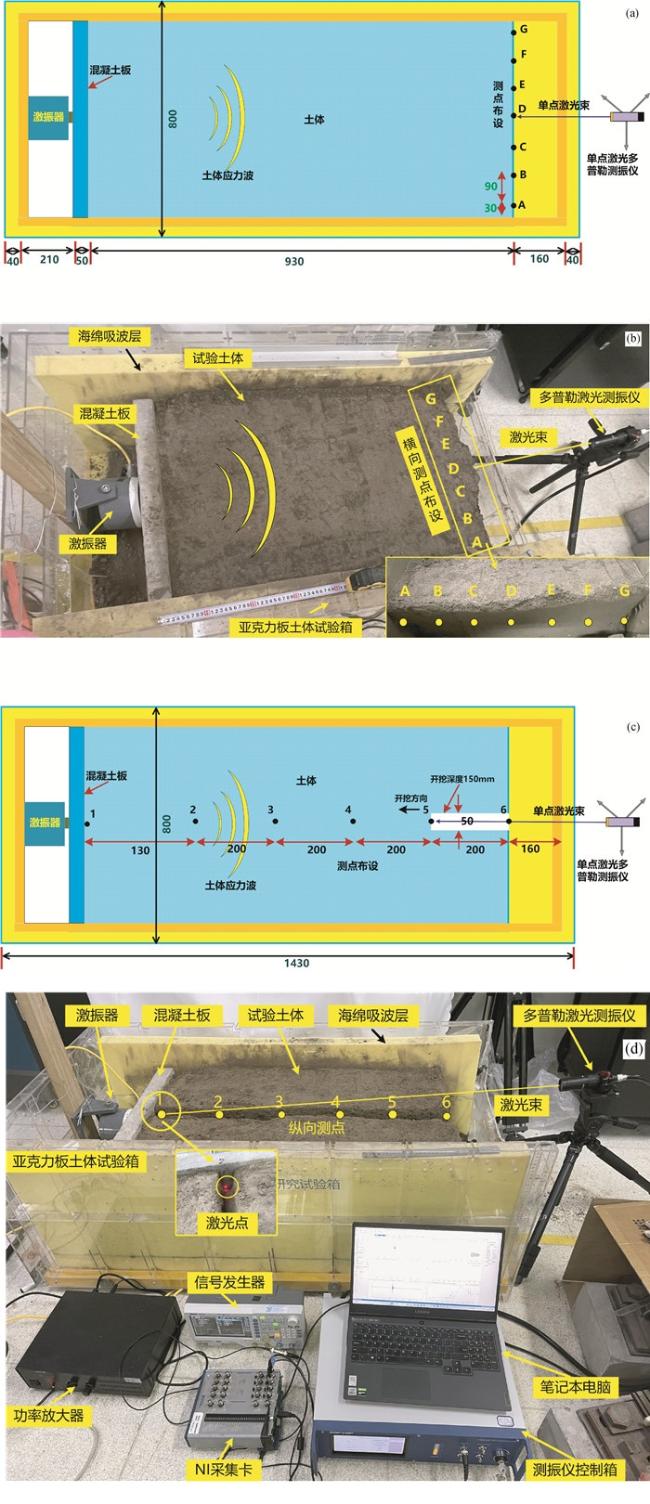
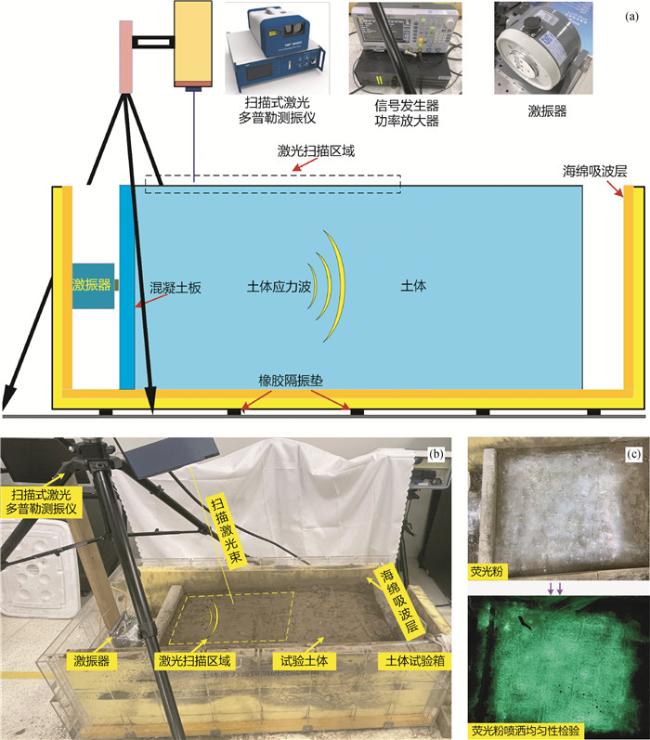
图5 试验装置(a)横向测点试验示意图;(b)横向测点试验装置设置;(c)纵向测点试验示意图;(d)纵向测点试验装置设置. Fig 5 Experimental setup (a)Schematic diagram of lateral measurement point test; (b)Lateral measurement point test setup; (c)Schematic diagram of longitudinal measurement point test; (d)Longitudinal measurement point test setup. |
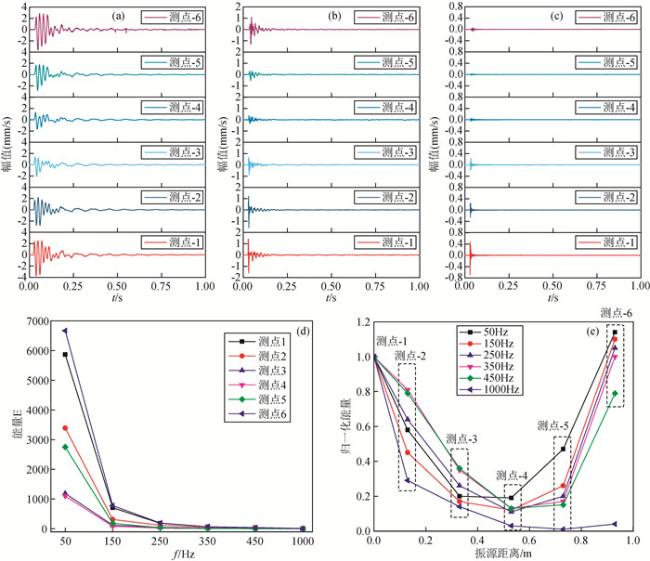
图6 纵向测点应力波信号情况(a)50 Hz激励纵向测点时域曲线;(b)250 Hz激励纵向测点时域曲线;(c)1000 Hz激励纵向测点时域曲线;(d)纵向测点能量随频率变化曲线;(e)纵向测点能量衰减曲线. Fig 6 Longitudinal measurement point stress wave signal conditions (a)Time-domain curve of the longitudinal measurement point excitation signal at 50 Hz; (b)Time-domain curve of the longitudinal measurement point excitation signal at 250 Hz; (c)Time-domain curve of the longitudinal measurement point excitation signal at 1000 Hz; (d)Curve of energy variation with frequency for the longitudinal measurement points; (e)Energy decay curve for longitudinal measurement points. |
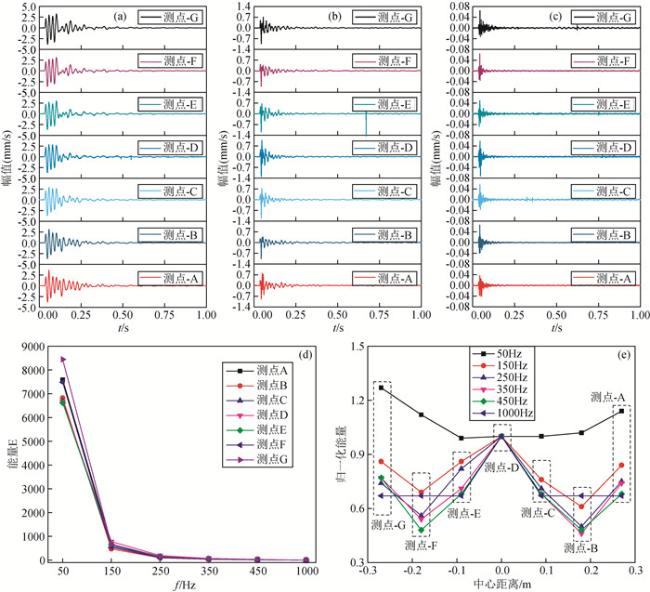
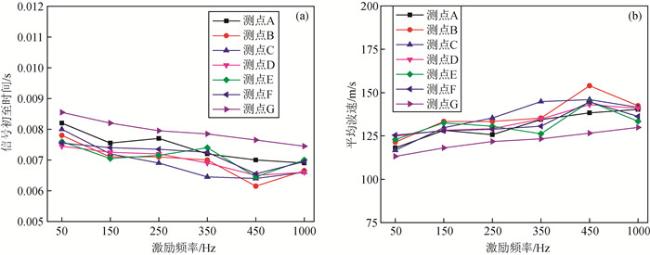
图7 横向测点应力波信号情况(a)50 Hz激励横向测点时域曲线;(b)250 Hz激励横向测点时域曲线;(c)1000 Hz激励横向测点时域曲线;(d)横向测点能量随频率变化曲线;(e)横向测点能量衰减曲线. Fig 7 Lateral measurement point stress wave signal conditions (a)Time-domain curve of the lateral measurement point excitation signal at 50 Hz; (b)Time-domain curve of the lateral measurement point excitation signal at 250 Hz; (c)Time-domain curve of the lateral measurement point excitation signal at 1000 Hz; (d)Curve of energy variation with frequency for lateral measurement points; (e)Energy decay curve for lateral measurement points. |
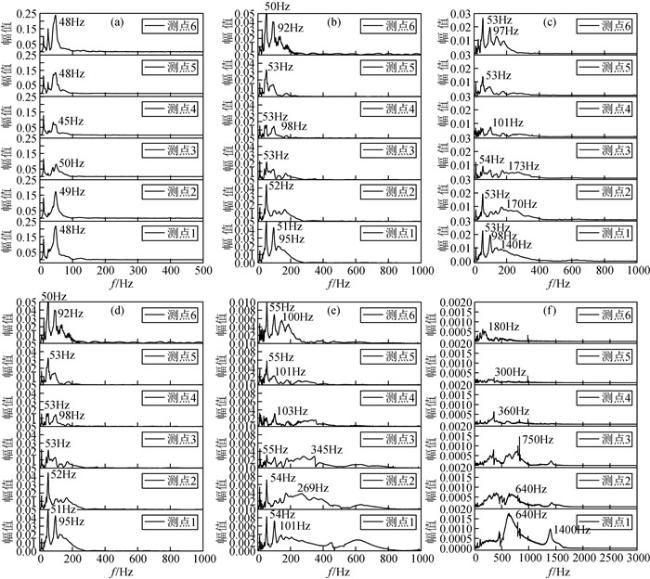
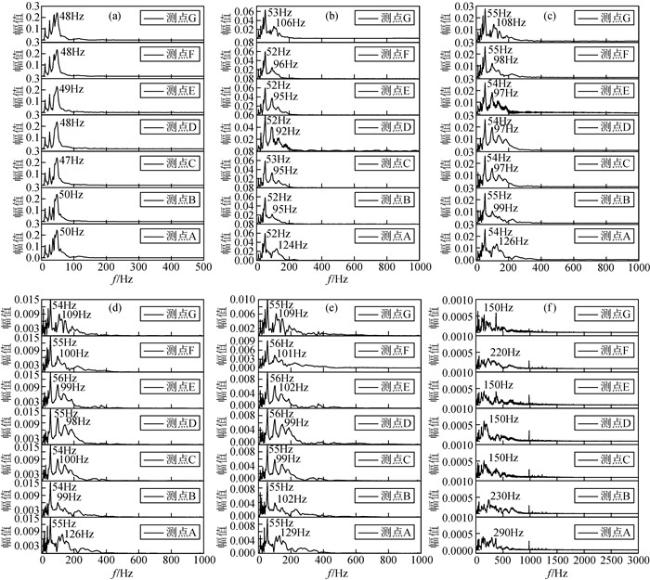
图8 各纵向测点信号频率曲线(a)50 Hz激励纵向测点信号频率;(b)150 Hz激励纵向测点信号频率;(c)250 Hz激励纵向测点信号频率;(d)350 Hz激励纵向测点信号频率;(e)450 Hz激励纵向测点信号频率;(f)1000 Hz激励纵向测点信号频率. Fig 8 Frequency curves of each longitudinal measurement point signal (a)Frequency of the longitudinal measurement point signal excited at 50 Hz; (b)Frequency of the longitudinal measurement point signal excited at 150 Hz; (c)Frequency of the longitudinal measurement point signal excited at 250 Hz; (d)Frequency of the longitudinal measurement point signal excited at 350 Hz; (e)Frequency of the longitudinal measurement point signal excited at 450 Hz; (f)Frequency of the longitudinal measurement point signal excited at 1000 Hz. |
图9 各横向测点信号频率曲线(a)50 Hz激励横向测点信号频率;(b)150 Hz激励横向测点信号频率;(c)250 Hz激励横向测点信号频率;(d)350 Hz激励横向测点信号频率;(e)450 Hz激励横向测点信号频率;(f)1000 Hz激励横向测点信号频率. Fig 9 Frequency curves of each lateral measurement point signal (a)Frequency of the lateral measurement point signal excited at 50 Hz; (b)Frequency of the lateral measurement point signal excited at 150 Hz; (c)Frequency of the lateral measurement point signal excited at 250 Hz; (d)Frequency of the lateral measurement point signal excited at 350 Hz; (e)Frequency of the lateral measurement point signal excited at 450 Hz; (f)Frequency of the lateral measurement point signal excited at 1000 Hz. |
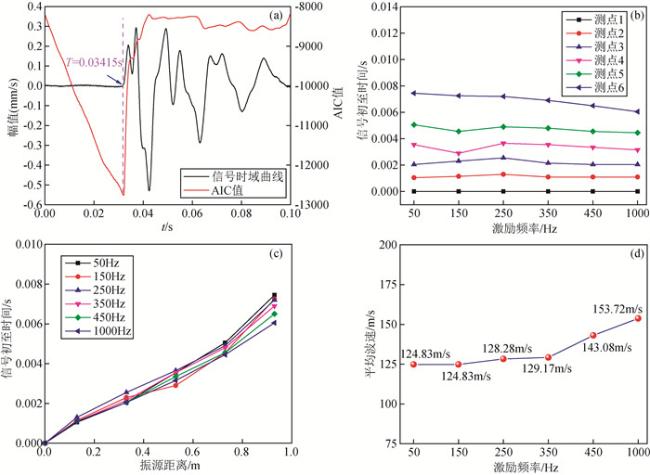
图10 纵向测点初至时间与波速(a)AIC法提取信号初至时间;(b)纵向测点信号初至时间与频率的关系;(c)纵向测点信号初至时间与振源距离的关系;(d)纵向测点平均波速. Fig 10 Arrival time and wave velocity of longitudinal measurement points (a)AIC method for extracting signal arrival time; (b)Relationship between the arrival time of longitudinal measurement point signal and frequency; (c)Relationship between the arrival time of longitudinal measurement point signal and the distance from the vibration source; (d)Average wave velocity for longitudinal measurement points. |
图12 土体上表面扫描试验方案(a)土体上表面扫描试验方案示意图(纵向剖切图);(b)土体上表面扫描试验装置;(c)扫描区荧光粉均匀性测试. Fig 12 Experimental plan for surface scanning of soil (a)Schematic diagram of the scanning test plan on the surface of the soil (longitudinal section); (b)Soil surface scanning test setup; (c)Testing the uniformity of fluorescent powder in the scanning area. |
表2 材料属性参数Table 2 Material property parameters |
| 混凝土板 | 土体 | |
| 弹性模量/MPa | 30000 | 145 |
| 密度/(kg/m3) | 2500 | 1836 |
| 泊松比 | 0.21 | 0.37 |
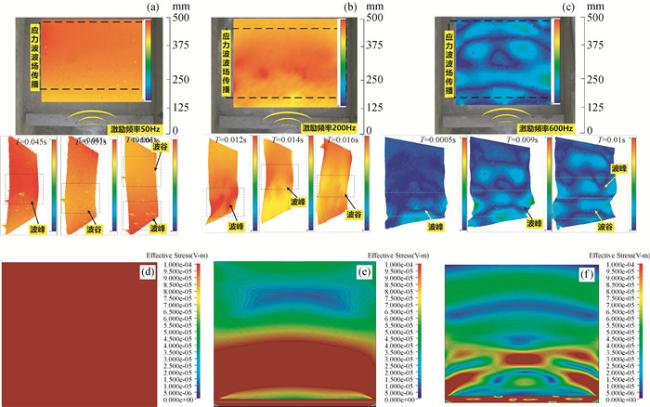
图14 土体上表面应力波波场传播情况(a)激励频率50 Hz波场实测;(b)激励频率200 Hz波场实测;(c)激励频率600 Hz波场实测;(d)激励频率50 Hz波场仿真;(e)激励频率200 Hz波场仿真;(f)激励频率600 Hz波场仿真. Fig 14 Propagation of stress wave field on the surface of soil (a)Experimental measurement of wave field at excitation frequency of 50 Hz; (b)Experimental measurement of wave field at excitation frequency of 200 Hz; (c)Experimental measurement of wave field at excitation frequency of 600 Hz; (d)Simulation of wave field at excitation frequency of 50 Hz; (e)Simulation of wave field at excitation frequency of 200 Hz; (f)Simulation of wave field at excitation frequency of 600 Hz. |
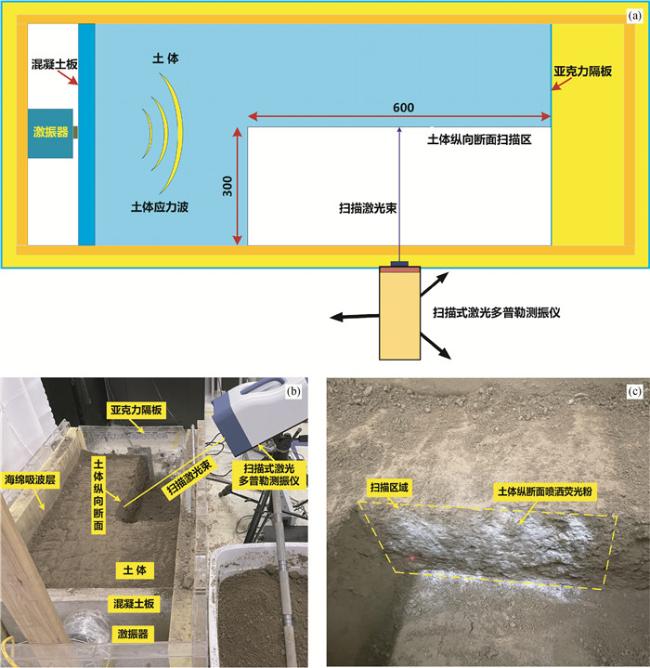
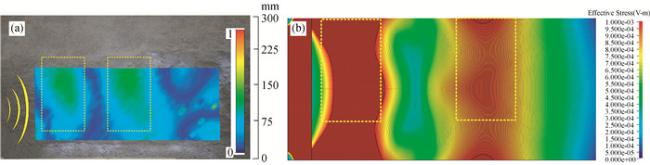
图15 土体纵断面扫描试验设计(a)土体纵断面扫描试验示意图;(b)土体纵断面扫描试验装置;(c)土体纵断面扫描区域. Fig 15 Experimental design for cross-sectional scanning of soil (a)Schematic diagram of the longitudinal cross-section scanning test on the soil; (b)Soil longitudinal cross-section scanning test setup; (c)Area of longitudinal cross-section scanning on the soil. |
感谢审稿专家提出的修改意见和编辑部的大力支持!
|
|
|
|
|
|
|
|
|
|
|
|
|
|
|
|
|
|
|
|
|
|
|
|
|
|
|
|
|
|
|
|
|
|
|
|
|
|
|
|
|
|
|
|
|
|
|
|
|
|
|
|
|
|
|
|
|
|
|
|
|
|
|
|
/
| 〈 |
|
〉 |