
Research on soil pore structure extraction model for microfluidic chips
Received date: 2024-01-26
Online published: 2025-01-14
Copyright
Due to the opacity of soil, it is difficult to observe the fluid movement and ecological processes inside soil pores in detail, which has always been a difficulty and hot spot in research. Microfluidic chips developed in recent years provide a visualization platform for pore-scale observation. In order to depict a more realistic soil pore structure on the microfluidic chip, this study constructed two two-dimensional soil pore structure models based on the Monte Carlo algorithm and the watershed algorithm. By performing seepage simulation within the structure using the lattice Boltzmann method, the permeability and two-phase flow saturation of the structure were analyzed. Research results show that the pore structure generated by the Monte Carlo algorithm is closer to the real soil sample in terms of pore parameters and permeability, while the pore structure generated by the watershed algorithm is closer to the soil sample in terms of saturation. In addition, the goodness of fit of the multiple linear regression analysis between the simulation results of permeability and saturation and the pore parameters is 0.96 and 0.99 respectively. The hydraulic characteristics of the model are highly correlated with the pore parameters. Therefore, the soil microfluidic structure extraction scheme proposed in this article is better than the traditional cylindrical scheme and is more in line with the actual soil structural characteristics.
LiuWu FU , YiDing WU , XiaoYu LIANG , HongXiang ZHOU . Research on soil pore structure extraction model for microfluidic chips[J]. Progress in Geophysics, 2024 , 39(6) : 2483 -2492 . DOI: 10.6038/pg2024II0039
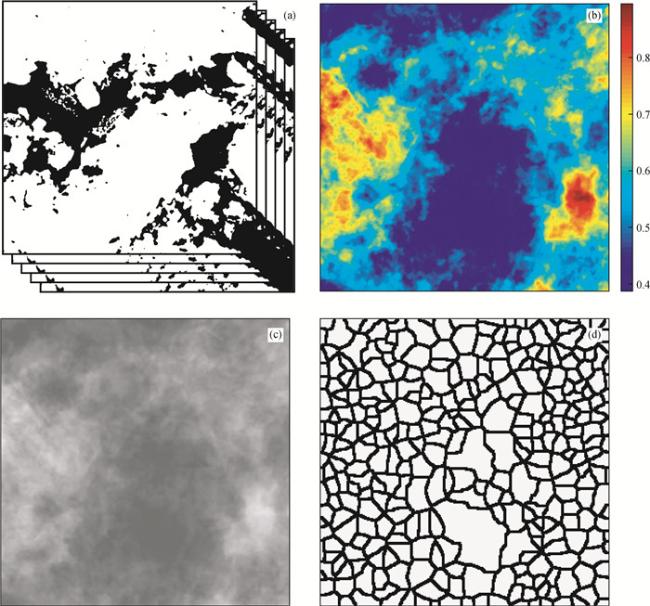
图4 基于分水岭算法的孔隙结构提取步骤示意图(a)二值图像的堆叠示例;(b)二值图像堆叠生成的颗粒密度图;(c)灰度图展示的颗粒密度图;(d)利用颗粒密度灰度图分割的孔隙结构. Fig 4 Schematic diagram of pore structure generation based on watershed algorithm. (a) Example of stacking binary images; (b) Particle density map generated by stacking binary images; (c) Particle density map displayed in grayscale image; (d) Pore structure segmented using particle density grayscale map. |
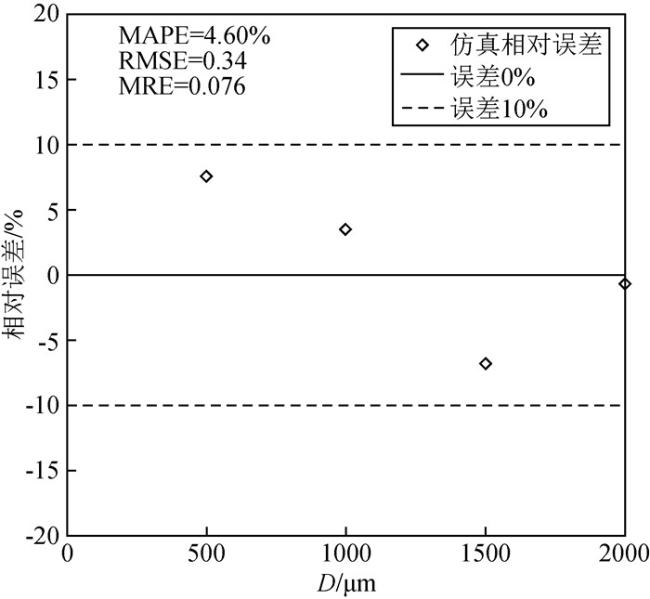
表1 渗透率仿真验证Table 1 Permeability simulation verification |
| 芯片模型 | 实验值/(10-11 m2) | 仿真值/(10-11 m2) |
| 500 μm | 5.07 | 5.45 |
| 1000 μm | 6.11 | 6.32 |
| 1500 μm | 7.51 | 6.99 |
| 2000 μm | 8.66 | 8.61 |
表3 孔隙结构参数统计Table 3 Pore structure parameter data |
| 结构名 | S | C | F1 | F2 | M1 | M2 |
| 孔隙率 | 25.13 | 66.88 | 25.51 | 67.18 | 25.64 | 66.81 |
| 连通性 | -645 | -1023 | -137 | -403 | -56 | -627 |
| 迂曲度 | 1.23 | 1.07 | 1.48 | 1.17 | 1.19 | 1.13 |
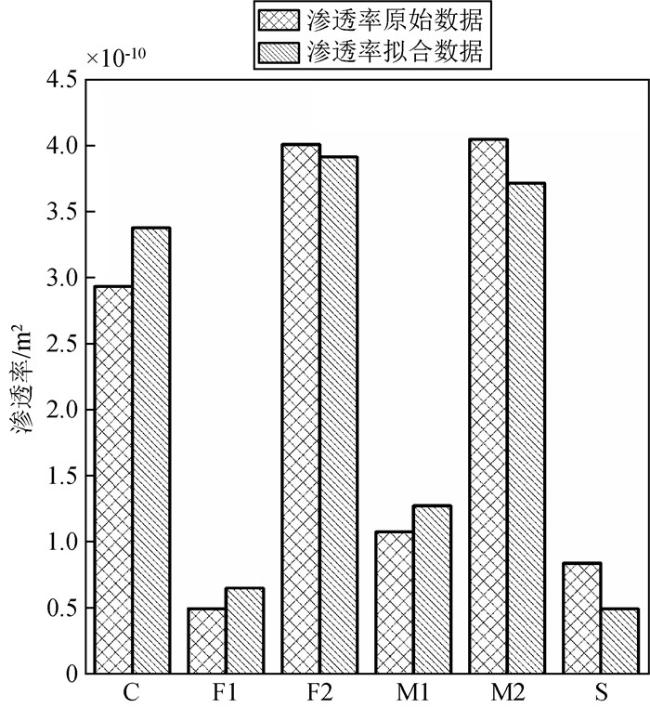
表4 孔隙结构的渗透率模拟Table 4 Permeability simulation of pore structure |
| 结构名称 | 渗透率/m2 |
| S | 8.43×10⁻¹¹ |
| C | 2.93×10⁻¹⁰ |
| F1 | 4.99×10⁻¹¹ |
| F2 | 3.99×10⁻¹⁰ |
| M1 | 1.08×10⁻¹⁰ |
| M2 | 4.03×10⁻¹⁰ |
感谢审稿专家提出的修改意见和编辑部的大力支持!
|
|
|
|
|
|
|
|
|
|
|
|
|
|
|
|
|
|
|
|
|
|
|
|
|
|
|
|
|
|
|
|
|
|
|
|
|
|
|
|
|
|
/
| 〈 |
|
〉 |