
Applicability analysis of improved STA/LTA algorithm for MEMS seismograph
Received date: 2024-07-12
Online published: 2025-05-09
Copyright
The MEMS seismograph developed based on Micro-Electro-Mechanical System (MEMS) technology has the advantages of easy integration, low maintenance cost and low power consumption, and is widely used in the field of seismic monitoring. However, the integrated software and hardware resources of MEMS seismograph are limited, and it is greatly interfered by the instrument's own noise and other factors, resulting in low-quality seismic signal measurements, which requires higher embedding algorithm. To solve this problem, this paper proposes an improved Short Term Average/Long Term Average (STA/LTA) algorithm that is more suitable for MEMS seismographs. Firstly, the characteristic function of Anti-interference (AR) is constructed to suppress the interference of baseline drift and low-frequency noise, and improve the anti-interference ability of the STA/LTA algorithm to pick up seismic events. Secondly, the method of "delay time window" is proposed to improve the computational efficiency and picking accuracy of the STA/LTA algorithm, and reduce the occupation of MEMS integration resources by the STA/LTA algorithm. Finally, the influence of different time window sizes on the picking efficiency of STA/LTA algorithm is further explored by combining the time window position. The simulation results of actual seismic data show that the improved STA/LTA algorithm proposed in this paper has higher computational efficiency, stronger real-time and anti-interference ability, and is more suitable for integrating MEMS seismometers with limited resources.
GuoYong ZHAO , Lei QIU , CaiHua LI , Jian ZHANG . Applicability analysis of improved STA/LTA algorithm for MEMS seismograph[J]. Progress in Geophysics, 2025 , 40(2) : 448 -459 . DOI: 10.6038/pg2025II0133
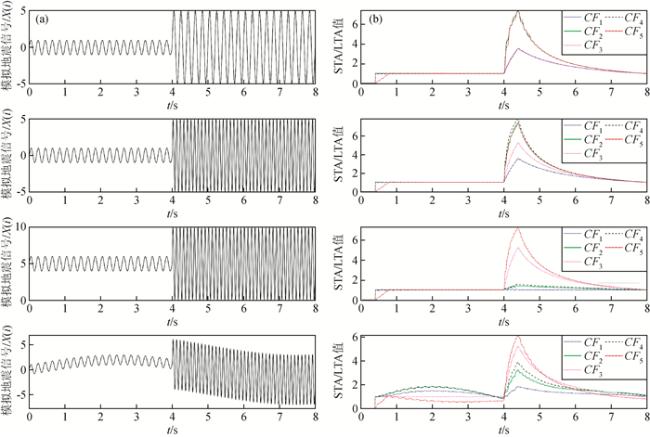
图1 (a) 模拟地震信号;(b)不同特征函数计算相应地震信号的STA/LTA值曲线Fig 1 (a) Simulate seismic signals; (b) STA/LTA value curves of corresponding seismic signals calculated by different characteristic functions |
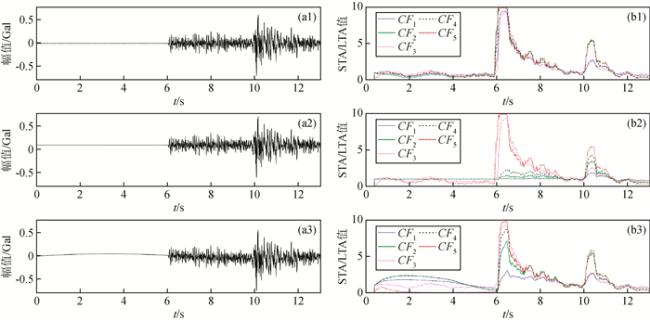
图2 (a1) 原始地震信号;(a2)存在0.1 Gal基线漂移的模拟地震信号;(a3)存在0.1 Hz低频噪声的模拟地震信号;(b1)(b2)(b3)不同特征函数计算相应地震信号的STA/LTA值曲线Fig 2 (a1) Original seismic signal; (a2) Simulated seismic signal with a baseline drift of 0.1 Gal; (a3) Simulated seismic signal with 0.1 Hz low-frequency noise; (b1)(b2)(b3) STA/LTA value curves of corresponding seismic records calculated by different characteristic functions |
表1 特征函数CF2(i)~CF5(i)的计算结果Table 1 Calculation results of characteristic functions CF2(i)~CF5(i) |
| 特征函数 | 数据序号 | 人工拾取初至/s | 算法拾取初至/s | 时间偏差/s | 平均时间偏差/s | 特征函数 | 数据序号 | 人工拾取初至/s | 算法拾取初至/s | 时间偏差/s | 平均时间偏差/s | |
|---|---|---|---|---|---|---|---|---|---|---|---|---|
| 注:“—”表示该阈值下未能拾取任何地震波初至,或拾取结果偏差过大,“阈值过高”表示STA/LTA曲线上没有高于该阈值的点. | ||||||||||||
| CF2 | 1 | 306.82 | 306.835 | 0.015 | 0.080 | CF3 | 1 | 306.82 | 306.840 | 0.020 | 0.061 | |
| 2 | 315.51 | 阈值过高 | — | 2 | 315.51 | 阈值过高 | — | |||||
| 3 | 326.43 | 326.560 | 0.130 | 3 | 326.43 | 阈值过高 | — | |||||
| 4 | 351.27 | 164.320 | — | 4 | 351.27 | 351.305 | 0.035 | |||||
| 5 | 304.01 | 304.080 | 0.070 | 5 | 304.01 | 304.075 | 0.065 | |||||
| 6 | 359.32 | 167.295 | — | 6 | 359.32 | 359.440 | 0.120 | |||||
| 7 | 339.97 | 340.020 | 0.050 | 7 | 339.97 | 340.015 | 0.045 | |||||
| 8 | 351.67 | 阈值过高 | — | 8 | 351.67 | 阈值过高 | — | |||||
| 9 | 326.82 | 89.725 | — | 9 | 326.82 | 326.855 | 0.035 | |||||
| 10 | 322.43 | 322.565 | 0.135 | 10 | 322.43 | 322.540 | 0.110 | |||||
| CF4 | 1 | 306.82 | 306.830 | 0.010 | 0.065 | CF5 | 1 | 306.82 | 306.830 | 0.010 | 0.048 | |
| 2 | 315.51 | 阈值过高 | — | 2 | 315.51 | 315.560 | 0.050 | |||||
| 3 | 326.43 | 326.570 | 0.140 | 3 | 326.43 | 326.545 | 0.115 | |||||
| 4 | 351.27 | 351.300 | 0.030 | 4 | 351.27 | 351.285 | 0.015 | |||||
| 5 | 304.01 | 304.075 | 0.065 | 5 | 304.01 | 304.070 | 0.060 | |||||
| 6 | 359.32 | 89.725 | — | 6 | 359.32 | 359.445 | 0.125 | |||||
| 7 | 339.97 | 340.015 | 0.045 | 7 | 339.97 | 340.015 | 0.045 | |||||
| 8 | 351.67 | 阈值过高 | — | 8 | 351.67 | 351.695 | 0.025 | |||||
| 9 | 326.82 | 326.865 | 0.045 | 9 | 326.82 | 326.840 | 0.020 | |||||
| 10 | 322.43 | 322.550 | 0.120 | 10 | 322.43 | 322.530 | 0.010 | |||||
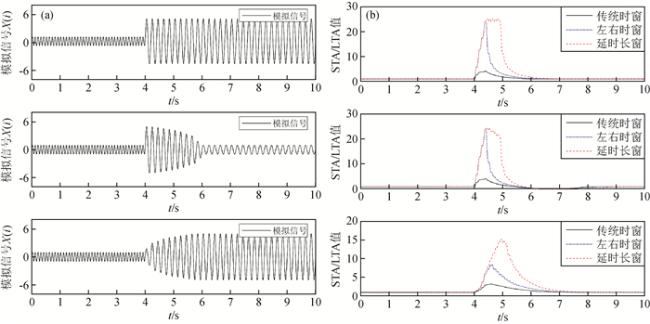
图3 (a) 不同包络模拟地震信号;(b)不同时窗位置计算相应地震信号的STA/LTA值曲线Fig 3 (a)Simulated seismic signals with different envelops; (b)STA/LTA value curves of the corresponding seismic signals are calculated at different window positions |
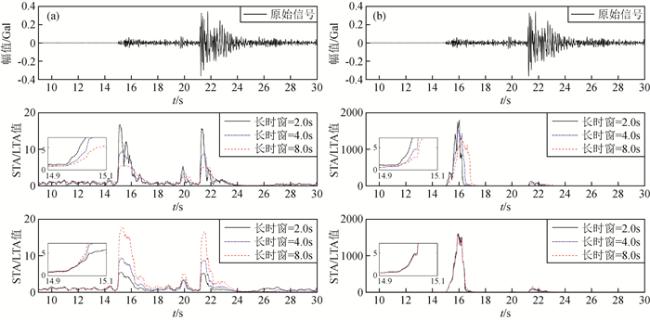
图5 (a) 传统时窗位置下,不同大小长、短时窗拾取地震信号的STA/LTA值曲线;(b)延时长窗位置下,不同大小长、短时窗拾取地震信号的STA/LTA值曲线Fig 5 (a) STA/LTA value curves of seismic signal are picked up by different sizes of long and short time windows at traditional time window position; (b)STA/LTA value curves of seismic signal are picked up by different sizes of long and short windows at the position of long delayed window |
表2 传统时窗和延时长窗位置下不同大小长、短时窗拾取地震波初至结果Table 2 Arrival results of seismic event are picked up by long and short time windows of different sizes under the traditional time window and the delayed time window position |
| 时窗类型 | 长时窗/s | 短时窗/s | 算法拾取初至/s | 人工拾取初至/s | 时间偏差/s |
|---|---|---|---|---|---|
| 传统时窗 | 4.0 | 0.2 | 15.010 | 14.990 | 0.020 |
| 0.4 | 15.040 | 0.050 | |||
| 0.8 | 15.075 | 0.085 | |||
| 2.0 | 0.4 | 15.065 | 0.075 | ||
| 4.0 | 15.040 | 0.050 | |||
| 8.0 | 15.035 | 0.045 | |||
| 延时长窗 | 4.0 | 0.2 | 15.010 | 14.990 | 0.020 |
| 0.4 | 15.040 | 0.050 | |||
| 0.8 | 15.055 | 0.065 | |||
| 2.0 | 0.4 | 15.035 | 0.045 | ||
| 4.0 | 15.035 | 0.045 | |||
| 8.0 | 15.035 | 0.045 |
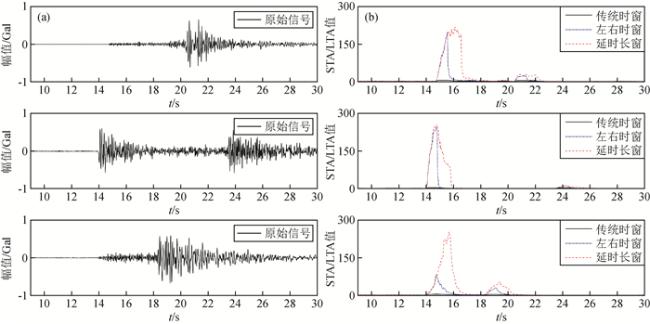
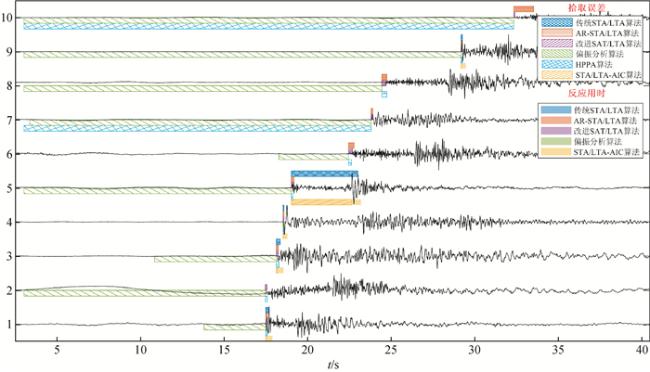
图8 10条归一化垂直向地震记录与不同算法拾取原始地震波初至结果对比图网状色条两端分别表示人工拾取初至和算法拾取初至结果、纯色色条表示算法反应用时. Fig 8 Comparison of ten normalized vertical seismic records and the first arrival results of original seismic records picked by different algorithms The extremities of the mesh color bars represent the manually picked first arrivals and the algorithm-picked first arrivals respectively, while the solid color bars represent the algorithm response times. |
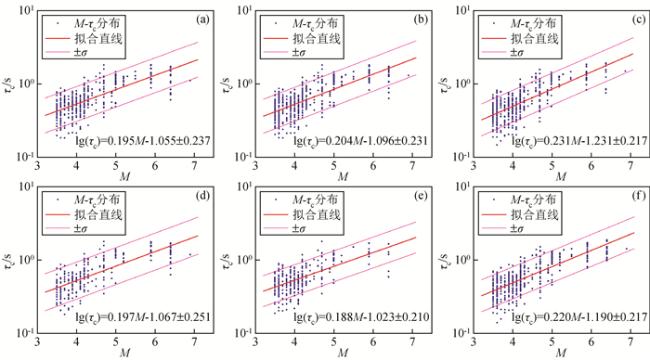
图9 (a)—(f)分别表示传统STA/LTA、AR-STA/LTA、改进STA/LTA、偏振分析、HPPA和STA/LTA-AIC算法计算出的τc值与震级在3 s时窗下的统计关系红色实线表示线性拟合直线,品红色实线表示一倍标准差. Fig 9 (a)—(f) Respectively show the statistical relationship between the τc values calculated by the traditional STA/LTA, AR-STA/LTA, improved STA/LTA, polarization analysis, HPPA, and STA/LTA-AIC algorithms and the magnitude within a 3 s window The red solid line represents the linear fit line, and the magenta solid line represents one standard deviation. |
感谢国家地震科学数据中心(https://data.earthquake.cn)提供的数据支持,感谢审稿专家提出的修改意见.
|
Akaike H. 1973. Information theory and an extension of the maximum likelihood principle. //Proceeding in Second International Symposium on Information Theory. Budapest: Akademiai Kiado, 267-281.
|
|
|
|
|
|
|
|
|
|
|
|
|
|
|
|
|
|
|
|
|
|
|
|
|
|
Li C L. 2013. Research and achievement on earthquake intensity monitoring technology based on MEMS accelerometer [Master's thesis](in Chinese). Wuhan: Institute of Seismology, China Earthquake Administration, 18-39.
|
|
|
|
|
|
|
|
|
|
|
|
|
|
Meyer J H. 1988. First comparative results of integral and instantaneous polarization attributes for multicomponent seismic data. Institut Francais Du Petrole, France.
|
|
|
|
|
|
|
|
|
|
Qiu L. 2023. Research and application of seismic wave recognition algorithm in earthquake early warning [Master's thesis](in Chinese). Langfang: Institute of Disaster Prevention, doi: 10.27899/d.cnki.gfzkj.2023.000021.
|
|
|
|
|
|
|
|
|
|
|
|
|
|
|
|
|
|
|
|
|
|
|
|
|
|
|
|
|
|
李昌珑. 2013. 基于MEMS加速度传感器的地震烈度监测技术研究与实现[硕士论文]. 武汉: 中国地震局地震研究所, 18-39.
|
|
|
|
|
|
|
|
|
|
|
|
|
|
邱磊. 2023. 地震预警中地震波识别算法研究及应用[硕士论文]. 廊坊: 防灾科技学院, doi: 10.27899/d.cnki.gfzkj.2023.000021.
|
|
|
|
|
/
| 〈 |
|
〉 |