
Classification of seabed sediment based on multi-beam backscatter statistical distribution
Received date: 2024-05-18
Online published: 2025-05-09
Copyright
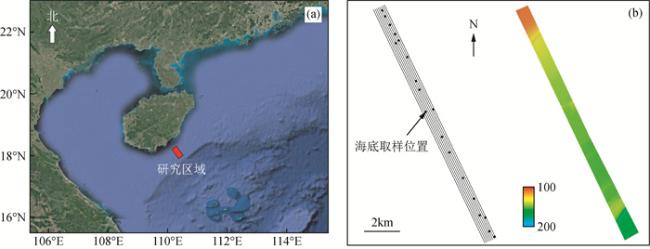
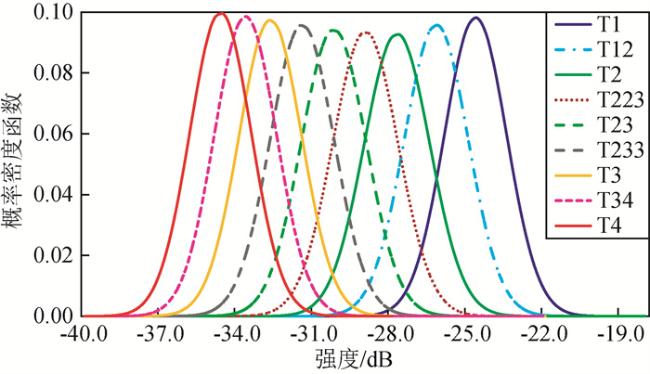
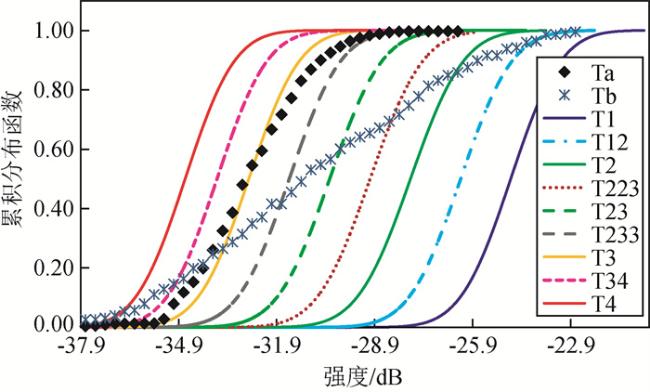
Multi-beam Backscatter Strength (BS) data can be used to identify the types of the seafloor and the distribution of seafloor geological hazards, but the traditional method for BS data interpretation is time-consuming and subjective. We applied K-S test techniques to automatically interpret the multibeam BS data. After eliminating the effect of incidence angle, our statistics analysis show that four typical sediments have the Gaussian distributions, and there is a good correlation between BS and the grain size of seafloor sediments. Based on the distribution trends, five other BS distributions were constructed the missing typical seafloor without seafloor samplings. Then, we performed a single sample K-S test method to classify the seafloor sediments for the whole surveyed region. The unknown types of seafloor sediments can be judged and classified by compared their BS distribution with the known typical Gaussian distributions and measuring the similarity between the two. Through experimental comparisons, we determined the optimal window size for experiments on this area to be 30 m × 30 m. At the same time, we set the classification confidence level to 90%, and we obtained results from our experiments that the overall recognition rate (the ratio of the identified area to the total area) reached 92%, and the classification results also matched all the sampling results with high classification accuracy, and the method achieved good results. The results illustrate our automatic method can replace the conventional in-house BS interpretations and reduce offshore operation costs. It requires only a small amount of seafloor samples to achieve automatic seabed classification for the entire area. In addition, the reliability of the classification can be evaluated by a parameter of statistics analysis. The high accuracy of the classification results of this method is particularly suitable for areas where large areas of typical substrate are distributed.
JinHua LUO , XiangZi FENG . Classification of seabed sediment based on multi-beam backscatter statistical distribution[J]. Progress in Geophysics, 2025 , 40(2) : 798 -805 . DOI: 10.6038/pg2025HH0552
表1 海底BS统计分布特征及对应的底质类型Table 1 Statistical distribution characteristics of backscatter intensity and corresponding sediment types |
| 类型编号 | 均值/dB | 标准差/dB | 底质类型 | 图例 | 颜色 |
|---|---|---|---|---|---|
| 注:表中粗体T1、T2、T3和T4有海底取样支持. | |||||
| T1 | -24.73 | 1.22 | 中到粗砂 |  | 蓝 |
| T12 | -26.26 | 1.25 | 细砂 |  | 青 |
| T2 | -27.82 | 1.29 | 粉质细砂 |  | 深绿 |
| T223 | -29.04 | 1.28 | 砂质粉土-粉质细砂 |  | 暗红 |
| T23 | -30.28 | 1.27 | 砂质粉土 |  | 浅绿 |
| T233 | -31.50 | 1.25 | 粉土-砂质粉土 |  | 灰 |
| T3 | -32.75 | 1.23 | 粉土 |  | 橙 |
| T34 | -33.73 | 1.22 | 粉质黏土 |  | 洋红 |
| T4 | -34.70 | 1.20 | 黏土 |  | 红 |
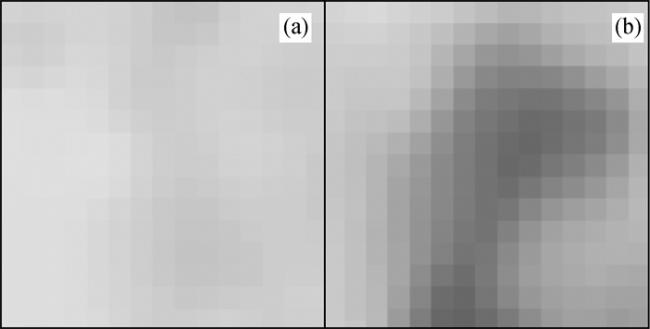
图4 窗口划分示意图图中每个窗口内包含15×15个BS数据. Fig 4 Schematic diagram of window division Each window in the figure contains 15×15 BS data. |
感谢审稿专家提出的修改意见和编辑部的大力支持!
|
|
|
|
|
Briggs K B. 1994. High-frequency acoustic scattering from sediment interface roughness and volume inhomogeneities [Ph. D. thesis]. Coral Gables: University of Miami, 154.
|
|
Briggs K B, Williams K L, Richardson M D, et al. 2001. Effects of changing roughness on acoustic scattering: (1) natural changes. //Proceedings of the Institute of Acoustics. Milton Keynes: Institute of Acoustics, 375-382.
|
|
|
|
|
|
Clarke J E H. 2004. Seafloor characterization using keel-mounted sidescan: proper compensation for radiometric and geometric distortion. // Canadian Hydrographic Conference. Ottawa: CDROM, 1-18.
|
|
|
|
|
|
|
|
de Oliveira Junior A M. 2007. Maximizing the coverage and utility of multibeam backscatter for seafloor classification [Master's thesis]. Fredericton: The University of New Brunswick, 1-25.
|
|
|
|
Fonseca L E, Mayer L A, Kraft B J. 2005. Seafloor Characterization through the application of AVO analysis to multibeam sonar data. //Pace N G, Blondel P eds. Boundary Influences in High Frequency, Shallow Water Acoustics. City of Bath: University of Bath, 241-250.
|
|
|
|
|
|
|
|
Imen K, Fablet R, Boucher J M, et al. 2005. Statistical discrimination of seabed textures in sonar images using co-occurrence statistics. //Europe Oceans 2005. Brest: IEEE, 605-610.
|
|
|
|
|
|
|
|
|
|
|
|
|
|
|
|
|
|
|
|
|
|
|
|
|
|
|
|
Parnum I M. 2007. Benthic habitat mapping using multibeam sonar systems. Perth: Curtin University of Technology.
|
|
|
|
|
|
|
|
Siwabessy P J W, Tseng Y T, Gavrilov A N. 2004. Seabed habitat mapping in coastal waters using a normal incident acoustic technique. //Proceedings of ACOUSTICS 2004. Gold Coast, 187-192.
|
|
Siwabessy P J W, Gavrilov A N, Duncan A J, et al. 2006. Statistical analysis of high-frequency multibeam backscatter data in shallow water. //Proceedings of ACOUSTICS 2006. Christchurch.
|
|
|
|
|
|
|
|
|
|
Xu C. 2014. Study on seabed classification technology based on multibeam bathymetry sonar [Ph. D. thesis](in Chinese). Harbin: Harbin Engineering University.
|
|
|
|
|
|
|
|
|
|
徐超. 2014. 多波束测深声呐海底底质分类技术研究[博士论文]. 哈尔滨: 哈尔滨工程大学.
|
|
|
|
|
/
| 〈 |
|
〉 |


