
Calculation of high-speed train speed based on the generalized cross-correlation delay algorithm of two stations
Received date: 2024-04-29
Online published: 2025-05-09
Copyright
How to accurately measure the speed of high-speed train has always been a hot issue in the research on high-speed railway. This paper introduces generalized cross-correlation time delay estimation algorithms to analyze dual-station recorded waves of ground vibrations induced by trains, and calculates train speeds. We capture waves of ground vibrations induced by trains along the high-speed railway between Yunnanyi station and Xiangyun station in the Guangtong—Dali railway section with seismographs. Then we analyze waves recorded in a pair of seismographs with three generalized cross-correlation time delay estimation algorithms, or PHAT weighting, SCOT weighting and ROTH weighting, and with basic cross-correlation time delay estimation algorithm respectively. The results of analyses show that compared to the other three algorithms the PHAT weighting effectively sharpens the maximum of cross-correlation function and the obtained train speeds based on this algorithm are more stable and accurate. Besides, PHAT weighting can avoid to a certain extent the problems met in the general methods of train speed measuring, such as the poor precision of instrument, the difficulties in instrument installation, etc., and can provide accurate train speed measurement for many areas where a prior information cannot be obtained. We calculate the train speed results of the three-component waveforms separately to determine which components are more accurate.When there are multiple railways, three-component autocorrelation waveform of train can be used to estimate the distance between the train and stations. For the obvious error of the train speed, we choose two wrong data to analyze the cause of the error, which is valuable in application. With the development of generalized cross-correlation technology, the calculation of time delay becomes more and more accurate.We will continue to follow the issues related to high-speed rail research and producing more valuable conclusions.
LiPing TIAN , DingChang ZHENG , Shuai ZHANG , Yan ZHANG , GuangMing WANG . Calculation of high-speed train speed based on the generalized cross-correlation delay algorithm of two stations[J]. Progress in Geophysics, 2025 , 40(2) : 861 -874 . DOI: 10.6038/pg2025HH0564
表1 广义互相关加权函数Table 1 Generalized cross-correlation weighting function |
| 函数名称 | 函数表达式 |
|---|---|
| 基本互相关CC | 1 |
| ROTH加权法 | |
| SCOT加权法 | |
| PHAT加权法 | 1/G12(ω) |
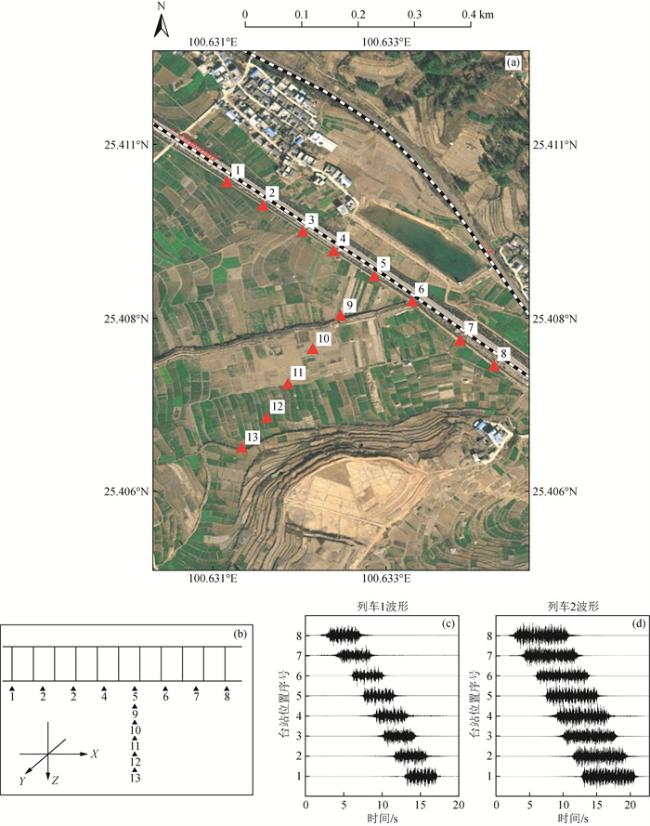
图1 观测系统及波形示意图(a) 地震仪位置分布图;(b)地震仪与高铁布置相对位置示意图,平行于铁路的方向为X方向,垂直于铁路的方向为Y方向,垂直于地面的方向为Z方向;(c)列车1在不同台站记录到的Z分量波形;(d)列车2在不同台站记录到的Z分量波形. Fig 1 Observation systems and waveform plots (a) Map showing locations of seismographs; (b) Schematic diagram of the relative position of the seismographs and the high-speed railway, Parallel to the railroad is the X direction, The direction perpendicular to the railroad is the Y direction, The direction perpendicular to the ground is the Z direction; (c) Z-component waveforms of train 1 recorded at different stations; (d) Z-component waveforms of train 2 recorded at different stations. |
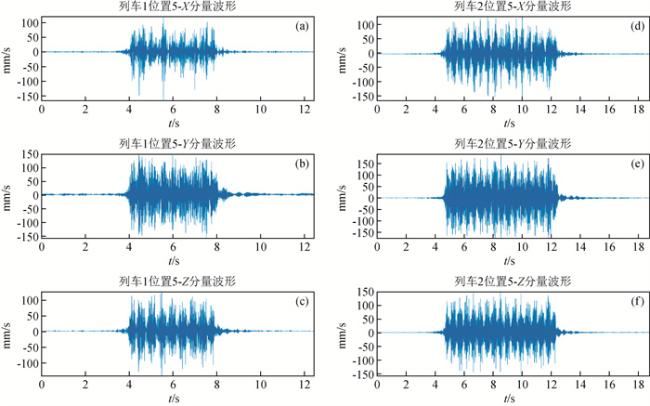
图2 地震仪在位置5记录到不同列车的三分量波形(a)—(c)列车1的三分量波形;(d)—(f)列车2的三分量波形. Fig 2 Three-component waveforms of different trains recorded at position 5 (a)—(c) Three-component waveforms of train 1;(d)—(f)Three-component waveforms of train 2. |
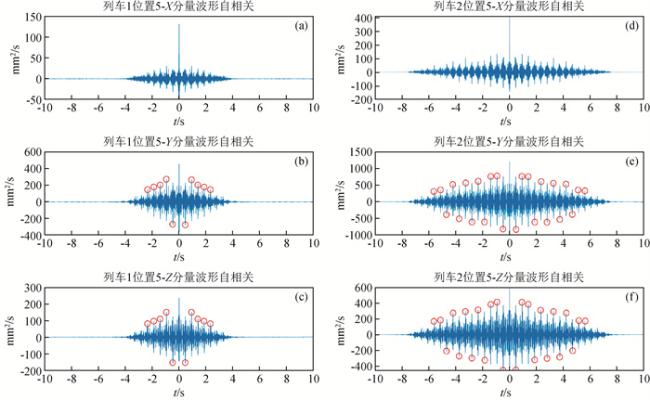
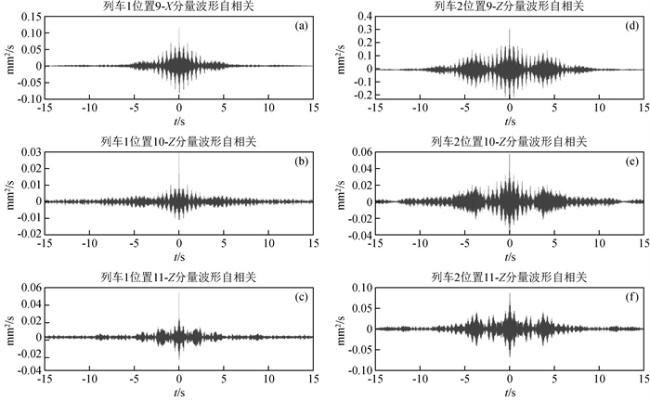
图4 地震仪在不同位置记录到不同列车波形的自相关(a)—(c)列车1在位置9~11的Z分量波形自相关;(d)—(f)列车2在位置9~11的Z分量波形自相关. Fig 4 Three-component autocorrelation waveforms of different trains recorded at different positions (a)—(c) Z-component autocorrelation waveforms of train 1 at positions 9~11;(d)—(f) Z-component autocorrelation waveforms of train 2 at positions 9~11. |
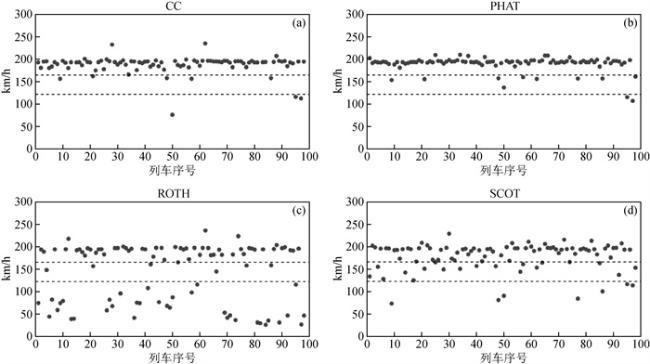
图5 98趟列车在位置3与位置8的速度分布散点图(a) 用互相关计算的列车速度散点图;(b)用PHAT加权法计算的列车速度散点图;(c)用ROTH加权法计算的列车速度散点图;(d) SCOT加权法计算列车速度散点图. Fig 5 Scatter plot of train speeds are calculated by 98 trains waveforms recorded at positions 3 and 8 (a) Scatter plot of train speed calculated by cross-correlation algorithm; (b) Scatter plot of train speed calculated by PHAT weighting; (c) Scatter plot of train speed calculated by ROTH weighting; (d) Scatter plot of train speed calculated by SCOT weighting. |
表2 一天中记录到的98趟列车Z分量通过PHAT加权法计算的可信列车速度数量与比例Table 2 The number and proportion of credible train speeds calculated by PHAT weighting for Z-component waveforms of 98 trains recorded in a single day |
| 位置序号 | 距离/m | 速度200 km/h以下的列车数量(趟) | 一天中可信列车速度的占比/% |
|---|---|---|---|
| 位置7~8 | 70.1 | 86 | 0.88 |
| 位置6~8 | 174.4 | 63 | 0.64 |
| 位置5~8 | 249.7 | 83 | 0.85 |
| 位置4~8 | 328.7 | 85 | 0.87 |
| 位置3~8 | 388.7 | 90 | 0.92 |
| 位置2~8 | 468.1 | 92 | 0.94 |
| 位置1~8 | 540.1 | 84 | 0.86 |
表3 5趟列车的Z分量分别用基本互相关方法计算得到列车的速度Table 3 Z-component waveforms of 5 trains are calculated by cross-correlation algorithm respectively to get trains speed |
| 位置序号 | 距离/m | 列车1速度/(km/h) | 列车2速度/(km/h) | 列车3速度/(km/h) | 列车4速度/(km/h) | 列车5速度/(km/h) |
|---|---|---|---|---|---|---|
| 位置7~8 | 70.1 | 181.9 | 183.0 | 290.9 | 141.5 | 111.9 |
| 位置6~8 | 174.4 | 237.5 | 202.1 | 1495.2 | 180.9 | 106.9 |
| 位置5~8 | 249.7 | 199.4 | 199.6 | 408.6 | 176.0 | 111.8 |
| 位置4~8 | 328.7 | 195.7 | 181.9 | 210.7 | 207.7 | 115.1 |
| 位置3~8 | 388.7 | 192.7 | 192.9 | 158.2 | 185.6 | 113.2 |
| 位置2~8 | 468.1 | 192.9 | 193.2 | 139.1 | 207.6 | 111.7 |
| 位置1~8 | 540.1 | 193.5 | 193.9 | 161.3 | 222.8 | 112.0 |
表4 5趟列车的Z分量分别用PHAT加权法计算得出列车的速度Table 4 Z-component waveforms of 5 trains are calculated by PHAT weighting respectively to gettrains speed |
| 位置序号 | 距离/m | 列车1速度/(km/h) | 列车2速度/(km/h) | 列车3速度/(km/h) | 列车4速度/(km/h) | 列车5速度/(km/h) |
|---|---|---|---|---|---|---|
| 位置7~8 | 70.1 | 197.9 | 191.9 | 118.7 | 188.4 | 111.1 |
| 位置6~8 | 174.4 | 187.6 | 184.3 | 182.8 | 218.9 | 101.3 |
| 位置5~8 | 249.7 | 199.2 | 193.4 | 165.6 | 207.7 | 121.9 |
| 位置4~8 | 328.7 | 194.1 | 192.6 | 162.8 | 197.6 | 109.7 |
| 位置3~8 | 388.7 | 194.6 | 191.5 | 157.2 | 197.3 | 107.6 |
| 位置2~8 | 468.1 | 193.0 | 193.3 | 158.9 | 192.3 | 111.2 |
| 位置1~8 | 540.1 | 193.2 | 192.9 | 155.1 | 225.5 | 110.2 |
表5 5趟列车的Z分量分别用SCOT加权法计算得出列车的速度Table 5 Z-component waveforms of 5 trains are calculated by SCOT weighting respectively to get trains speed |
| 位置序号 | 距离/m | 列车1速度/(km/h) | 列车2速度/(km/h) | 列车3速度/(km/h) | 列车4速度/(km/h) | 列车5速度/(km/h) |
|---|---|---|---|---|---|---|
| 注:“—”为计算的列车时延趋于0导致速度计算错误. | ||||||
| 位置7~8 | 70.1 | 183.0 | — | 161.0 | 173.9 | 108.8 |
| 位置6~8 | 174.4 | 187.8 | 198.7 | 155.1 | 202.6 | 101.6 |
| 位置5~8 | 249.7 | 198.9 | 197.8 | 151.4 | 127.2 | 115.1 |
| 位置4~8 | 328.7 | 188.5 | 185.1 | 159.6 | 199.2 | 114.6 |
| 位置3~8 | 388.7 | 207.5 | 195.2 | 99.8 | 199.1 | 113.4 |
| 位置2~8 | 468.1 | 192.9 | 193.2 | 123.4 | 180.8 | 109.0 |
| 位置1~8 | 540.1 | 188.9 | 191.9 | 161.1 | 196.4 | 111.8 |
表6 5趟列车Z分量ROTH加权法分别计算的列车速度Table 6 Z-component waveforms of 5 trains are calculated by ROTH weighting respectively to get trains speed |
| 位置序号 | 距离/m | 列车1速度/(km/h) | 列车2速度/(km/h) | 列车3速度/(km/h) | 列车4速度/(km/h) | 列车5速度/(km/h) |
|---|---|---|---|---|---|---|
| 位置7~8 | 70.1 | 8.0 | 8.4 | 3.3 | 8.4 | 4.1 |
| 位置6~8 | 174.4 | 198.7 | 22.3 | 158.4 | 181.7 | 115.1 |
| 位置5~8 | 249.7 | 31.7 | 199.8 | 207.7 | 192.9 | 111.7 |
| 位置4~8 | 328.7 | 44.1 | 195.9 | 159.1 | 205.1 | 115.1 |
| 位置3~8 | 388.7 | 193.1 | 191.5 | 158.1 | 181.3 | 27.0 |
| 位置2~8 | 468.1 | 193.0 | 193.3 | 24.6 | 191.9 | 111.2 |
| 位置1~8 | 540.1 | 193.2 | 191.8 | 153.7 | 202.2 | 111.1 |
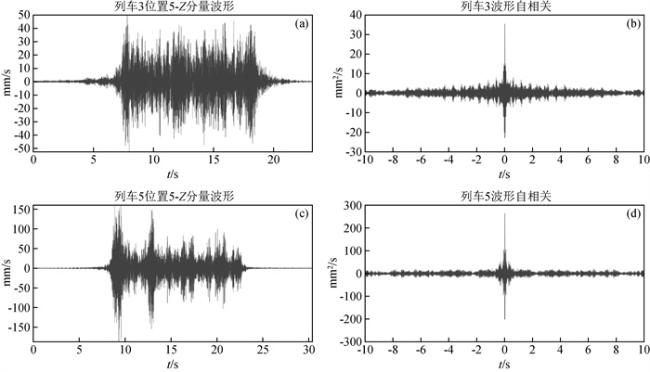
图6 位置5记录到列车3与列车5的波形与自相关图像(a)列车3的Z分量波形;(b)列车3的Z分量波形自相关图像;(c)列车5的Z分量波形;(d)列车5的Z分量自相关图像. Fig 6 Autocorrelation waveforms and waveforms of train 3 and train 5 recorded at positions 5 (a)Z-component waveform of train 3;(b)Z-component autocorrelation waveform of train 3;(c)Z-component waveform of train 5;(d) Z-component autocorrelation waveform of train 5. |
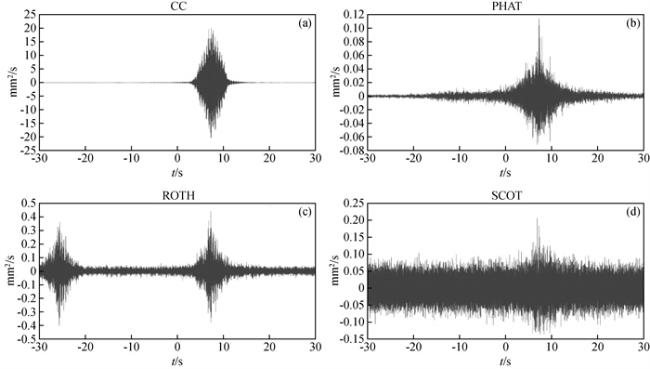
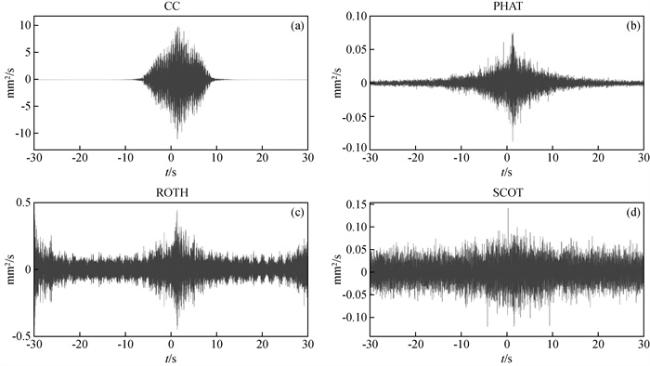
图7 位置3与位置8记录到列车1的波形互相关与广义互相关的图像(a)互相关波形;(b)PHAT加权法;(c)SCOT加权法;(d)ROTH加权法. Fig 7 Cross-correlation algorithm and generalized cross-correlation algorithm of train 1 waveforms recorded at positions 3 and 8 (a)Cross-correlation waveform; (b)PHAT weighting; (c)SCOT weighting; (d)ROTH weighting. |
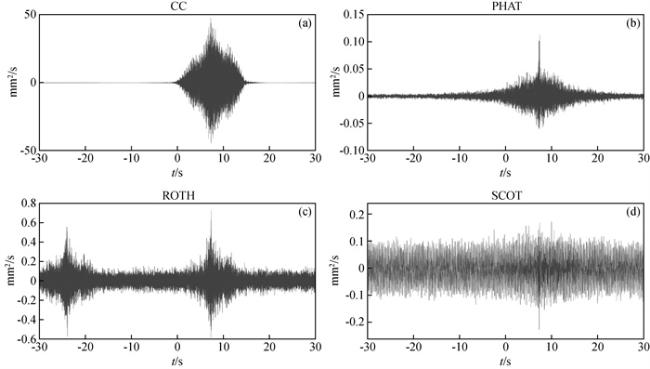
图8 位置3与位置8记录到列车2的波形互相关与广义互相关的图像(a)互相关波形; (b)PHAT加权法; (c)SCOT加权法; (d)ROTH加权法. Fig 8 Cross-correlation algorithm and generalized cross-correlation algorithm of train 2 waveforms recorded at positions 3 and 8 (a)Cross-correlated waveform; (b)PHAT weighting; (c)SCOT weighting; (d)ROTH weighting. |
表7 5趟列车Y分量PHAT加权法分别计算的列车速度Table 7 Y-component waveforms of 5 trains are calculated by PHAT weighting respectively to get trains speed |
| 位置序号 | 距离/m | 列车1速度/(km/h) | 列车2速度/(km/h) | 列车3速度/(km/h) | 列车4速度/(km/h) | 列车5速度/(km/h) |
|---|---|---|---|---|---|---|
| 位置7~8 | 70.1 | 222.3 | 198.5 | 141.2 | 155.1 | 110.2 |
| 位置6~8 | 174.4 | 248.4 | 223.0 | 166.7 | 191.0 | 112.3 |
| 位置5~8 | 249.7 | 187.0 | 197.5 | 151.0 | 193.6 | 105.1 |
| 位置4~8 | 328.7 | 189.6 | 198.1 | 259.0 | 227.9 | 112.1 |
| 位置3~8 | 388.7 | 192.9 | 193.1 | 156.7 | 198.5 | 109.2 |
| 位置2~8 | 468.1 | 193.1 | 191.6 | 157.9 | 196.0 | 109.1 |
| 位置1~8 | 540.1 | 190.2 | 191.7 | 152.7 | 209.1 | 110.0 |
表8 5趟列车X分量PHAT加权法分别计算的列车速度Table 8 X-component waveforms of 5 trains are calculated by PHAT weighting respectively to get trains speed |
| 位置序号 | 距离/m | 列车1速度/(km/h) | 列车2速度/(km/h) | 列车3速度/(km/h) | 列车4速度/(km/h) | 列车5速度/(km/h) |
|---|---|---|---|---|---|---|
| 位置7~8 | 70.1 | 189.0 | 186.8 | 140.9 | 57.8 | 161.0 |
| 位置6~8 | 174.4 | 213.9 | 168.8 | 115.6 | 129.5 | 116.8 |
| 位置5~8 | 249.7 | 189.5 | 158.5 | 163.6 | 197.8 | 115.8 |
| 位置4~8 | 328.7 | 196.4 | 182.6 | 155.3 | 197.2 | 107.3 |
| 位置3~8 | 388.7 | 187.5 | 196.5 | 245.7 | 183.1 | 102.7 |
| 位置2~8 | 468.1 | 189.3 | 192.6 | 269.7 | 199.9 | 113.1 |
| 位置1~8 | 540.1 | 204.7 | 195.5 | 215.4 | 165.6 | 104.6 |
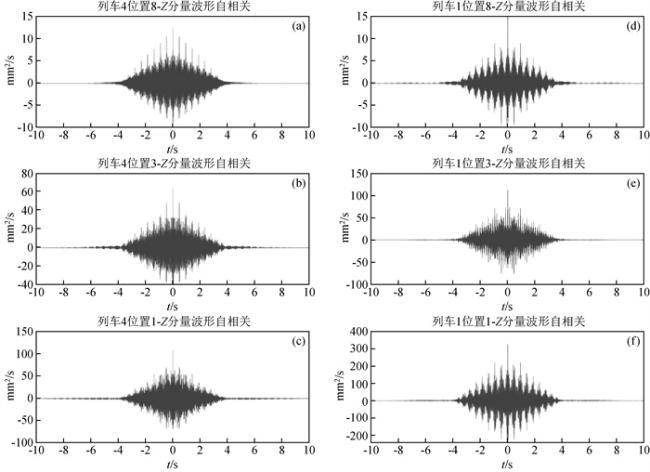
图9 列车1与列车4在不同位置的Z分量波形自相关(a)—(c)列车4在位置8、位置3、位置1的Z分量波形自相关;(d)—(f)列车1在位置8、位置3、位置1的Z分量波形自相关. Fig 9 Z-component autocorrelation waveforms of train 1 and train 4 recorded at different positions (a)—(c) Z-component autocorrelation of train 4 at position 8, position 3 and position1;(d)—(f) Z-component autocorrelation of train 1 at position 8, position 3 and position1. |
图10 位置7与位置8记录到列车2的波形互相关与广义互相关的图像(a)互相关波形;(b)PHAT加权法;(c)SCOT加权法;(d)ROTH加权法. Fig 10 Cross-correlation algorithm and generalized cross-correlation algorithm of train 2 waveforms recorded at positions 7 and 8 (a) Cross-correlation waveform; (b)PHAT weighting; (c)SCOT weighting; (d)ROTH weighting. |
感谢地球脉动科技有限公司提供三分量地震仪Ant-3C用于观测,感谢地球脉动(无锡)科技有限公司的两位专家刘胜建、杜家俊耐心指导仪器使用与数据处理,感谢评审专家提供的宝贵建议.
|
|
|
|
|
|
|
|
|
|
|
|
|
|
|
|
|
|
|
|
|
|
|
|
|
|
|
|
|
|
|
|
|
|
|
|
|
|
|
|
|
|
|
|
|
|
|
|
|
|
|
|
|
|
|
|
|
|
|
|
|
|
|
|
|
|
/
| 〈 |
|
〉 |