
Detection Methods, Pollution Characteristics, Environmental Behavior and Ecological Risk of Microplastics
Received date: 2024-07-02
Revised date: 2024-08-19
Online published: 2025-01-20
Supported by
National Natural Science Foundation of China(42377233)
As an emerging pollutant, microplastics (MPs) pollution has become a focal point of global environmental research. MPs are widely detected in various environmental matrices, including the atmosphere, soil, oceans, and inland waters. Once introduced into the environment, MPs undergo a series of transformation and transport processes across different environmental compartments and accumulate in biota, thereby posing significant threats to ecosystems and human health. This review aims to summarize the sampling and detection methods for MPs, followed by an assessment of their pollution levels in different matrices. The inter-compartmental transformation and transport of MPs, along with their ecological effects, are then reviewed and analyzed. Finally, the limitations in understanding the environmental geochemical behaviors and ecological risks of MPs, as well as prospects for future research, are outlined.
1 Introduction
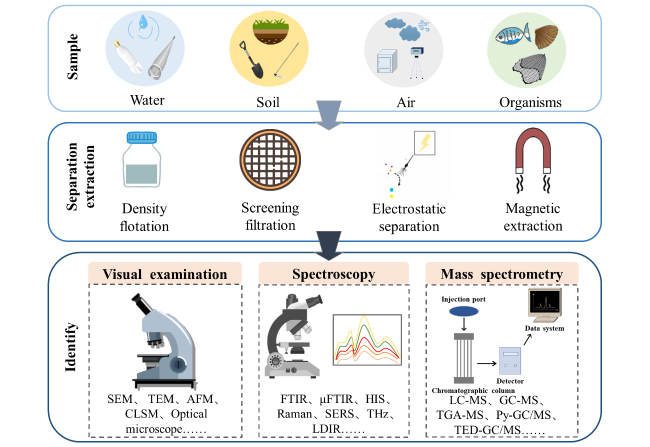
2 Detection methods of microplastics (MPs) in the environment
2.1 Sampling and separation
2.2 Detection
3 Environmental occurrences of MPs
3.1 Oceans
3.2 Freshwater
3.3 Soil
3.4 Atmosphere
4 Environmental behaviors of MPs
4.1 Weathering
4.2 Migration
5 Ecological risks of MPs
5.1 Toxicological effects of MPs on microorganisms
5.2 Toxicological effects of MPs on plants
5.3 Toxicological effects of MPs on fauna
6 Conclusions and future prospects

Xujun Liang , Yujing Ren , Ling Ding , Xinran Qiu , Xuetao Guo , Lingyan Zhu . Detection Methods, Pollution Characteristics, Environmental Behavior and Ecological Risk of Microplastics[J]. Progress in Chemistry, 2025 , 37(1) : 16 -31 . DOI: 10.7536/PC240711
Table 1 Distribution and characteristics of microplastics in marine environmentTable 1 Distribution and characteristics of microplastics in Marine environment |
| Location | Testing methods | Abundance (items/L) | Size (mm) | Morphology | Polymer types | Ref |
|---|---|---|---|---|---|---|
| China's coastal waters and marginal seas | FTIR | 0.00013~0.545 | 0~1.0 | Fibers | PE, PP, PS, PET | 30 |
| Qingdao beach | fluorescence microscope, optical microscope, ATR | 5.05~12.5 | 0.05~5 | Fibers, Particles, Fragments | PE, PP, PET, PS PA, PVC, PMA, SB | 31 |
| Tianjin coastal waters | Fluorescence stereomicroscope,Micro-infrared Raman microscope | 0.21~1.17 | >1 (24.90%), 0.5~ 1 (19.80%), <0.5 (55.30%) | Fibers, Fragments | PET, PP, PE | 32 |
| Northeast Pacific | Optical microscope | 0.008~9.18 | 0.606 ± 0.221 | Fibers | - | 33 |
| Atlantic Ocean | Optical microscope, Raman spectrometer | 0.013~0.501 | particles (0.007~0.407), fibers (0.013~10) | Fibers, Particles | PE, PP | 34 |
| Arctic Ocean | Dissection microscope, FTIR | 0~0.018 | <2 (68%) | Fibers, Particles | PE, PET, PA | 35 |
Table 2 Distribution and characteristics of microplastics in freshwater environmentTable 2 Distribution and characteristics of microplastics in freshwater environment |
| Location | Testing methods | Abundance (items/L) | Size (mm) | Morphology | Polymer types | Ref |
|---|---|---|---|---|---|---|
| Chishui River, China | Stereomicroscope, FTIR | 1.77~14.33 | 0.5~1.0 | Fibers | PE, PP, PS, PVT | 40 |
| Snake River and Lower Columbia River, USA | Micro-Raman Spectroscopy | 0~5.405 | 0.1~0.33 | Fragments, Film, Microbead | PP, PE, PET | 46 |
| Antua River, Portugal | Stereomicroscope, ATR-FTIR | 0.058~1.265 | 0.055~5 | Foam, Fibers | PP, PE | 45 |
| Nakdong of South Korea | Fourier Transform Infrared Microscope | 0.293~4.76 | 0.05~0.15 | Fibers | PP, PE/ | 47 |
| Lake Ontario, Canada | Micro-Raman Spectroscopy | 0.8~15.4 | 0.1~22 | Fibers, Fragments, Film | PE, PS, PP, PET | 5 |
Table 3 Distribution and characteristics of microplastics in soil environmentTable 3 Distribution and characteristics of microplastics in soil environment |
| Location | Testing methods | Abundance (items/L) | Size (mm) | Morphology | Polymer types | Ref |
|---|---|---|---|---|---|---|
| China | - | 1.6~6.2×10⁵ | - | - | PE, PP, PES, PS, PA | 55 |
| Shaanxi Province, China | Optical microscope, FTIR | 1430~3410 | 0~0.49 (81%) | Fiber, Thin film | HDPE, PE, PP, PET, PS, PVC | 56 |
| Mu Us Sandy Land, China | Optical microscope, FTIR | 1360~4960 | <0.5 (88%), 0.5~1 (8%) | Fiber, Thin film, Fragment, Particle | PE, PP, PS, PVC, PET | 57 |
| Germany | Transmitted light microscope, FTIR | 0~217.8 | 1~5 | Fiber, Paillon, Fragment, Thin film | PE, PP, PA | 58 |
| France | Optical microscope, ATR-FTIR | 6.7~80 | 0.001~5 | - | PE, PP, PS, PVC | 59 |
| America | Optical microscope, Micro-Raman Spectroscopy | 122~1399 | 0.005~5 | Fiber, Fragment | PE, PP, PS, PVC, PA, PES | 60 |
| Japan | FTIR | 16 745 | - | - | PE, EVA, PA, PP | 61 |
| Korea | Digital Stereo Microscope, FTIR | 700 | - | Fragment, Fiber, Thin film, Sphere | SBR/SIS, PP, PE, EPS | 62 |
Table 4 Distribution and characteristics of microplastics in atmospheric environmentTable 4 Distribution and characteristics of microplastics in atmospheric environment |
| Location | Testing methods | Abundance (items/L) | Size (mm) | Morphology | Polymer types | Ref |
|---|---|---|---|---|---|---|
| Shanghai, China | Stereomicroscope, μ-FTIR | 0.142 ± 0.142 | < 0.03 (61.6%), 0.03~0.1 (33.1%), 0.1~0.3 (4.7%), 0.3~1 (0.5%), >1 (0.03%) | Fragments (88.2±4.9%)、Fiber | PE (26.6%), PET (16.0%), PS (14.9%), PP (13.6%), PA (7.3%), PVC (6.6%) | 65 |
| Paris, France | Stereomicroscope | 1~60 (indoor) 0.3~1.5 (outdoor) | 0.05~3.25 (indoor) 0.05~1.65 (outdoor) | Fiber | Cellulose, PP | 66 |
| California, United States | Nile Red (NR) dyeing, μRaman, μFT-IR | 1.59 (indoor) 0.620 (outdoor) | 0.022~8.921 (indoor) 0.025~2.061 (outdoor) | Fiber, Film, Fragments,Particle | ET, PS, ALK | 67 |
| Aveiro, Portugal | Stereomicroscope | 5~6 | 0.017~3.669 | Fiber | PE, PP, PA | 68 |
Table 5 Toxic effects of MPs on environmental microorganismsTable 5 Toxicological effects of microplastics on environmental microorganisms |
| Polymer types | Sizes | Doses | Species | Time | Effects | Ref |
|---|---|---|---|---|---|---|
| PE, PVC, PUF, PLA | 53~300 µm | 0.5% of sediment weight | Microbial communities in coastal salt marsh sediments | 16 days | The presence of MPs altered microbial community composition and nitrogen cycling processes in sediments. PUF- and PLA-amended sediments promoted nitrification and denitrification, whereas PVC inhibited both processes. | 110 |
| PE | 30 μm | 0.2 % dry soil weight | Soil bacterial and fungal communities in diverse farmland ecosystems | 2 mouths | MPs exposure had a greater impact on soil ecosystems with a decrease in microbial diversity and functional gene abundance, and increased the abundance of pathogenic microorganisms. | 111 |
| PS | 100 μm, 100 nm | 1, 20, 100 mg/L | Microorganisms in activated sludge systems | 65 days | Excessive reactive oxygen species induced by MPs and NPs caused cytotoxicity, resulting in cytomembranes damage, and reduced biological activity. | 112 |
| PS | 80 nm | 0, 0.1, 1, 10, 50 mg/L | Pseudomonas aeruginosa | 36 h | Exposure to high concentrations of NPs (50 mg/L) triggered ROS generation, genomic DNA damage, and ATP shortage, leading to metabolic inactivation, cell lysis, and release of intracellular substances. | 113 |
| PS-NH2, PS-SO3H | 52.0 ± 6.3 nm, 71.4 ± 9.4 nm | 0.3, 3 g/kg dry soil | Soil microbial community | 42 days | NPs significantly altered soil microbial community structure and potential functions, and the effects of PS-NH2 were more pronounced than those of PS-SO3H. | 114 |
| PE | 323.3~656.8 nm | 0, 10, 50, 100, and 500 mg/L | Staphylococcus aureus, Bacillus subtilis, Escherichia coli, and Pseudomonas aeruginosa | 1, 6, 12, 24, and 36 h | The presence of PE-MPs inhibited bacterial growth, altered protein metabolism, and decreased lipid peroxidase activity. | 115 |
Table 6 Toxic effects and potential mechanisms of MPs on plantsTable 6 Toxicological effects and potential mechanisms of microplastics on plants |
| Plant | Type | Size | Concentration | Exposure mode | Effects | Ref |
|---|---|---|---|---|---|---|
| Zea mays | PS-NH2 PS-COOH | 20, 50, 100, 200 nm | 100 mg/L | Foliar exposure | Positively charged PS-NH2 treatment had a higher inhibitory effect | 69 |
| Lepidium sativum | Fluoro-Max Green Fluorescent Polymer Microspheres | 50, 500, 4500 nm | 103~107 particles /mL | Medium | NPs can reduce the germination rate of seeds | 132 |
| Oryza sativa L. | PS | <50 μm | 50, 250, 500 mg/L | Hoagland solution | NPs can reduce the metabolism of ROS, and ROS stress may lead to the obstruction of plant energy metabolism, and may also produce genetic toxicity | 140 |
| Arabidopsis thaliana | PS-SO3H, PS-NH2 | 55, 71 nm | 10, 50, 100 mg/L | Medium | Regardless of the surface charge, Arabidopsis can absorb and transport NPs smaller than 200 nanometers in size | 141 |
| Wheat | PS-NH2, PS-COOH | 50, 100, 200 nm | 20 mg/L | Medium | Few small-sized PS NPs are transported into the cytoplasm, large-sized PS NPs are only present on the epidermis | 142 |
Table 7 Toxic effects of MPs on animalsTable 7 Toxicological effects of microplastics on fauna |
| Species | Type of MPs | Particle size | Toxicological effects | Ref |
|---|---|---|---|---|
| Fish | PS | 0.3 µm, 5 µm, 70~90 µm | Oxidative stress; Neurotoxicity | 84 |
| 5 µm, 20 µm | Oxidative stress; lipid accumulation; Liver inflammation | 146 | ||
| PE | 8~12 µm | Affects lipid metabolism and gut microbiota | 155 | |
| Zooplankton | PS | 0.07 µm, 0.7µm, 7 µm | Decreased rotifer survival and reproduction | 156 |
| PET | - | Population reduction | 157 | |
| PP | 11.86~44.62 µm | Alteration in homeostasis; Increased mortality; Disrupts antioxidant biomarkers | 158 | |
| Molluscs | PS | 2 µm, 4~16 µm | Internal accumulation; Reduced feeding activity | 159 |
| Earthworm | PE | 250~1000 μm | Serious histological damages | 160 |
| C. elegans | PLA | pristine PLA (2.97 ± 0.54) µm, aged PLA (1.59 ± 0.34 µm) | Reproductive toxicity | 147 |
| PS | 1 μm | Intestinal damage and oxidative stress | 161 | |
| PS | 1 μm | Neurotoxicity | 148 | |
| Terrestrial snails | PET | 76.3 μm | Inhibited feeding and excretion of snails, and caused Pathological damage in the gastrointestinal tract | 150 |
| Mice | PS | 5 μm | Liver cells: oxidative stress, inflammation, apoptosis and necrosis; disrupted gut microbiota homeostasis | 151 |
| [1] |
|
| [2] |
|
| [3] |
|
| [4] |
|
| [5] |
|
| [6] |
|
| [7] |
|
| [8] |
|
| [9] |
|
| [10] |
|
| [11] |
|
| [12] |
|
| [13] |
|
| [14] |
|
| [15] |
(周丽,
|
| [16] |
|
| [17] |
|
| [18] |
|
| [19] |
|
| [20] |
|
| [21] |
|
| [22] |
|
| [23] |
|
| [24] |
|
| [25] |
|
| [26] |
|
| [27] |
|
| [28] |
|
| [29] |
(邢锦城, 何苏南, 洪立洲, 刘冲, 董静, 朱小梅, 陈环宇, 王凯, 郁凯, 孙果丽, 张振华. 江苏农业学报, 2023, 39(1): 277.).
|
| [30] |
|
| [31] |
(罗雅丹, 林千惠, 贾芳丽, 徐功娣, 李锋民. 环境科学, 2019, 40(6): 2631.)
|
| [32] |
(白璐, 刘宪华, 陈燕珍, 屠建波, 陈宏伟. 环境化学, 2020, (5): 8. )
|
| [33] |
|
| [34] |
|
| [35] |
|
| [36] |
|
| [37] |
|
| [38] |
|
| [39] |
|
| [40] |
|
| [41] |
|
| [42] |
|
| [43] |
|
| [44] |
|
| [45] |
|
| [46] |
|
| [47] |
|
| [48] |
|
| [49] |
|
| [50] |
|
| [51] |
|
| [52] |
|
| [53] |
|
| [54] |
|
| [55] |
|
| [56] |
|
| [57] |
|
| [58] |
|
| [59] |
|
| [60] |
|
| [61] |
|
| [62] |
|
| [63] |
|
| [64] |
|
| [65] |
|
| [66] |
|
| [67] |
|
| [68] |
|
| [69] |
|
| [70] |
|
| [71] |
|
| [72] |
|
| [73] |
|
| [74] |
|
| [75] |
|
| [76] |
|
| [77] |
|
| [78] |
|
| [79] |
|
| [80] |
|
| [81] |
|
| [82] |
|
| [83] |
|
| [84] |
|
| [85] |
|
| [86] |
|
| [87] |
|
| [88] |
|
| [89] |
|
| [90] |
|
| [91] |
|
| [92] |
|
| [93] |
|
| [94] |
|
| [95] |
|
| [96] |
|
| [97] |
|
| [98] |
|
| [99] |
|
| [100] |
|
| [101] |
|
| [102] |
|
| [103] |
|
| [104] |
|
| [105] |
|
| [106] |
|
| [107] |
|
| [108] |
|
| [109] |
|
| [110] |
|
| [111] |
|
| [112] |
|
| [113] |
|
| [114] |
|
| [115] |
|
| [116] |
|
| [117] |
|
| [118] |
|
| [119] |
|
| [120] |
|
| [121] |
|
| [122] |
|
| [123] |
|
| [124] |
|
| [125] |
|
| [126] |
|
| [127] |
|
| [128] |
|
| [129] |
|
| [130] |
|
| [131] |
|
| [132] |
|
| [133] |
|
| [134] |
|
| [135] |
|
| [136] |
|
| [137] |
|
| [138] |
|
| [139] |
|
| [140] |
|
| [141] |
|
| [142] |
|
| [143] |
|
| [144] |
|
| [145] |
|
| [146] |
|
| [147] |
|
| [148] |
|
| [149] |
|
| [150] |
|
| [151] |
|
| [152] |
|
| [153] |
|
| [154] |
|
| [155] |
|
| [156] |
|
| [157] |
|
| [158] |
|
| [159] |
|
| [160] |
|
| [161] |
|
/
| 〈 |
|
〉 |