
Copper Catalytic System for CO2 Electrocatalytic Preparation of Ethylene
Received date: 2024-05-08
Revised date: 2024-11-05
Online published: 2025-02-10
Supported by
National Natural Science Foundation of China(52074320)
National Natural Science Foundation of China(52074320)
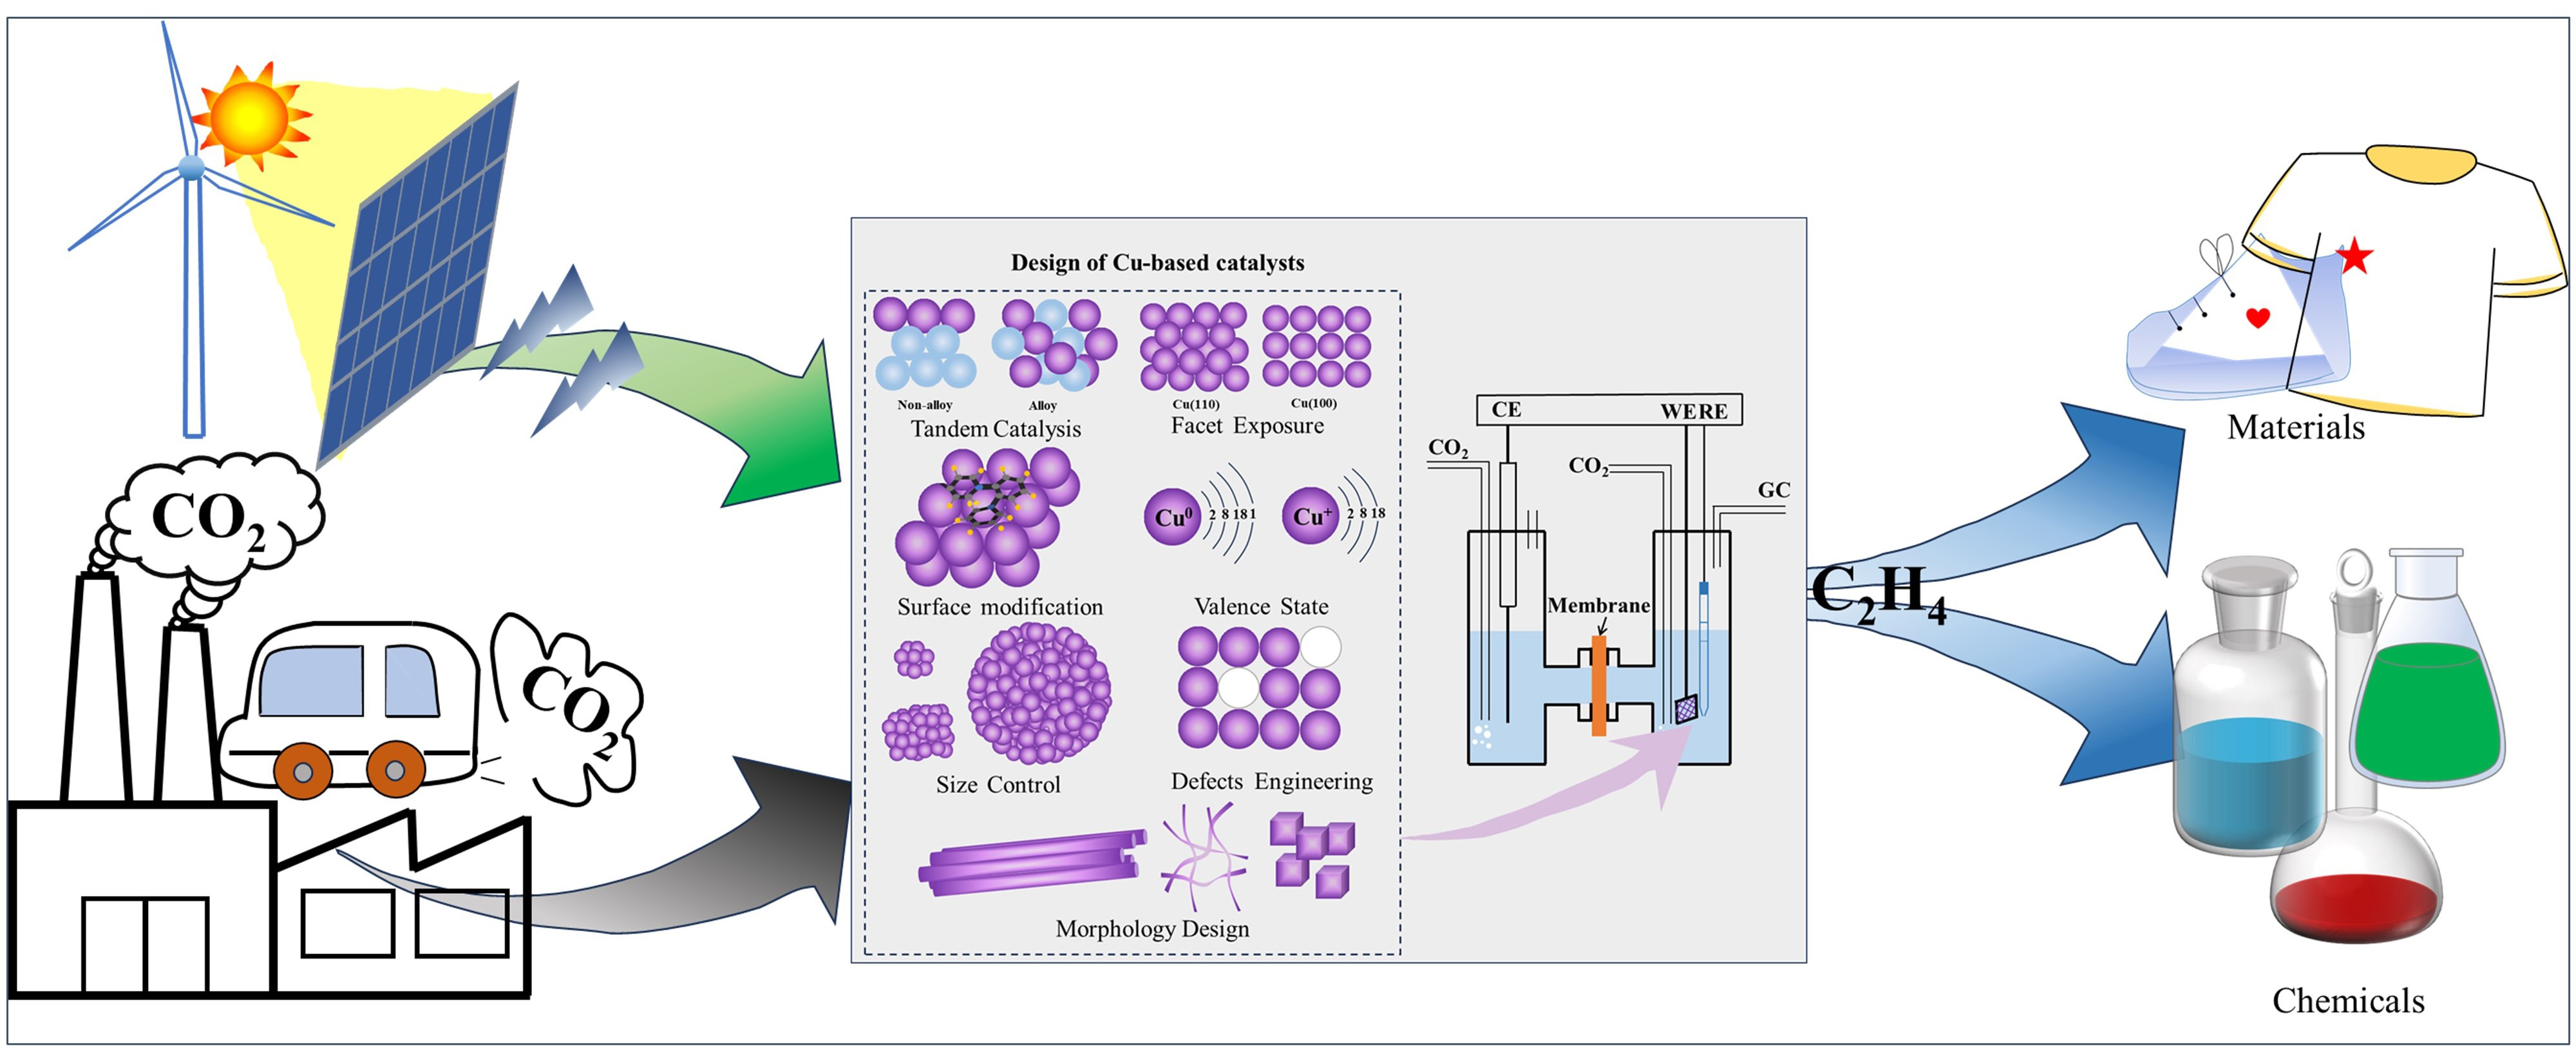
Taking into account environmental concerns and the ongoing shift towards clean energy, converting carbon dioxide (CO2) into ethylene (C2H4) through electrochemical CO2 reduction (ECO2RR) using renewable electricity is a sustainable and eco-friendly solution for achieving carbon neutrality while also providing economic benefits. Despite significant advancements in the field, issues such as low selectivity, activity and stability continue to persist. This paper presents a review of recent research progress in copper-based catalytic systems for ECO2RR in the production of ethylene. Firstly, the mechanism of ECO2RR is briefly summarized. It then highlights various catalyst design strategies for ethylene production, such as tandem catalysis, crystal surface modulation, surface modification, valence influence, size sizing, defect engineering, and morphology design. Finally, the paper discusses future challenges and prospects for the synthesis of ethylene through electrocatalytic CO2 reduction.
1 Introduction
2 CO2 electroreduction mechanisms on Cu catalysts
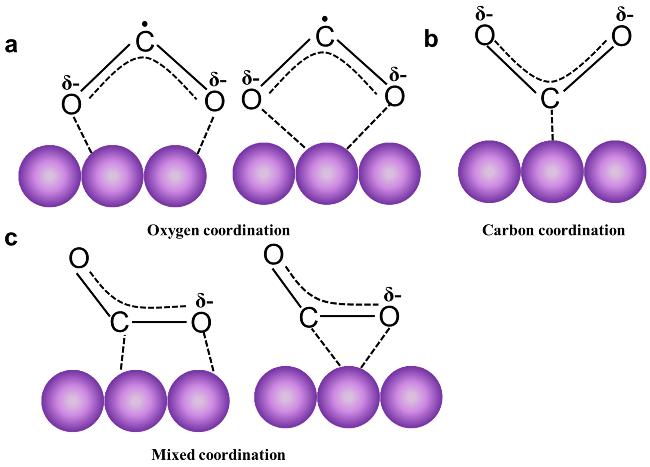
2.1 The adsorption and activation of CO2
2.2 The formation of *CO intermediates
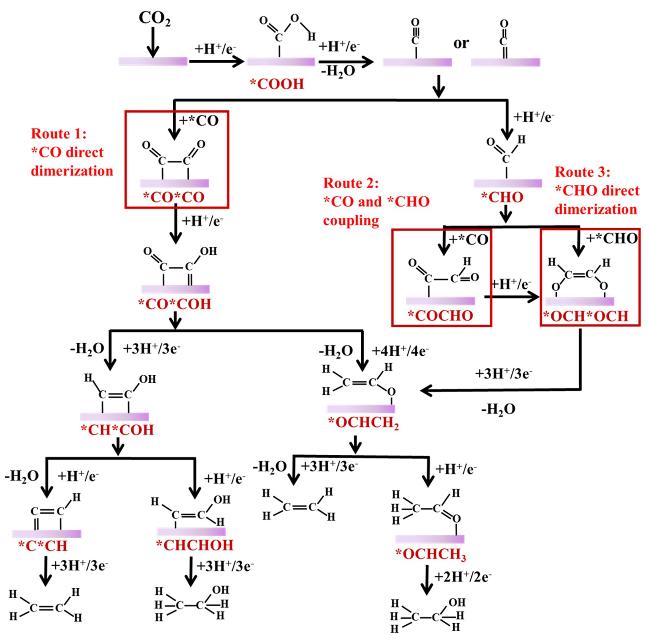
2.3 C-C coupling
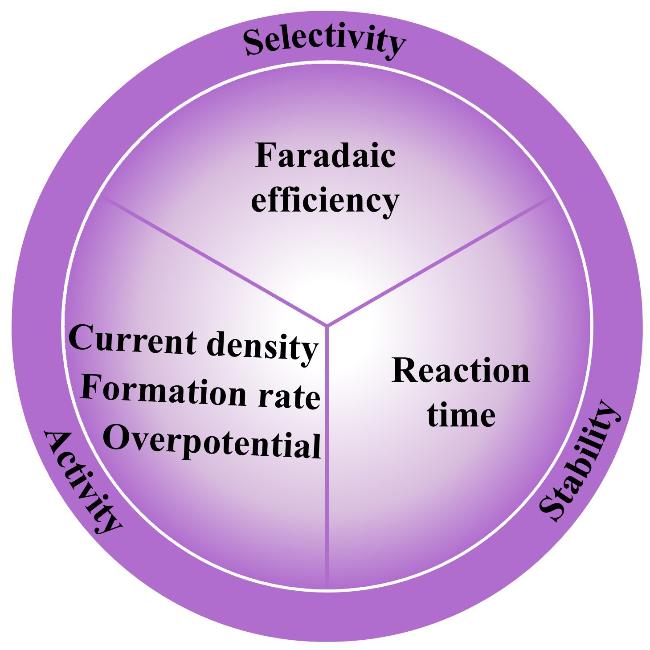
3 Key performance parameter
4 Catalyst design strategies
4.1 Tandem catalysis
4.2 Facet exposure
4.3 Surface modification
4.4 Valence state
4.5 Size control
4.6 Defects engineering
4.7 Morphology design
5 Conclusion and prospect
Key words: ECO2RR; ethylene; reaction mechanism; catalysts; design strategy
Yaqing Hu , Kunyu Xu , Haoling Yang , Fengfan Zhang , Zihao Yang , Zhaoxia Dong . Copper Catalytic System for CO2 Electrocatalytic Preparation of Ethylene[J]. Progress in Chemistry, 2025 , 37(3) : 332 -350 . DOI: 10.7536/PC240505
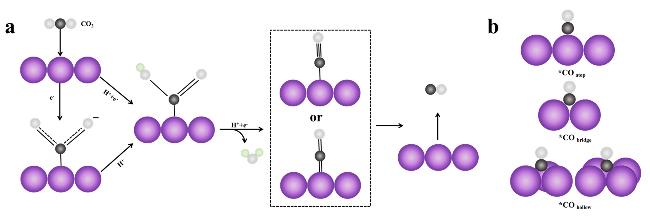
图2 (a) Possible Mechanistic Pathways for the Electrochemical Reduction of CO2 to CO; (b) Adsorption Configuration of *CO on Cu. The purple, black, white, and cyan balls represent Cu, C, O, and H atoms, respectively.Fig. 2 (a)Possible mechanistic pathways for the electrochemical reduction CO2 to CO;(b)*CO adsorption configurations on Cu. Purple, black, white, and cyan spheres indicate Cu, C, O and H atoms, respectively |
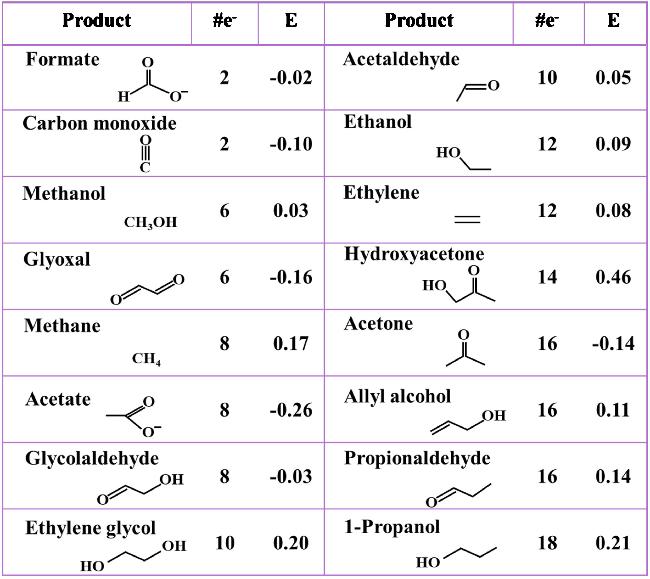
图5 At pH=6.8, the Products of CO2 Reduction Vary with the Number of Electrons Required for Each Product and Its Standard Reduction PotentialFig. 5 Products of CO2 reduction along with the number of electrons needed to produce each one and its standard reduction potential at pH = 6.8 |
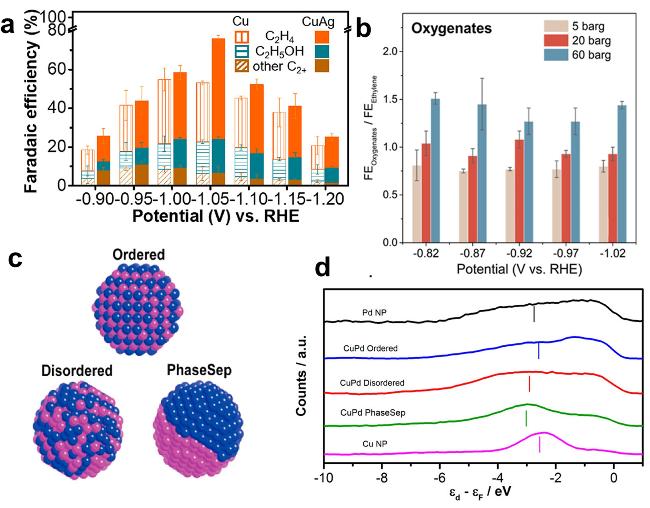
图7 (a) Products on CuAg Catalysts at Different Potentials with FE [93]; (b) Relationship Between FE oxygenates/FE ethylene and Pressure at Different Potentials[55]; (c) Bimetallic Cu - Pd Catalysts with Different Atomic Mixing Modes[103]; (d) Surface Valence Band Photoemission Spectra of Cu - Pd Nanoalloys[103]Fig. 7 (a) FE of products on CuAg catalysts at different potentials[93]. Copyright 2019, American Chemical Society; (b) Pressure-dependent of FE oxygenates/FE ethylene at different potentials[55]. Copyright 2022, American Chemical Society; (c) Cu-Pd bimetallic catalysts with different atomic mixing modes[103]. (d) Surface valence band photoemission spectra of CuPd nanoalloys relative to Fermi level[103]. Copyright 2016, American Chemical Society |
表1 ECO2RR制C2H4的串联催化剂汇总Table 1 Summary of tandem catalysts for C2H4 production by ECO2RR |
| Catalysis | Electrolyte | E (V vs RHE) | (%) | Durability (h) | Ref |
|---|---|---|---|---|---|
| CuAg | 0.1 M KHCO3 | -1.05 | 52 | 12 | 93 |
| Ag1-Cu1.1 | 0.1 M KHCO3 | -1.1 | 40 | 12 | 100 |
| AgCu | 0.1 M KHCO3 | -1.0 | 41.4 | - | 102 |
| CuAg | 1 M KOH | -0.68 | 55 | - | 91 |
| PTF(Ni)/Cu | 0.1 M KHCO3 and 0.1 M KCl | -1.1 | 57.3 | 11 | 94 |
| CuO/Ni | 1.0 M KOH | -0.892 | 54.1 | 3 | 74 |
| Cu/NiNC | 1 M KOH | -0.6 | 55 | - | 95 |
| Cu-Al | 1 M KOH | - | >80 | 50 | 96 |
| CuAl | 0.1 M KHCO3 | -0.99 | 79.4 | 100 | 97 |
| CuZn | 0.1 M KHCO3 | -1.1 | 33 | 15 | 98 |
| Cu/ZnO | 1 M KOH | -0.72 | 50 | 10 | 99 |
“-” Data not given |
表2 ECO2RR制C2H4的表面改性催化剂汇总Table 2 Summary of surface-modified catalysts for C2H4 production by ECO2RR |
| Surface Additives | Electrolyte | E (V vs RHE) | (%) | Durability (h) | Ref |
|---|---|---|---|---|---|
| N,N’-ethylene-phenanthrolinium dibromide | 0.1 M KHCO3 | -1.08 | 45 | 40 | 113 |
| N-tolylpyridinium chloride | 0.1 M KHCO3 | -1.1 | 40.8 | 10 | 112 |
| poly-N-(6-aminohexyl)acrylamide | 1 M KOH | -0.47 | 87 | 3 | 114 |
| 1-octadecanethiol | 0.1 M CsHCO3 | -1.4 | 56 | - | 118 |
| poly(vinylidene fluoride) | 0.5 M KHCO3 | -1.22 | 40.6 | 6 | 115 |
| polyaniline | 0.1 M KHCO3 | -1.1 | 40 | 20 | 116 |
| poly(acrylamide) | 0.1 M KCl | -0.96 | 26 | 1 | 117 |
| 1-butyl-3-methylimidazolium nitrate | 0.1 M KCl | -1.49 | 77.3 | 3 | 119 |
| -NH2-modified carbon dots | 0.5 M KHCO3 | -1.40 | 57 | - | 120 |
“-” Data not given |
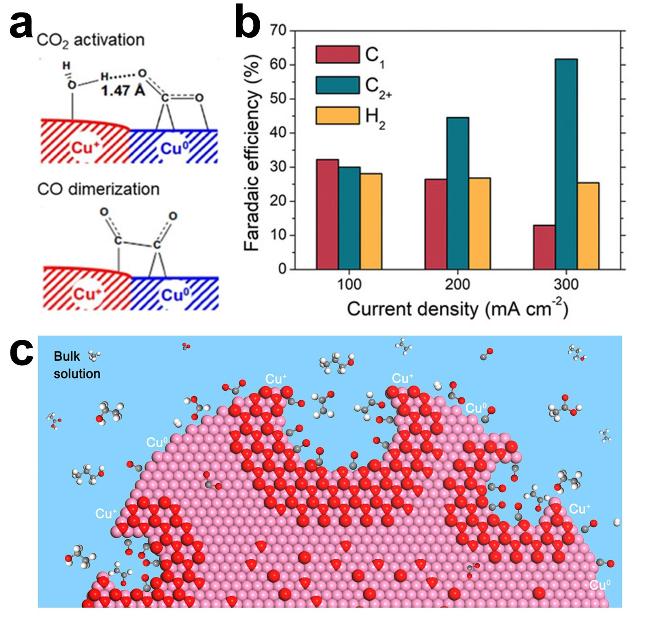
图8 (a) Synergistic Effects of Mixed Cu+ and Cu0 Sites for CO2 Activation and CO Dimerization Processes[130]; (b) Calculated FE for All C1, C2+ Products, and H2 at Different Current Densities After 2 Hours of Electrolysis[134]; (c) Schematic Diagram of Confined Carbon Intermediates in Nanocavities That Protect the Oxidation State of Copper During Carbon Dioxide Reduction Reaction[135]Fig. 8 (a) Proposed synergistic effects of mixed Cu+ and Cu0 sites for CO2 activation and CO dimerization processes[130]. Copyright 2021, Wiley; (b) FE of all C1, C2+ products and H2 at different current densities calculated after 2 h of electrolysis[134]. Copyright 2019, Wiley; (c) Schematic of carbon intermediates that are confined in the nanocavities, which locally protect copper oxidation state during ECO2RR. White: hydrogen; gray: carbon; red: oxygen; violet: copper[135]. Copyright 2020, American Chemical Society |
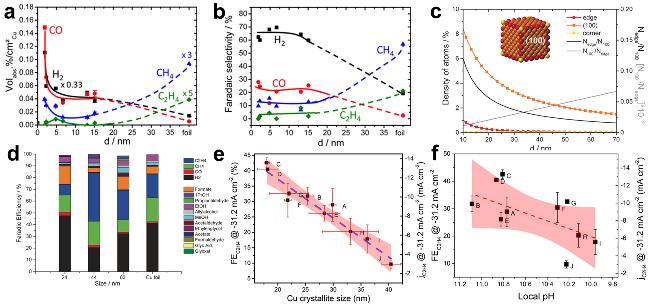
图9 At 25 ℃, -1.1 V (vs RHE), and electrolyte of 0.1 mol/L KHCO3, During ECO2 RR on Cu NPs: (a) Composition of Gaseous Reaction Products and (b) FE of Reaction Products [140]; (c) Relationship Between Adsorption Site Density and Edge Length in Cu Nanocubes and the Ratio of Edge Atoms to Face Atoms[141]; (d) FE of Different Sized Cu Nanocube Products at -1.1 V (vs RHE) [141]; (e) Correlation Chart of (and ) Values with the Size of Cu2O - Derived Cu Particles and (f) Local pH Value[142]Fig. 9 Particle size dependence of (a) the composition of gaseous reaction products during catalytic CO2 electroreduction over Cu NPs[140], (b) the FE of reaction products during the CO2 electroreduction on Cu NPs. Conditions: 0.1 M KHCO3, E = -1.1 V (vs. RHE), 25 °C[140]. Copyright 2014, American Chemical Society; (c) Density of adsorption sites in Cu NC cubes reported versus the edge length and the trend of Nedge/N100 and N100/Nedge [141]. (d) Bar graph reporting the FE for each product in the different size of Cu NC cubes and in the Cu foil at -1.1 V (vs RHE)[141]. Copyright 2016, Wiley; (e) A correlation plot between the (and ) values and the crystallite sizes of Cu2O-derived Cu particles[142]. (f) local pH[142]. Copyright 2016, American Chemical Society |
表3 ECO2RR制C2H4的缺陷工程催化剂汇总Table 3 Summary of defective engineered catalysts for C2H4 from ECO2RR |
| Catalysis | Electrolyte | E (V vs RHE) | (%) | Durability | Ref |
|---|---|---|---|---|---|
| n-CuNS | 0.1 M K2SO4 | -1.18 | 83.2 | 14 h | 32 |
| Cu2O NP | 0.1 M KHCO3 | -1.1 | 57.4 | 10 h | 144 |
| GB-Cu | 1 M KOH | -1.2 | 38 | - | 145 |
| Cu2O superparticle-CP3 | 0.1 M KHCO3 | -1.15 | 53.2 | 12 h | 146 |
| CuO-MC | 1 M KOH | -1.02 | 50.4 | - | 147 |
| CuOx-Vo | 0.1 M KHCO3 | -1.4 | 63 | 12 h | 148 |
| Cu2S-Cu-V | 0.1 M KHCO3 | -0.92 | 21.2 | 16 h | 149 |
| Cu2S-Cu | 0.1 M KHCO3 | -1.1 | 45 | 16 h | 149 |
| Cu3Nx | 1 M KOH | -1.15 | 56 | 1000 s | 150 |
| Cu(B) | 0.1 M KCl | -1.1 | 52 | 38 h | 151 |
| Cu(H) | 0.1 M KCl | -1 | 22 | 6 h | 151 |
| Cu(C) | 0.1 M KCl | -1 | 33 | 12 h | 151 |
| Cu-F | 0.75 M KOH | -0.89 | 65 | 40 h | 68 |
“-” Data not given |
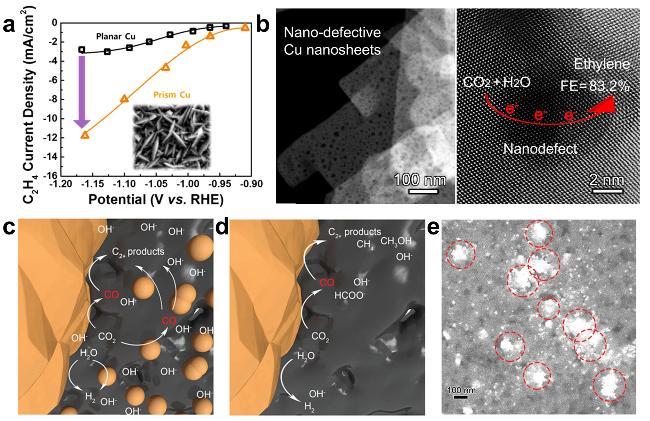
图10 (a) Current Density vs Potential for Prismatic Cu Electrode and Planar Cu Electrode [152]; (b) Schematic Diagram of C2H4Electroreduction Generation on Cu Nanosheets with Defects [32]; (c) Schematic Mechanism Comparison of C-C Coupling over Cu2O Superparticles-CP3and (d) Cu2O Cubes-CP3 [146]; (e) SEM Image of "Planet-Satellite"-Like Catalyst [146]Fig. 10 (a) Plot of C2H4 current density versus potential for prismatic Cu electrode and planar Cu electrode[152]. Copyright 2017, American Chemical Society; (b) Diagram of C2H4 generation by electroreduction of Cu nanosheets with defects[32]. Copyright 2020, American Chemical Society; Schematic illustration for the mechanism of enhanced C-C coupling of (c) Cu2O superparticle-CP3 compared to (d) Cu2O cube-CP3 [146]. (e) SEM image of the “planet-satellite” catalysts[146]. Copyright 2022, Wiley |
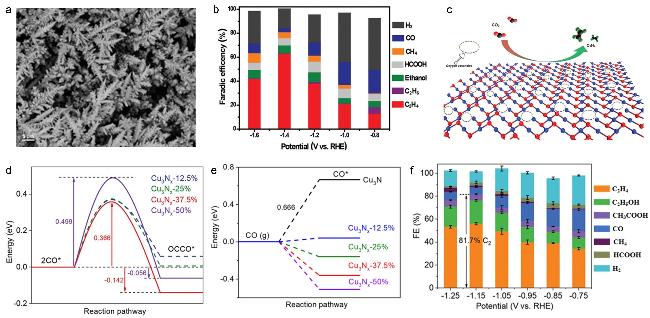
图11 (a) SEM Image of CuO Nanodendrites on Carbon Paper[148]; (b) FE of CuO x -Vo [148]; (c) Schematic Diagram of Electrochemical Reduction of CO2 to C2H4 on Oxygen Vacancy-Rich CuO x -Vo Surface[148]; (d) Corresponding Energy Diagram of CO-CO Coupling on Cu3Nx with Different Nitrogen Densities at 0 V (vs RHE)[150]; (e) *CO Adsorption Energy Diagram on the (100) Plane of Cu3N x with Different Nitrogen Densities at 0 V (vs RHE)[150]; (f) Product Distribution of CO2RR on Cu3N x-50-µA Catalyst at Different Potentials[150]Fig. 11 (a) SEM images of the CuO nanodendrites on carbon paper[148]; (b) FE of CuO x -Vo [148]; (c) Schematic of electrocatalytic reduction of CO2 on Vo-rich CuO x -Vo surface to C2H4 [148]. Copyright 2018, Wiley; (d) Corresponding energy diagrams of CO-CO coupling on the different nitrogen densities of Cu3N x at 0 V (vs RHE)[150]; (e) Energy diagrams of *CO adsorption energies on (100) facets of the different nitrogen densities of Cu3N x at 0 V (vs RHE)[150]; (f) CO2RR product distributions using Cu3N x -50-µA catalysts at various applied constant potentials[150]. Copyright 2021, Wiley |
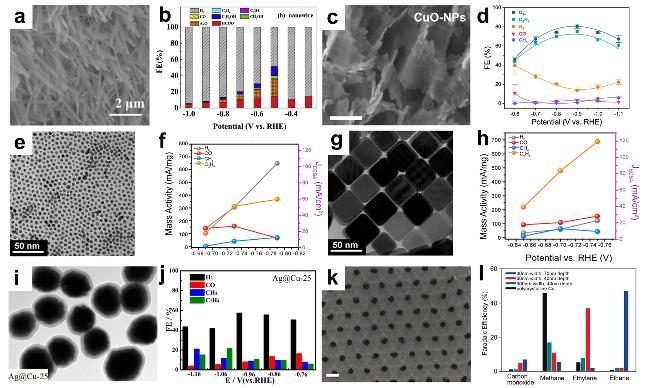
图12 (a) SEM Image of Copper Nanowires[165]; (b) FE of Various Products on Copper Nanowires at Different Potentials [165]; (c) TEM Image of Copper Nanosheets[73]; (d) FE of Various Products on Copper Nanosheets at Different Potentials [73]; (e) TEM Image of Copper Nanoparticles[107]; (f) Mass Activity (Left Axis) of Each Detected Gas Product and Partial Current Density Normalized by ECSA (Right Axis) as a Function of Potential for Copper Nanoparticles [107]; (g) TEM Image of Copper Nanocubes[107]; (h) Mass Activity (Left Axis) of Each Detected Gas Product and Partial Current Density Normalized by ECSA (Right Axis) as a Function of Potential for Copper Nanocubes [107]; (i) TEM Image of Silver@Copper Core-Shell Nanoparticles[163]; (j) FE of Various Products on Ag@Cu Core-Shell Nanoparticles at Different Potentials [163]; (k) SEM Image of Copper Nanopores[166]; (l) FE of Different Products on Copper Nanopores at -1.7 V (vs NHE) [166]Fig. 12 (a) SEM image of Cu nanowires[165]; (b) FE of various products on Cu nanowires at different potentials[165]; (c) TEM image of Cu nanosheets[73]. Copyright 2019, Elsevier; (d) FE of various products on Cu nanosheets at different potentials[73]. Copyright 2022, Springer Nature; (e) TEM images of the Cu nanoparticles[107]; (f) Mass activities (left axis) and partial current density normalized by the ECSA (right axis) for each of the detected gas products vs. potential for the Cu nanoparticles[107]; (g) TEM images of the Cu nanocubs[107]; (h) Mass activities (left axis) and partial current density normalized by the ECSA (right axis) for each of the detected gas products vs potential for the Cu nanocubs[107]. Copyright 2020, American Chemical Society; (i) TEM image of Ag@Cu core-shell nanoparticles[163]; (j) FE of various products on Ag@Cu core-shell nanoparticles at different potentials[163]. Copyright 2017, American Chemical Society; (k) SEM images of Cu nano-pore[166]; (l)FE of various products at -1.7 V (vs NHE) on Cu nano-pore[166]. Copyright 2016, Wiley |
| [1] |
|
| [2] |
|
| [3] |
|
| [4] |
|
| [5] |
|
| [6] |
|
| [7] |
|
| [8] |
|
| [9] |
|
| [10] |
|
| [11] |
|
| [12] |
|
| [13] |
|
| [14] |
|
| [15] |
|
| [16] |
|
| [17] |
|
| [18] |
|
| [19] |
|
| [20] |
|
| [21] |
|
| [22] |
|
| [23] |
|
| [24] |
|
| [25] |
|
| [26] |
|
| [27] |
|
| [28] |
|
| [29] |
|
| [30] |
|
| [31] |
|
| [32] |
|
| [33] |
|
| [34] |
|
| [35] |
|
| [36] |
|
| [37] |
|
| [38] |
(马一宁, 施润, 张铁锐. 化学学报, 2021, 79: 369.).
|
| [39] |
|
| [40] |
|
| [41] |
|
| [42] |
|
| [43] |
|
| [44] |
|
| [45] |
|
| [46] |
|
| [47] |
|
| [48] |
|
| [49] |
|
| [50] |
|
| [51] |
|
| [52] |
|
| [53] |
|
| [54] |
|
| [55] |
|
| [56] |
|
| [57] |
|
| [58] |
|
| [59] |
|
| [60] |
|
| [61] |
|
| [62] |
|
| [63] |
|
| [64] |
|
| [65] |
|
| [66] |
|
| [67] |
|
| [68] |
|
| [69] |
|
| [70] |
|
| [71] |
|
| [72] |
|
| [73] |
|
| [74] |
|
| [75] |
|
| [76] |
|
| [77] |
|
| [78] |
|
| [79] |
|
| [80] |
|
| [81] |
|
| [82] |
|
| [83] |
|
| [84] |
|
| [85] |
|
| [86] |
|
| [87] |
|
| [88] |
|
| [89] |
|
| [90] |
|
| [91] |
|
| [92] |
|
| [93] |
|
| [94] |
|
| [95] |
|
| [96] |
|
| [97] |
|
| [98] |
|
| [99] |
|
| [100] |
|
| [101] |
|
| [102] |
|
| [103] |
|
| [104] |
|
| [105] |
|
| [106] |
|
| [107] |
|
| [108] |
|
| [109] |
|
| [110] |
|
| [111] |
|
| [112] |
|
| [113] |
|
| [114] |
|
| [115] |
|
| [116] |
|
| [117] |
|
| [118] |
|
| [119] |
|
| [120] |
|
| [121] |
|
| [122] |
|
| [123] |
|
| [124] |
|
| [125] |
|
| [126] |
|
| [127] |
|
| [128] |
|
| [129] |
|
| [130] |
|
| [131] |
|
| [132] |
|
| [133] |
|
| [134] |
|
| [135] |
|
| [136] |
|
| [137] |
|
| [138] |
|
| [139] |
|
| [140] |
|
| [141] |
|
| [142] |
|
| [143] |
|
| [144] |
|
| [145] |
|
| [146] |
|
| [147] |
|
| [148] |
|
| [149] |
|
| [150] |
|
| [151] |
|
| [152] |
|
| [153] |
|
| [154] |
|
| [155] |
|
| [156] |
|
| [157] |
|
| [158] |
|
| [159] |
|
| [160] |
|
| [161] |
|
| [162] |
|
| [163] |
|
| [164] |
|
| [165] |
|
| [166] |
|
/
| 〈 |
|
〉 |