Home Journals Progress in Chemistry
Progress in Chemistry

Abbreviation (ISO4): Prog Chem      Editor in chief: Jincai ZHAO

About  /  Aim & scope  /  Editorial board  /  Indexed  /  Contact  / 
Review

Semiconductor Ammonia Sensor and Its Application in Human Expiratory Health Monitoring

  • Mingxia Feng 1 ,
  • Jintian Qian 1 ,
  • Dawu Lv 2 ,
  • Wenfeng Shen , 2, * ,
  • Weijie Song , 2, * ,
  • Ruiqin Tan , 1, *
Expand
  • 1 Faculty of Electrical Engineering and Computer Science,Ningbo University,Ningbo 315211,China
  • 2 Ningbo Institution of Materials Technology and Engineering,Chinese Academy of Sciences,Ningbo 315201,China
* (Wenfeng Shen);
(Weijie Song);
(Ruiqin Tan)

Received date: 2024-07-10

  Revised date: 2024-09-23

  Online published: 2025-04-30

Supported by

Ningbo Key Scientific and Technological Project(NBSTI 2023Z021)

Abstract

Human exhaled air has a close relationship with diseases,among which ammonia becomes a respiratory marker for diseases such as kidney disease. Traditional exhaled gas detection methods are mainly detected by gas chromatography,but the instrument is bulky and complex in operation. Emerging ammonia sensors,however,are garnering significant attention due to their portability,ease of integration,miniaturization,low cost,and simplicity of operation. This review systematically describes the working mechanism of ammonia gas sensors,sensor types,and common ammonia sensing materials. At the same time,it introduces the advantages of sensor array electronic nose technology over a single sensor,and puts forward the application research of ammonia sensors and electronic noses in diseases,aiming at the existing problems and prospects of ammonia gas sensors.

Contents

1 Introduction

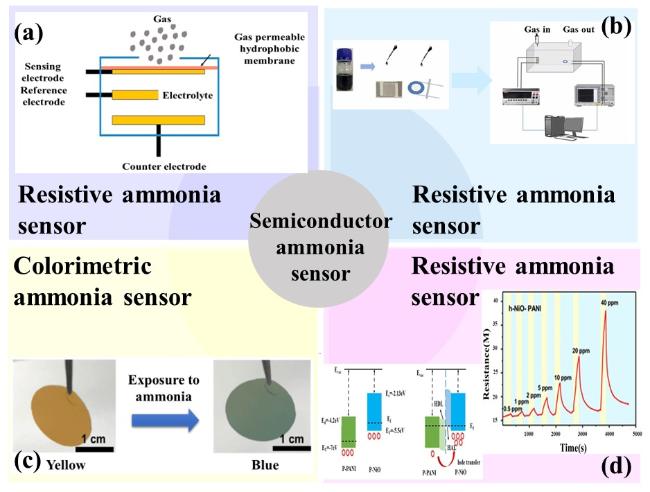
2 Principe of semiconductor ammonia sensor

2.1 Quartz crystal microbalance ammonia sensor

2.2 Electrochemical ammonia sensor

2.3 Colorimetric ammonia sensor

2.4 Resistive ammonia sensor

3 Resistive ammonia sensing gas sensitive material

3.1 Metallic oxide

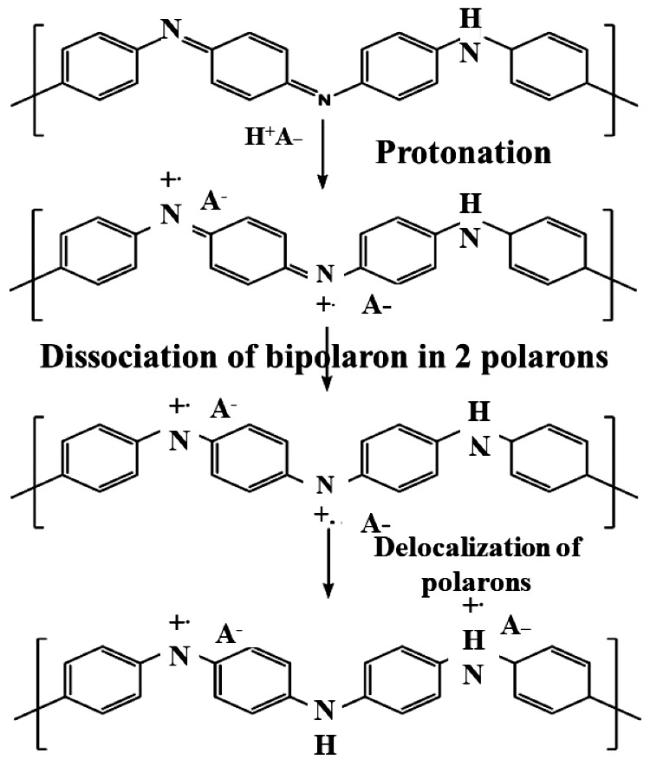
3.2 Conducting polymer

3.3 Carbon material

3.4 2D material

4 E-nose based on ammonia sensing

4.1 Eigenvalue extraction

4.2 Classical pattern recognition algorithm

4.3 Neural network

5 Applications of ammonia sensors in different diseases

5.1 Application of ammonia sensor in chronic kidney disease

5.2 Application of ammonia sensor in helicobacter pylori positive patients

6 Conclusion and outlook

Cite this article

Mingxia Feng , Jintian Qian , Dawu Lv , Wenfeng Shen , Weijie Song , Ruiqin Tan . Semiconductor Ammonia Sensor and Its Application in Human Expiratory Health Monitoring[J]. Progress in Chemistry, 2025 , 37(5) : 743 -757 . DOI: 10.7536/PC240704

1 Introduction

Traditional disease monitoring methods usually involve modern medical procedures such as blood analysis, computed tomography scans, and glucometers, which are somewhat invasive and costly. With advancements in nanotechnology and artificial intelligence, breath analysis has gained widespread popularity. Human exhaled breath primarily consists of nitrogen (78.04%), oxygen (16%), carbon dioxide (4-5%), hydrogen (5%), eight inert gases (0.9%), and water vapor. Additionally, it contains certain inorganic volatile organic compounds (VOCs), such as nitric oxide (10-50 ppb), nitrous oxide (1-20 ppb), ammonia (0.5-2 ppm), carbon monoxide (0-6 ppm), hydrogen sulfide (0-1.3 ppm), and organic VOCs like acetone (0.3-1 ppm), ethanol, isoprene (<= 105 ppb), ethane (0-10 ppb), methane (2-10 ppm), and pentane (0-10 ppb)[1]. In diabetic patients, insufficient insulin triggers fat metabolism for energy production and leads to increased acetone concentration via ketogenesis from fatty acids. Thus, acetone can serve as a breath biomarker for diabetes. The level of hydrogen sulfide in healthy individuals ranges between 8-16 ppb; however, patients with asthma, dental diseases, oral malodor, or airway inflammation exhale higher concentrations of H2S. Exhaled nitric oxide levels in healthy individuals remain below 25 ppb, while those suffering from lung conditions like asthma and chronic obstructive pulmonary disease (COPD) exhibit elevated concentrations. Therefore, fractional exhaled nitric oxide (FeNO) serves as a practical exhaled biomarker for diseases such as asthma in clinical practice. Ammonia concentrations in the exhaled breath of healthy individuals range from 425 to 1,800 ppb, with excess ammonia being eliminated from the body through the urea cycle in the kidneys and liver[1]. Elevated ammonia levels may indicate dysfunction in one or more organs[2]. Consequently, ammonia acts as a biomarker for diseases including renal failure, hepatic disorders, peptic ulcers, and halitosis. Abnormal levels of multiple components in exhaled breath correlate with specific diseases or endogenous metabolic processes.
Techniques such as gas chromatography-mass spectrometry (GC-MS), ion mobility spectrometry (IMS), and selected ion flow tube mass spectrometry (SIFT-MS) have been applied to breath analysis, among which technologies like GC-MS offer advantages of high specificity, high sensitivity, and low detection limits[3-4]. However, the instruments used for these techniques are bulky, expensive, and involve complex preparation processes. In contrast, breath biomarker detection using gas-sensitive sensors is more convenient and effective for large-scale disease monitoring, screening, and physical examinations, offering additional advantages such as non-invasiveness, simple sample collection, low cost, and improved humanization.
This review systematically introduces the working principles of semiconductor ammonia gas sensors, classification and preparation of ammonia-sensitive materials. It also summarizes the current research status and application studies of ammonia gas sensors in health monitoring. Furthermore, it elaborates on the corresponding sensor array design, electronic nose composition, and pattern recognition algorithms. Finally, it concludes and provides an outlook on the future research and application prospects of ammonia gas sensors.

2 Principle and Classification of Semiconductor Ammonia Sensors

In recent years, ammonia gas sensing has gradually gained popularity in breath disease applications. The working principle of semiconductor-based ammonia gas sensors involves charge transfer caused by chemical interactions at the gas-solid interface. Chemical gas molecules are recognized and measured on the solid surface of the material.[5] Gas molecules undergo chemical adsorption and reactions on the semiconductor surface, thereby generating a gas-sensing response[6-7], which enables the sensor to convert chemical signals into electrical signals. Based on the physical properties of semiconductor changes, semiconductor ammonia gas sensors are divided into two types: resistive and non-resistive. Non-resistive semiconductor ammonia gas sensors include electrochemical ammonia sensors, quartz crystal microbalance ammonia sensors, and colorimetric ammonia sensors.

2.1 Quartz Crystal Microbalance Ammonia Gas Sensing

The Quartz Crystal Microbalance (QCM) sensor is mainly realized by sandwiching a quartz crystal film between two conductive metal electrodes. Based on the piezoelectric effect, it oscillates at a specific natural frequency when voltage is applied. The adsorbed mass of the sensing membrane is detected through the shift in resonance frequency of the crystal oscillator.[8-11] The device's frequency changes according to the additional mass of the target analyte or molecules being adsorbed. The frequency change caused by gas molecules with additional mass can be described using the Sauerbrey equation.
Δ f = 2 f 0 2 A p q u q Δ m
among them, Δf, f0, Δm, A, μq and ρq are the resonance frequency shift, initial resonance frequency, mass change, electrode surface area, shear modulus and density of the quartz crystal, respectively. Here, this equation is valid only under the following conditions: (1) the frequency shift is much smaller than the initial frequency (Δff0); (2) the added mass is rigid; and (3) the deposited material mass is uniformly distributed over the crystal's active area.[12]
At present, researchers have developed QCM-based sensors capable of detecting trace amounts of NH3 in human breath. For example, Zhang et al.[13] fabricated a QCM ammonia sensor based on cellulose acetate nanofibers (CA) and polyaniline-modified nanocomposites (CA/PANI/ZnO) through electrospinning, oxidative polymerization, and solvothermal methods. The sensor measured electrical parameters and the quality factor via impedance spectroscopy and demonstrated excellent performance, including high sensitivity (4.54 Hz/ppm), by measuring resonance frequency shifts. In addition, Luo et al.[14] prepared a QCM-type ammonia sensor based on Ti3C2Tx-MXene using surface engineering and spin-coating techniques. As shown in Figure 1b, the mass change was calculated using the following formula: Δf = (-2.26×10⁻⁶f02/Am, where f0 is the fundamental frequency of the quartz crystal, Δf is the frequency shift, and A is the electrode surface area. This sensor exhibited excellent sensitivity (49 Hz@100 ppb), with a detection limit as low as 10 ppb. These studies indicate that QCM-based ammonia sensors hold significant potential for applications requiring high sensitivity and low detection limits, demonstrating promising capabilities for disease early-warning functions.
图1 四种半导体型氨气传感器的原理设计图:(a)电化学传感,(b)QCM传感,(c)比色传感,(d)半导体传感

Fig.1 Schematic of design mechanisms of four kinds of semiconductor ammonia sensors:(a)electrochemical sensing,(b)QCM sensing,(c)colorimetric sensing,(d)semiconductor gas sensing

2.2 Electrochemical Ammonia Sensing

A typical electrochemical gas sensor consists of a sensing electrode (or working electrode), a counter electrode, a reference electrode, an electrolyte, and a hydrophobic membrane with permeability (usually PTFE or Teflon)[15]. Electrochemical sensors are mainly divided into solid electrolyte sensors and liquid electrolyte sensors. Solid electrolyte-based sensors typically employ amperometric and potentiometric techniques, whereas liquid electrolyte sensors commonly use voltammetric and potentiostatic current titration methods[16]. The sensing mechanism of a potentiometric NH3 sensor, as shown in Fig. 1a, involves the formation of a potential difference between the sensing electrode and the counter electrode when NH3 diffuses through the permeable membrane into the electrolyte solution, accompanied by an electrochemical reaction between the electrolyte and NH3 molecules at the sensing electrode[17-19].
As a result of the electrochemical reaction, ammonia oxidation at the sensing electrode produces N2, H+, and six electrons, while the hydrogen ions generated at the sensing electrode react with oxygen to form water at the counter electrode, as follows.
2NH3→N2+6H++6е-
O2+4H++4е-→2H2O

2.3 Colorimetric Ammonia Gas Sensing

Colorimetric sensors are widely applied in gas sensing due to their advantages of low power consumption, portability, high accuracy, fast detection speed, ease of visual inspection, and simple sensor operation[20]. Colorimetric sensors are generally categorized into several types, including those based on graphene and its derivatives, metal and metal oxide nanoparticles, DNA nanomaterials, and quantum dots[21], and they also feature different structural designs. For example, the colorimetric sensor fabricated by Lee et al.[22] consists of three layers: a top layer, an intermediate layer, and a bottom layer made of polymer elastomer. The bromocresol green (BCG) indicator embedded in the middle layer changes color from yellow-orange to blue when exposed to ammonia gas. Colorimetric sensors mainly achieve gas detection through chemical reactions between certain nanomaterials and gases, resulting in visible color changes in the materials, as illustrated in Fig. 1c. These sensors offer visible signals and provide the most intuitive information via color change, making them excellent candidates for applications in healthcare and related fields.

2.4 Resistive Ammonia Gas Sensors

Chemical resistive ammonia sensors currently play an important role in health monitoring and industrial applications. The working principle of resistive ammonia sensors involves a chemical reaction (reduction and oxidation) between ammonia gas and ammonia-sensitive materials, leading to changes in sensor resistance. Specifically, the sensing mechanism of resistive ammonia sensors is as follows: when ammonia gas (NH3) comes into contact with the surface of metal oxide sensing materials, ammonia molecules interact with ions on the material surface, reducing surface oxygen vacancies and causing changes in carrier concentration, thereby altering the material's resistance[23]. When combined with conductive polymer materials, ammonia molecules interact with the π-electron clouds of the polymer, leading to electron migration and changes in the polymer chain structure, thus causing resistance variations.
The important performance parameters of resistive ammonia sensors include response value and response-recovery time, usually expressed as Ra/Rg or (Rg-Ra)/Ra×100%, where Ra represents the resistance in air, and Rg refers to the resistance when exposed to ammonia[24]. The response time is defined as the time required for the sensor's resistance to reach 90% of its maximum Rg when exposed to an ammonia environment, while the recovery time is the time needed for Rx to reach 10% of the maximum Rg. These performance indicators are crucial for evaluating the sensitivity and practicality of sensors. Feng et al.[25] improved the response by constructing a p-p heterojunction at the interface between the p-type semiconductor NiO and the p-type semiconductor PANI, as shown in Figure 1d. When NH3, acting as an electron donor, is absorbed by the sensor, the number of holes decreases and the resistance increases. During desorption, the holes return and the resistance decreases, consistent with the Figure 1d (R-t) curve. The sensor's response value increases with increasing ammonia concentration, with a lowest detection limit of 0.5 ppm, indicating its potential application in disease and health monitoring.
At present, carbon nanomaterials, 2D materials, metal oxide semiconductors (MOS), and conductive polymers have been reported as materials for manufacturing semiconductor resistive sensors. Their gas-sensing properties can be optimized through material composites and modifications, as well as by regulating structural and morphological features. Table 1 presents a performance analysis of gas-sensing materials for ammonia sensors in recent years, which is discussed in detail in Section 3 of this paper.
表1 近年来气敏材料对氨气传感器的性能分析

Table 1 Recently years performance analysis of ammonia sensor with different gas sensing materials

Sensitive material Operating temperature Ammonia
concentration
Responsivity Response time LOD(limit of detection) Preparation method Ref
PANI-Ge room temperature 50 ppm 1098.6% 72 s - In situ polymerization 51
PANI-Rh-SnO2 room temperature 100 ppm 13.6 113 s 0.5 ppm Electrospinning,in situ polymerization 52
PANI-NiO room temperature 10 ppm 43% 149 s 0.5 ppm In situ polymerization 25
BaFe12O19 306 ℃ 1 ppm 230% 2.88 s 0.2 ppm Solid-state reaction method 53
PANI-MoS2-Pt room temperature 50 ppm 16 13 s 250 ppb Hydrothermal in situ polymerization 39
PP/G/PANI room temperature 50 ppm 250% 114 s 100 ppb Dip coating,in situ polymerization 54
PANI/HNTs room temperature 50 ppm 257.41% 10 ppb In situ polymerization 55
PEDOT:PSS/MXene room temperature 100 ppm 36.6% 116 s 10 ppm In situ polymerization 56
MXene-Ti3C2Tx room temperature 80 ppm 214.7% 122 s 20 ppm Molecular self-assembly/oxidative polymerization 50
CeO2@PANI room temperature 100 ppm 670% 300 s 50 ppb In situ polymerization 57
SnO2-PANI room temperature 100 ppm 29.8 125 s 10 ppb Hydrothermal method,in situ polymerization 58
WO3-PANI room temperature 100 ppm 121% 32 s - In situ polymerization 59
NiO-PANI room temperature 10 ppm 43% 149 s - In situ polymerization 25
ZnO@CNT room temperature 5 ppm 12.3% 5 s - Electrospinning,carbonization method 60
p-PP/CNT/PANI room temperature 70 ppm 452% 93 s 500 ppb In situ polymerization 61
CuBr/CeO2 room temperature 5 ppm 68 210 s 20 ppb Electron beam evaporation 62
PANI@SnO2 room temperature 100 ppm 15.3 - - Electrospinning,In situ polymerization 63
PANI/(Cu-en) room temperature 100 ppm 3.8 100 s 2 ppm Oxidative polymerization 64

3 Resistive Ammonia Gas Sensing Materials

3.1 Metal Oxides

Metal oxide-based gas sensors have been extensively studied since the last century. Due to their advantages such as simplicity, low cost, fabrication flexibility, and good process compatibility, metal oxide sensors have attracted significant attention in the field of gas sensing, especially for metal oxides like SnO2, ZnO, WO3, TiO2, and MoO3, which are widely used in NH3 detection. However, these sensors suffer from drawbacks such as high operating temperature (> 300 °C) and poor selectivity. Therefore, modifying metal oxides to develop ammonia sensors with high response, high selectivity, low cost, and capability of detection at room temperature is particularly important. Gas sensors based on metal oxide semiconductors (such as n-type SnO2) typically detect gases by measuring resistance changes, which result from charge transfer caused by chemical interactions at the gas-solid interface[26].
As gas sensing materials, metal oxides are divided into n-type and p-type semiconductor metal oxides, exhibiting excellent electrical properties within a temperature range of 250~550 degrees Celsius. Zinc oxide (ZnO) is an n-type semiconductor material that possesses characteristics such as a wide bandgap (3.3 eV), high exciton binding energy (60 meV), high electron mobility, excellent thermal stability, and non-toxicity under room temperature conditions[27]. For example, Mote et al.[28] synthesized aluminum (Al)-doped zinc oxide (ZnO) thin films using chemical spray pyrolysis technology; Al was incorporated into the ZnO lattice, causing changes in the unit cell volume and bond length, as shown in Figure 2a. This also altered the ZnO bandgap, thereby enhancing ammonia response performance; Figure 2b illustrates the resistance variation in an ammonia atmosphere. Zhang et al.[29] fabricated MoS2/ZnO composite thin films on PCB substrates using layer-by-layer self-assembly technology; Figure 2c shows the successful integration of MoS2 and ZnO. Figure 2d demonstrates the different sensing performances of the MoS2/ZnO thin film sensor in an ammonia atmosphere with concentrations ranging from 0.25 to 100 ppm at room temperature, where resistance decreases as gas concentration increases, achieving a minimum detection limit of 0.25 ppm. The above studies indicate that ZnO, as an ammonia-sensitive material, holds promise for detecting ammonia in exhaled breath from patients with gastrointestinal or kidney diseases in the future.
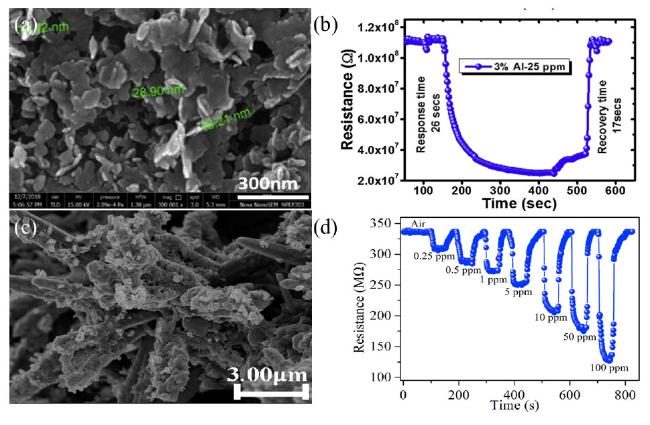
图2 (a)3% Al掺杂ZnO薄膜的FESEM图像,(b)3% Al掺杂 ZnO 传感器对 NH3 的瞬态响应[28],(c)MoS2/ZnO 纳米颗粒的FESEM图像,(d)MoS2/ZnO薄膜传感器在室温下对0.25~100 ppm氨气的电阻变化值[29]

Fig.2 (a)FESEM image of 3% Al-doped ZnO thin film,(b)transient response of 3% Al-doped ZnO sensor to NH3[28],(c)FESEM image of MoS2/ZnO nanoparticles,(d)resistance change values of MoS2/ZnO thin film sensor at room temperature for ammonia concentrations ranging from 0.25 to 100 ppm[29]

Similarly, SnO2 also has the advantages of high carrier mobility and photoconductivity. The lattice structure of tin oxide is similar to that of other metal oxides such as zinc oxide, which makes it easy to form heterojunctions during crystal growth. Tin oxide exhibits strong reactivity and readily undergoes chemical reactions with other substances to form solid solutions or compounds. During the preparation of heterojunctions, by adjusting reaction conditions (such as temperature, pressure, composition, etc.), control over the structure, composition, and properties of the heterojunction can be achieved, thereby influencing the interaction between the material and gas molecules and improving sensing performance. AlFaify et al.[30] prepared Sb-doped SnO2 films using spray pyrolysis technology. The Sb doping increased the specific surface area of the sensing material, thus enhancing the response to ammonia, as shown in Fig. 3a, b. Guo et al.[31] fabricated a nanoscale ammonia sensor based on hydrothermally synthesized tin dioxide/tungsten selenide (SnO2/WSe2). The SnO2 nanorods were deposited onto WSe2 hexagonal nanosheets, forming a special p-n heterojunction structure, thereby enhancing the response to ammonia, as shown in Fig. 3c. Compared with pure SnO2, SnO2/WSe2 exhibited better responsiveness, with a detection limit as low as 0.1 ppm, as shown in Fig. 3d, showing promising potential for disease detection.
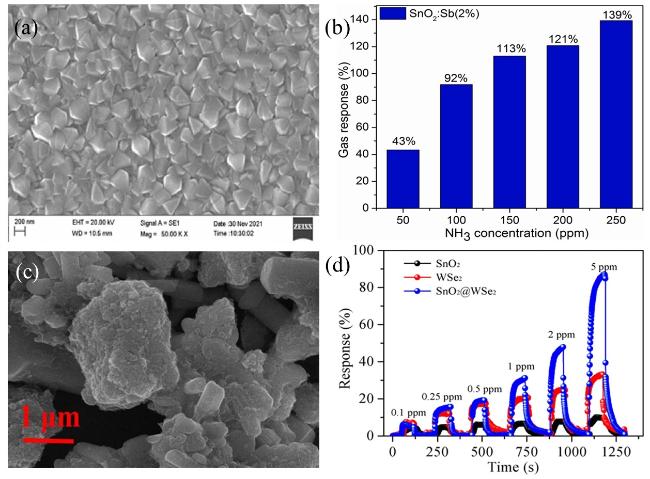
图3 (a)Sb掺杂SnO2的SEM图像,(b)SnO2/Sb传感器对不同氨气浓度的气体响应[30],(c)SnO2/WSe2 NPs的SEM图,(d)SnO2 /WSe2、WSe2和 SnO2薄膜传感器对不同浓度气体的响应[31]

Fig.3 (a)SEM image of Sb-doped SnO2,(b)Gas response of SnO2/Sb sensor to different ammonia concentrations[30],(c)SEM image of SnO2/WSe2 NPs,(d)Gas response of SnO2/WSe2,WSe2 and SnO2 film sensors to different gas concentrations [31]

3.2 Conductive Polymers

Conductive polymers such as polyaniline (PANI), polypyrrole (PPY), and poly(3,4-ethylenedioxythiophene) (PEDOT) have attracted widespread interest in the development of gas sensors due to their excellent conductivity, simple synthesis process, and inherent compatibility with polymer substrates.[32] Regarding ammonia sensing, polyaniline (PANI) is widely applied due to its good selectivity. PANI contains transformable chain segments and protonated amino groups, thereby exhibiting excellent signal transduction/amplification and immobilization capabilities.[33-34] As a typical conductive polymer, PANI possesses a π-conjugated main chain where π-electrons move along the entire polymer chain, and alternating single and double bonds generate an sp2 hybrid structure, resulting in unique electrical properties.[35-36] Furthermore, a proton-dominated reversible doping/undoping conduction mechanism endows PANI with tunable conductivity and multifunctionality, enabling reactions with various target-sensitive chemical substances.[34,37] During the chemical oxidative polymerization process, doping is typically achieved due to the synthesis of PANI in acidic media. In acidic media, the charge transfer from anions to PANI is triggered, thereby altering the electrical properties of the polymer and transforming insulating PANI-EB into conductive PANI-ES. As shown in Figure 4, doping PANI with protonic acid leads to the insertion of quasiparticles (polarons) into the PANI backbone. With further doping, the presence of polarons in the PANI backbone increases, favoring the formation of energetically favorable bipolarons.[38]
图4 质子酸掺杂PANI-EB以形成导电PANI-ES[38]

Fig.4 Doping of PANI-EB with protons to form conducting PANI-ES [38]

Current research often focuses on modifying polyaniline to enhance sensor performance. For example, Wang et al.[39] successfully prepared Pt/MoS2/PANI nanocomposites using a hydrothermal method combined with in situ polymerization, modifying the surface with Pt particles. As shown in Figure 5b, compared with pure polyaniline in Figure 5a, the sensing material exhibited a larger contact area with ammonia gas. This sensor demonstrated high response and a low detection limit (250 ppb) for NH3 at room temperature (RT). In another study, Xu et al.[40] fabricated a PANI/MoO3/Cu ternary nanohybrid sensor using a solution-heating method and spin coating, forming a structure where polyaniline coated MoO3 loaded with Cu, as illustrated in Figure 5c. The formation of a p-n heterojunction between PANI and MoO3 increased band bending and Schottky barrier height, thus altering the electrical conductivity, as shown in Figure 5e. Compared with pure polyaniline, this sensor exhibited improved sensitivity and a lower detection limit, reaching 200 ppb, as depicted in Figure 5d. These studies indicate that such sensors can be applied in breath analysis and diagnosis of kidney diseases.
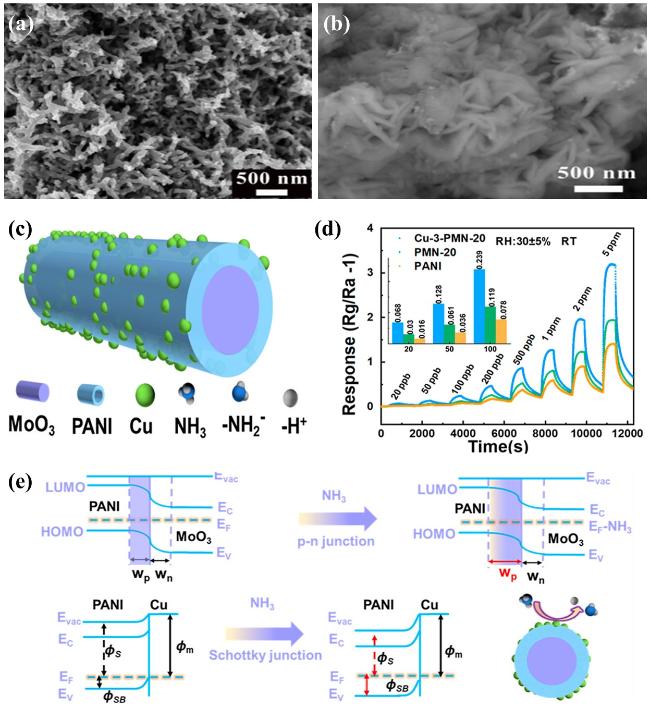
图5 (a)PANI的SEM图像,(b)Pt/MoS2/PANI复合材料的 SEM图像[39],(c)Cu纳米颗粒负载PANI/MoO3结构示意图,(d)纯 PANI、PMN-20 和 Cu-3-PMN-20 传感器件对10~5000 ppb NH3 的响应曲线,(e)PANI/MoO3内部p-n结和肖特基结的气敏增强效应能带图[40]

Fig.5 (a)SEM image of PANI,(b)SEM image of Pt/MoS2/PANI composite material [39],(c)Schematic diagram of Cu nanoparticles loaded on PANI/MoO3 structure,(d)Response curves of pure PANI,PMN-20,and Cu-3-PMN-20 sensor devices to 10~5000 ppb NH3,(e)Energy band diagram of gas sensing enhancement effect of internal p-n junction and Schottky junction in PANI/MoO3[40]

3.3 Carbon Materials

Carbon materials exhibit excellent performance in ammonia gas sensors, primarily due to their nanoscale dimensions and high specific surface area, which facilitate gas molecule adsorption and reaction. Additionally, the high electrical conductivity and thermal stability of carbon materials contribute to the sensor's rapid response and stability. Commonly used carbon materials for ammonia sensors include graphene, carbon nanotubes, and carbon nanofibers, which can be employed individually or combined with other materials to enhance sensing performance. The working principle of ammonia sensors involves the adsorption of ammonia molecules onto the surface of carbon materials, leading to a change in resistance. Although carbon materials perform well in practical applications, further research is required to optimize their performance and reduce costs.
Ali et al.[41] developed an ammonia sensor using carbon nanotubes decorated with pure indium (In) metal nanoparticles prepared by radio frequency sputtering. As shown in Fig. 6a and 6b, FESEM micrographs of pristine carbon nanotubes and indium-decorated carbon nanotubes reveal a high density of interconnected nanoparticles and their relatively uniform distribution on the surface of the carbon nanotubes. The combination of indium nanoparticles (NP) with CNTs addresses issues related to NP stability, separation, and recyclability, while preventing aggregation. Furthermore, Fig. 6c and 6d demonstrate that the response value of indium-decorated carbon nanotubes is superior to that of pristine carbon nanotubes, with a shortened response time. Building upon the extensive use of traditional carbon materials, studies have also explored the application of various biochars in ammonia sensors. For instance, inspired by the internal tubular structure of a dog's nose and its olfactory receptors, Duan et al.[42] fabricated a biochar/SnO2-based ammonia sensor using nanoparticles of a composite material composed of waste disposable bamboo chopsticks (DBC) and tin dioxide (SnO2). Fig. 6e presents the FESEM micrograph of the optimized biochar/SnO2 composite material showing enhanced response properties, while Fig. 6f indicates that under 500 ppm NH3, the response reached 4513, which is 107 times higher than that of pure biochar, with a theoretical detection limit as low as 34 ppb NH3. The low detection limit and high sensitivity suggest significant potential for future applications in health-related breath analysis.
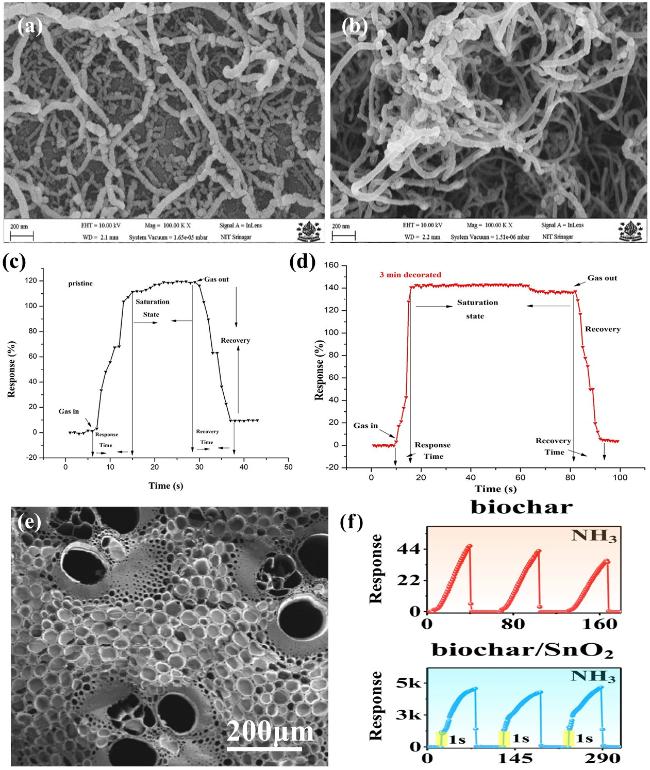
图6 (a)原始和(b)装饰3 min的铟纳米颗粒的FESEM显微照片,(c)、(d)显示100 ppm NH3环境下的传感器响应曲线[41],图(e)为生物炭/SnO2的纵向FESEM显微照片,图(f)为生物炭和生物炭/SnO2对500 ppm NH3的响应曲线[42]

Fig. 6 (a)FESEM images of pristine and(b)3 minutes decorated indium nanoparticles,(c),(d)sensor response curves in 100 ppm NH3[41],(e)longitudinal FESEM image of biochar/SnO2 and(f)response curves of biochar and biochar/SnO2 to 500 ppm NH3[42]

3.4 2D Materials

In recent years, research hotspots have indicated the widespread application of 2D nanomaterials in gas sensors, including graphene and its derivatives, 2D metal oxides (MOC), transition metal dichalcogenides (TMD), black phosphorus (BP), boron nitride (BN), graphitic carbon nitride (g-C3N), and MXene. These materials offer advantages such as excellent electronic and chemical stability, high specific surface area-to-volume ratio, good adsorption capacity, and surface activity[43-48].
As a novel two-dimensional material, MXene exhibits excellent electrical conductivity, low density, and abundant layered structure. Due to the large interlayer spacing, other nanomaterials can easily enter and form nanocomposites. The termination groups (O, OH, F) on MXene impart hydrophilicity, facilitating the formation of stable colloidal solutions and enabling processing into various structures. Moreover, these functional groups effectively serve as active sites for metal cation and gas adsorption[49]. Therefore, MXene is suitable as a sensing material for fabricating highly sensitive gas sensors.
He et al.[49] prepared NiO nanoparticle (NP)-modified two-dimensional (2D) Ti3C2Tx-MXene nanocomposite materials using a self-assembly method. The addition of NiO nanoparticles significantly improved the NH3 gas sensing response performance. It exhibited a high sensitivity of 6.13% towards 50 ppm NH3, which is 8.7 times higher than that of the pure Ti3C2Tx MXene sensor, indicating good selectivity and application prospects for this sensor.
Hsu et al.[50] introduced triethoxysilane propyl succinic anhydride silane (TESPSA) onto MXene-Ti3C2Tx to form carboxylic acid-terminated M-Xene (COOH-Ti3C2Tx), which was subsequently modified by alternate coating with polyaniline (COOH-Ti3C2Tx/PANI). As shown in Figure 7a, the SEM image of the CC-COOH-Ti3C2Tx/PANI sensing material reveals a loosely stacked Ti3C2Tx structure with broader spatial distribution, effectively increasing the contact area with ammonia; the increased number of binding sites enhances the binding strength between the Ti3C2Tx surface and NH3 gas molecules, as illustrated in Figure 7c. The 5CC-COOH-Ti3C2Tx/PANI sensor prepared through five coating cycles exhibits high sensitivity (214.70%) and rapid gas response rate at 80 ppm NH3, as shown in Figure 7b.
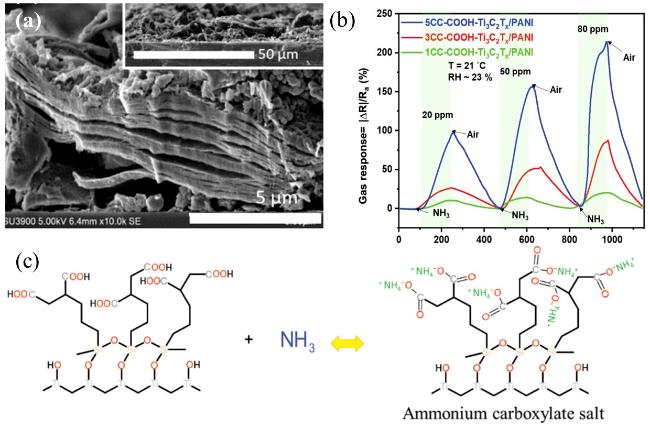
图7 (a)5CC-COOH-Ti3C2Tx/PANI传感材料的SEM图像,(b)5CC-COOH-Ti3C2Tx/PANI 传感器在T=21 ℃,RH=55%环境下对不同浓度氨气的响应(c)5CC-COOH-Ti3C2Tx/PANI对于NH3的传感机理[50]

Fig.7 (a)SEM image of 5CC-COOH-Ti3C2Tx/PANI sensing material,(b)Response of 5CC-COOH-Ti3C2Tx/PANI sensor to different ammonia concentrations under T=21 ℃,RH=55% environment,(c)Sensing mechanism of 5CC-COOH-Ti3C2Tx/PANI for NH3[50]

4 Electronic Nose Technology Based on Ammonia Sensing

A single ammonia sensor is prone to problems such as malfunctions and drift, making it incapable of analyzing human exhaled mixed gases. Therefore, an array composed of individual sensors is used to identify exhaled mixed gases. Combining the array with pattern algorithms forms an electronic nose (E-nose), which is widely applied in industrial and medical fields[65]. The E-nose analytical method offers significant advantages including high sensitivity, fast response speed, real-time monitoring, convenient usage, and portability. As shown in Figure 8, the electronic nose mainly consists of three components: gas sensors, hardware modules, and pattern recognition. The sensor array combines several different gas sensors with micro/nano fabrication techniques (MEMS), where each sensor within the array responds differently to various odors. The circuitry converts the sensor signals into electrical signals, which are then integrated into the electronic nose. Gas identification circuits subsequently process these electrical signals using various recognition algorithms to obtain the final identification results. Persaud and Dodd proposed an electronic nose primarily composed of a cross-sensitive sensor array and pattern recognition algorithms for qualitative identification of gas molecules based on their response characteristics[66].
图8 电子鼻的组成[67]

Fig.8 The composition of the electronic nose[67]

4.1 Eigenvalue Extraction

Feature extraction is the first step in sensor signal processing and feature selection, playing a crucial role in the effectiveness of subsequent feature selection and pattern recognition algorithms. Its purpose is to extract robust information from sensor responses, representing different "fingerprint" patterns with minimal redundancy, thereby ensuring the effectiveness of pattern recognition algorithms.[68]
At present, there are various feature extraction methods, such as extracting the original response curve, response time, recovery time, curve fitting parameters, and transform domains[68]. For example, Tan et al.[69] extracted five different features based on the sensor array response, including steady-state value (SS), resistance variation (VR), area under the curve (AUC), curve fitting parameters (FIT), and exponentially moving average (EMA), as shown in Fig. 9a~d. SS represents the stable resistance value of the sensor after reacting with the gas[70]. VR is defined as Ra/Rg, where Ra and Rg refer to the resistance values in air and target gas, respectively. AUC refers to the area between the response curve and the x-axis[71]. FIT calculates the fitting parameters a, b, and c through curve fitting, as illustrated in Fig. 9c[72]. The fitting equation is as follows.
Y=a*xb+c
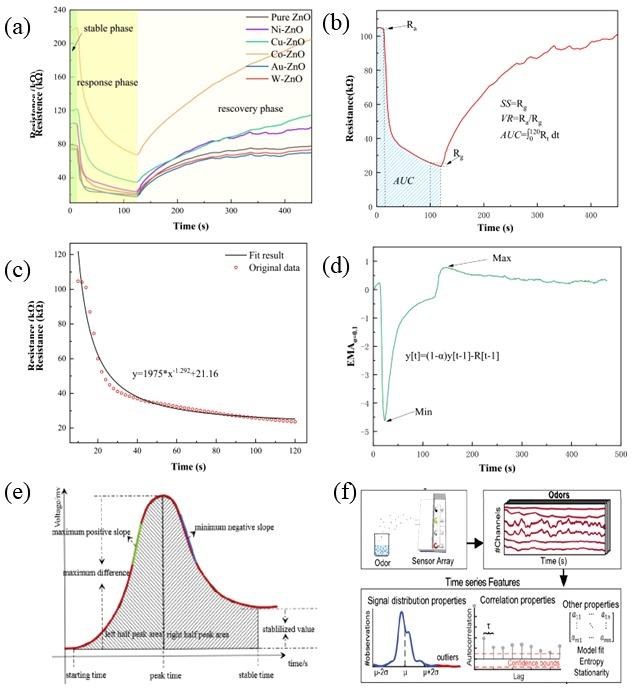
图9 不同特征提取方法示意图:(a)气体响应相位划分,(b)SS[70]、VR和AUC[71],(c)FIT[72],(d)EMA,(e)10个传统的时间序列特征[74],(f)高度可比的时间序列分析框架工具包,将单个实验的时间序列转换为7642个统计特征的数组[75]

Fig.9 Illustrates various feature extraction methods:(a)gas response phase partitioning,(b)SS[70],VR,and AUC[71],(c)FIT[72],(d)EMA,(e)ten traditional time series features[74],and(f)a highly comparable time series analysis framework toolkit that converts the time series of a single experiment into an array of 7642 statistical features[75]

EMA is used to gain insights into the dynamic behavior of sensors by extracting their maximum or minimum values to represent the discrete-time series of sensor data.
In addition to traditional time series feature extraction methods, Martinelli et al.[73] proposed a feature extraction method based on phase space, transforming sensor responses into vectors that vary in amplitude and direction within the phase space. Liu et al.[74] extracted two sets of features from the original curves; one set includes 10 traditional time series features shown in Figure 9e, while the other consists of three transient features extracted using exponential moving averages. Shakya et al.[75] also divided feature extraction into two parts: traditional methods based on raw curves and a highly comparative time series analysis framework[76] to enrich the extracted information, as illustrated in Figure 9f. Chang et al.[77] designed a non-invasive preliminary screening system for diabetes by using an electronic nose sensor array to detect breath gas biomarkers. By applying gradient boosting and particle swarm optimization algorithms, they selected 24 most effective features, reducing the number of sensors by 56% and thus lowering system costs. This approach offers a more feasible method for preliminary diabetes screening and can serve as a complementary tool to existing diagnostic techniques.

4.2 Classical Pattern Recognition Algorithms

Pattern recognition algorithms are used to identify a category of patterns and are commonly applied in the fields of machine learning and artificial intelligence. The primary objective of pattern recognition algorithms is to identify specific patterns or features from a set of data. These algorithms are typically based on techniques such as statistics, machine learning, and neural networks. Common pattern recognition algorithms include Principal Component Analysis (PCA), Support Vector Machine (SVM) algorithms, decision tree algorithms, and neural network algorithms.

4.2.1 Principal Component Analysis (PCA)

Principal Component Analysis (PCA) is a commonly used linear transformation method, often employed for dimensionality reduction and data visualization. Its main idea is to map the original data into a new coordinate system, where the basis vectors are the principal components of the original dataset, i.e., the primary directions of variation in the data. In the PCA process, the covariance matrix of the dataset is first calculated, followed by solving for the eigenvalues and eigenvectors of this covariance matrix. The principal components are the eigenvectors of the covariance matrix, arranged in descending order of their corresponding eigenvalues. By projecting the original data onto these principal component directions, dimensionality reduction is achieved.
Guo et al.[78] proposed a novel breath analysis system. Figure 10a shows the exhaled gas sampling mode, followed by the introduction of odor signal preprocessing and classification methods, as illustrated in Figure 10c. The PCA algorithm not only distinguishes healthy subjects from those suffering from various diseases such as diabetes, kidney disease, and airway inflammation, but also helps assess the effectiveness of hemodialysis (treatment for renal failure) in cases of kidney dysfunction. Kang et al.[79] fabricated a high-performance chemoresistive electronic nose (CEN) system composed of a 3×3 sensor array based on different nanostructured metal oxide thin films. By combining responses from multiple sensor channels, the PCA algorithm achieved excellent discrimination of target gases such as NO, NH3, and H2S (Figure 10b).
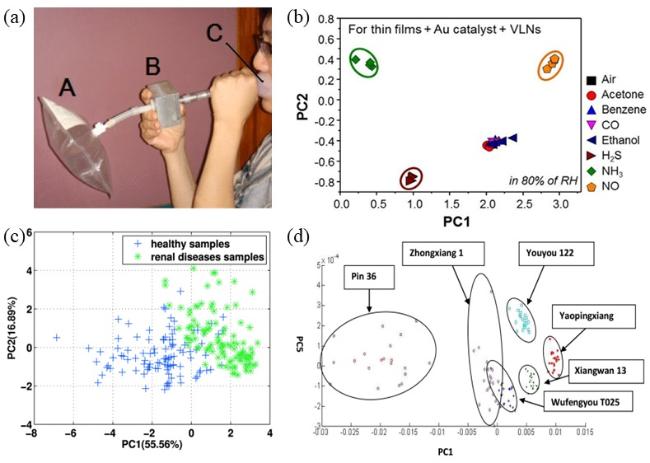
图10 (a)用气体采样袋收集呼出的空气,(b)CEN电子鼻区分NO、NH3和H2S,(c)PCA对健康样本(+)和肾脏疾病样本(-)的分类结果[78],(d)使用PC1和PC5对6个糙米品种进行分类[80]

Fig.10 (a)Exhaled air collected using a gas sampling bag,(b)CEN electronic nose distinguishing NO,NH3,and H2S,(c)PCA classification results for healthy samples(+)and kidney disease samples(-)[78],(d)classification of six brown rice varieties using PC1 and PC5[80]

Lan et al.[80] combined conventional PCA with the Wilks' Lambda statistic to achieve classification of different brown rice varieties. Compared with conventional classification methods, the classification accuracy improved by 6.67%, effectively demonstrating the effectiveness of using Wilks' Lambda statistic in enhancing the classification accuracy of conventional PCA. The combination of the above sensor array and pattern recognition algorithms can identify and distinguish different disease characteristics, making it highly suitable for disease diagnosis.

4.2.2 Linear Discriminant Analysis (LDA)

Linear Discriminant Analysis (LDA) is a linear classifier used for binary classification. It separates data into two classes by finding a linear boundary between them. The basic idea of LDA is to project the dataset onto a straight line such that the projected points of samples from the same class are as close as possible, while the projected points of samples from different classes are as far apart as possible.
Pani et al.[81] developed a novel electronic nose based on highly programmable anodic aluminum oxide (AAO) nanoarchitecture and ultrasonic spray pyrolysis (USP) deposition, which was validated using a gas identification algorithm based on linear discriminant analysis (LDA). As shown in Figure 11a, all types of gases are clearly separated, and the biomarker gases are well distinguished. These results are widely applicable to breath gas sensing and identification applications for patients. This technology demonstrates significant potential for early diagnosis of diseases such as diabetes, breast cancer, acute lung injury, colon disease, and lung cancer.
图11 (a)CH电子鼻系统LDA算法的分类结果[81],(b)使用支持向量机进行分类的混淆矩阵[82]

Fig.11 (a)Classification results of the CH electronic nose system using the LDA algorithm [81],(b)confusion matrix for classification using a support vector machine [82]

4.2.3 Support Vector Machine (SVM)

Support Vector Machine (SVM) is a machine learning algorithm widely used in pattern recognition and classification tasks, and it also plays an important role in electronic nose (E-nose) systems. It separates data of different categories by finding an optimal hyperplane (decision boundary). SVM can handle nonlinear problems in high-dimensional spaces and improve the recognition accuracy of electronic noses. Its core idea is to maximize the classification margin, thereby enhancing the accuracy of classification.
Mathew et al.[82] developed a breath analysis electronic nose (E-nose) that classifies and identifies lung cancer patients, chronic obstructive pulmonary disease (COPD) patients, and healthy controls using a support vector machine (SVM), achieving a high classification accuracy of 92.3%. Zhang et al.[83] developed a gas-sensing material based on porous MXene frameworks (MFs), selecting four ML algorithms, including support vector machine (SVM), k-nearest neighbor (KNN), random forest (RF), and artificial neural network (ANN), to distinguish between healthy subjects and patients. Through comparison, the SVM model demonstrated superior classification performance with an accuracy as high as 91.7%, and was ultimately used for wireless and real-time monitoring of urinary volatiles in clinical samples. This approach enables non-invasive diagnosis of multiple diseases, providing favorable opportunities for early disease diagnosis, disease progression monitoring, and related research.

4.3 Neural Networks

4.3.1 Artificial Neural Network (ANN)

Artificial Neural Network (ANN) is a computational model that simulates the structure of human brain neurons, used to achieve functions such as machine learning, pattern recognition, and prediction. It consists of a hierarchical structure composed of multiple neurons, including an input layer, hidden layers, and an output layer. ANN adjusts the connection weights between neurons by learning from a large amount of input and output data, thereby enabling prediction of unknown data. The application areas of ANNs are extensive, including image recognition, natural language processing, speech recognition, recommendation systems, and more. In many practical problems, ANNs can achieve satisfactory results.
Cerveri et al.[84] investigated an electronic nose based on a metal oxide sensor array. The electronic nose analyzed breath samples collected from healthy controls (n=10) and lung cancer subjects (n=6), and utilized an artificial neural network (ANN) for classification. Using a leave-one-out cross-validation (LOOCV) approach, the system achieved a specificity of 85.7% and an accuracy of 93.8%, ultimately being applied in the early diagnosis of lung cancer. Artificial neural networks have played a significant role in improving diagnostic accuracy and advancing the application of electronic noses in disease detection.

4.3.2 Convolutional Neural Network (CNN)

CNN is one of the most famous neural network models. Its popularity began with the establishment of the AlexNet model in 2012[85]. Due to its versatility, CNN has played a significant role in fields such as image recognition and natural language processing, and it has also been widely applied in time series analysis. Convolutional Neural Networks (CNN) are deep learning models or multi-layer perceptrons similar to artificial neural networks that can prevent information loss during the dimensionality reduction process. A CNN classifier generally consists of two parts: feature extraction and classification, as shown in Figure 12. It starts with an input layer (Input data) that receives input signal features, followed by feature extraction, which is composed of convolutional layers, activation layers, and pooling layers. It performs filter processing from raw data to the final target in order to extract useful and highly representative features. The remaining layers are fully connected to form a multi-layer perceptron, using the output layer to classify the extracted features, such as the commonly used Softmax function[86].
图12 基于 CNN 的模型的框架[86]

Fig.12 Framework of a model based on Convolutional Neural Networks(CNN)[86]

Park et al.[87] used metal oxides (SnO2, In2O3, WO3, and CuO) of nanocolumnar thin films as sensing materials to form a sensing array, as shown in Figure 13a. The study applied a convolutional neural network (CNN) for real-time selective gas detection with SMO gas sensors by analyzing transient regions of sensor outputs. The network consists of one convolutional layer and six fully connected (dense) layers. Convolution with six convolution kernels (8×5) was calculated for feature extraction, and the rectified linear unit (ReLU) function was used as the activation function. Batch normalization was performed on all layers, and the Softmax function was used in the output layer for classification. Finally, highly accurate classification of gases such as air, CO, NH3, NO2, CH4, and C3H6O under any condition was achieved (Figure 13b), with an overall classification accuracy reaching 98.06%. Rivai et al.[88] combined a one-dimensional convolutional neural network (1D-CNN) with a selected gas sensor array to obtain an optimized electronic nose, as illustrated in Figure 13c, representing the 1D CNN-LSTM/GRU architecture. The 1D CNN-LSTM is a combination of 1D-CNN and LSTM, consisting of optimal hidden layers of 1D-CNN, LSTM/GRU, and ANN, thereby enhancing the modeling capability of deep neural networks[89]. At the same time, the 1D-CNN model was selected as the classification method for the asthma dataset, achieving an accuracy of 96.6%.
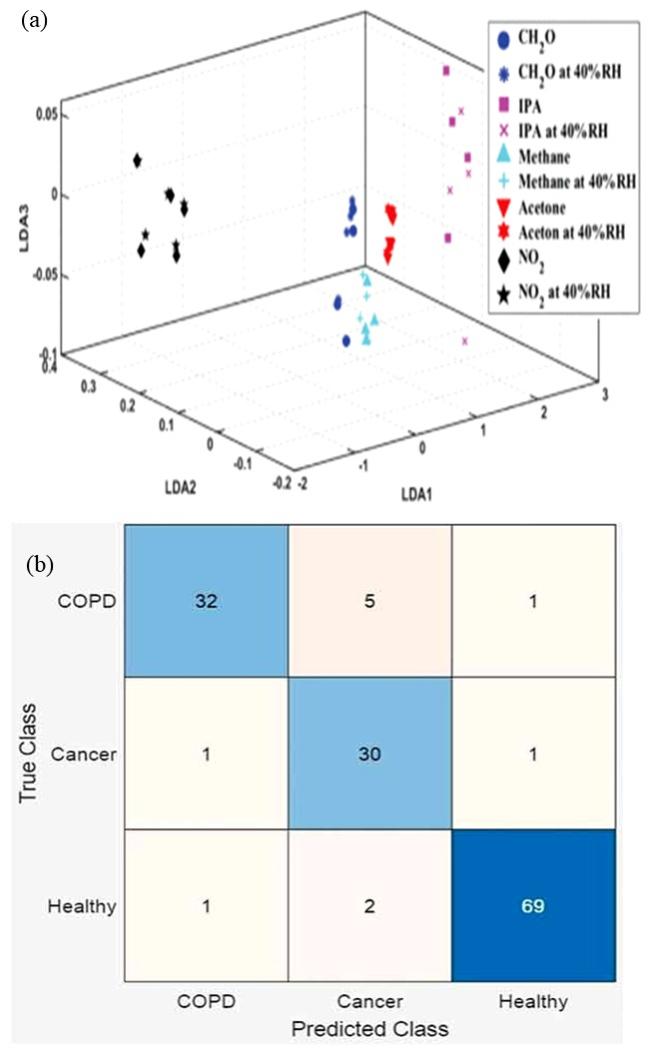
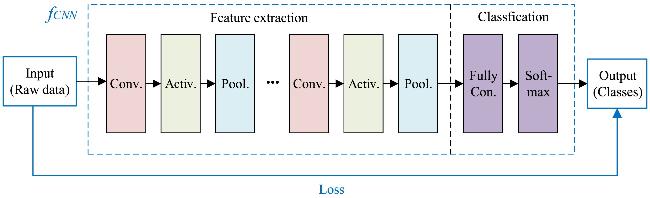
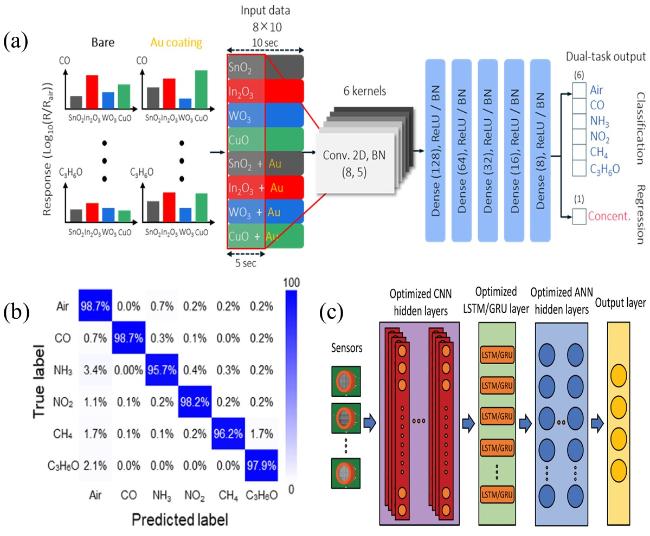
图13 (a)卷积神经网络(CNN)的气体传感数据分析对目标气体进行实时分类和回归,(b)对6种气体(即空气、CO、NH3、CO2、CH4和 C3H6O)的混淆矩阵分类准确率[87],(c)1D CNN-LSTM/GRU架构[88]

Fig.13 (a)Shows the real-time classification and regression of target gases using gas sensor data analysis with a Convolutional Neural Network(CNN),(b)displays the classification accuracy of the confusion matrix for six gases(air,CO,NH3,CO2,CH4,and C3H6O)[87],(c)depicts the 1D CNN-L90STM/GRU architecture[88]

5 Application of Ammonia Sensors in Respiratory Health Monitoring

For a long time, the presence of ammonia in the body has been associated with complications in the liver, kidneys, and stomach. These complications may result from severe diseases such as chronic kidney disease (CKD)[91-92], digestive disorders, and the epidemic COVID-19[93-94]. Impaired liver and kidney function leads to increased blood urea nitrogen (BUN) levels in the body, thereby causing elevated ammonia levels in the mouth, nose, and skin. Similarly, peptic ulcers (often caused by Helicobacter pylori) lead to ammonia production from urea in the stomach. The presence of these biomarkers makes non-invasive disease monitoring possible. However, detecting ammonia in these media is challenging due to its relatively low concentration and the abundance of interfering substances. Currently, ammonia gas sensors have been extensively researched and applied in disease detection.

5.1 Application of Ammonia Sensors in Chronic Kidney Disease

Chronic kidney disease (CKD) has become a significant health issue worldwide for decades, with a high mortality rate among patients. Nephrons are the functional units of the kidneys, responsible for excreting nitrogenous waste from the blood. During kidney failure, nephron function may be partially or completely lost, leading to renal dysfunction. Current treatment options mainly prolong patients' lives through dialysis and kidney transplantation. Traditional kidney disease screening relies on clinical assessments by detecting urinary proteins, blood urea nitrogen, and glomerular filtration rate (GFR), using commonly techniques such as urinalysis, blood tests, and biopsies[95-96]. However, these techniques are highly invasive and traumatic, often causing patient intolerance and pain. Additionally, the detection equipment is expensive and requires experienced personnel for operation and maintenance. Therefore, it is essential to develop disease early warning systems based on gas-sensitive sensors that detect human exhaled breath. Ammonia sensors offer rapid, low-cost, non-invasive, user-friendly, real-time, and cost-effective features, making them suitable for large-scale kidney disease screening, while enabling early prevention and prompt detection of chronic kidney disease (CKD).
Limeres et al.[97] found a significant correlation between respiratory ammonia concentration and blood urea concentration before and after dialysis. This correlation can be used to monitor the condition of end-stage chronic kidney disease (CKD) patients during dialysis. Ammonia, as a biomarker of kidney disease, is produced due to disturbances in human metabolic processes. Figure 14 shows that in healthy individuals, ammonia and ammonium ions are produced during digestion and transported via the blood to the liver. In the liver, these compounds are converted into urea through the urea cycle. Subsequently, blood urea is absorbed by the kidneys and used to filter urea from the blood; excess ammonia appears between the ureter and renal vein. Finally, excess ammonia and ammonium ions are excreted from the body in urine through the ureter. At the same time, excessive ammonia and ammonium ions may also cross the blood-lung barrier and be detected in exhaled breath. According to literature, the ammonia content in exhaled breath of healthy individuals ranges approximately from 50 to 1,500 ppb[98-99], whereas patients with kidney disease have ammonia levels higher than 1,500 ppb, and it can even reach up to 15,000 ppb[100-101].
图14 人体氨的来源和代谢示意图

Fig.14 Schematic representation of source and metabolism of ammonia in human

Pud et al.[102] developed a specific conductive array composed of 11 different polyaniline nanocomposite material sensors based on the electronic nose principle. By employing feature algorithms, feature selection, and support vector machines, the diagnostic accuracy reached 91%, effectively overcoming the weaknesses of sensor drift and sensitivity to humidity. Furthermore, it can detect ammonia within the typical concentration range of human breath (500 ppb to 2,100 ppb), achieving a low detection limit of 500 ppb, thus laying a solid foundation for non-invasive and portable kidney disease detection.

5.2 Application of Ammonia Sensors in Patients with Helicobacter pylori Positive

*Helicobacter pylori* (Hp) is a Gram-negative bacterium primarily present on the surface of gastric mucosa. It is closely associated with diseases such as gastritis, gastric ulcers, duodenal ulcers, and gastric cancer. Hp infection mainly results from the production of CO2 and NH3, which are decomposition products of urease in gastric juice. Therefore, direct measurement of urease activity in gastric juice is considered an effective method for diagnosing Hp infection. However, this approach requires endoscopic procedures, which are invasive and costly[103]. In addition, breath tests are also used for detecting *H. pylori*. Non-invasive breath tests using isotope labeling to mark [ 13C] and [14C] in CO2 have demonstrated excellent diagnostic performance. However, [13C]-urea breath tests are relatively expensive, while [14C]-urea breath tests are not widely used in children or pregnant women due to the use of radioactive isotopes[104]. Thus, measuring ammonia in exhaled breath after ingestion of unlabelled urea may be an effective means of diagnosing Hp infection. Studies indicate that the ammonia concentration in breath after urea ingestion is eight times higher in patients with Hp infection (0.4 ppm) compared to healthy individuals (0.05 ppm)[103].
Currently, there are relatively few studies on the application of ammonia gas sensing for Helicobacter pylori positivity. Lee et al.[62] fabricated a highly porous nanostructured CuBr flexible sensor on a PI substrate through thermal evaporation to achieve a low detection limit (50 ppb), and uniformly coated a nanoscale CeO2 film onto the CuBr layer via electron beam spraying. This sensor demonstrated significant response to simulated breath samples from patients infected with Helicobacter pylori. This study indicates that ammonia gas sensing holds great potential in medical diagnostics, particularly for diagnosing Helicobacter pylori positivity and gastrointestinal diseases.

6 Conclusion and Prospect

An ideal ammonia sensor should exhibit good selectivity and humidity resistance; however, existing ammonia-sensitive materials such as polymers and metal oxides are easily affected by humidity[105] and interfering gases. Current techniques often achieve classification and recognition of mixed gases, while eliminating the influence of humidity and interfering gases, thereby enabling disease warning and diagnosis, through methods such as compositing with humidity-resistant materials[106], adding humidity drift compensation[107-108], and forming electronic noses using sensor arrays[109-110].
In recent years, significant progress has been made in the development of ammonia gas sensors and their electronic nose systems; however, several challenges remain. Sensor drift hinders the calibration between sensor responses and algorithm performance, leading to reduced matching accuracy. The complexity of the response mechanisms of gas-sensitive sensors makes it difficult to obtain prior response functions and accurate mathematical models. Consequently, researchers still rely on empirical methods when selecting signal processing and pattern recognition algorithms. Continuous improvement is needed in the future. It is believed that with enhanced stability of ammonia gas sensors and the adoption of innovative electronic nose technologies, their application prospects in health monitoring and disease diagnosis will be highly promising.
[1]
Das S, Pal M. J. Electrochem. Soc., 2020, 167(3): 037562.

[2]
Cikach F S Jr, Dweik R A. Prog. Cardiovasc. Dis., 2012, 55(1): 34.

[3]
Boshier P R, Marczin N, Hanna G B. J. Am. Soc. Mass Spectrom., 2010, 21(6): 1070.

[4]
Neri G, Lacquaniti A, Rizzo G, Donato N, Latino M, Buemi M. Nephrol. Dial. Transplant., 2012, 27(7): 2945.

[5]
Xu C N, Tamaki J, Miura N, Yamazoe N. Chem. Lett., 1990, 19(3): 441.

[6]
Dey A. Mater. Sci. Eng. B, 2018, 229: 206.

[7]
Liu C J, Hsieh J C, Ju Y H. J. Vac. Sci. Technol. A Vac. Surf. Films, 1996, 14(3): 753.

[8]
Zhang D Z, Wang D Y, Li P, Zhou X Y, Zong X Q, Dong G K. Sens. Actuat. B Chem., 2018, 255: 1869.

[9]
Gao N B, Li H Y, Zhang W H, Zhang Y Z, Zeng Y, Hu Z X, Liu J Y, Jiang J J, Miao L, Yi F, Liu H. Sens. Actuat. B Chem., 2019, 293: 129.

[10]
Rianjanu A, Fauzi F, Triyana K, Wasisto H S. ACS Appl. Nano Mater., 2021, 4(10): 9957.

[11]
Roto R, Rianjanu A, Fatyadi I A, Kusumaatmaja A, Triyana K. Sens. Actuat. A Phys., 2020, 304: 111902.

[12]
Srivastava A K, Sakthivel P. J. Vac. Sci. Technol. A Vac. Surf. Films, 2001, 19(1): 97.

[13]
Zhou D D, Kang Z J, Liu X H, Yan W Y, Cai H L, Xu J Q, Zhang D Z. Sens. Actuat. B Chem., 2023, 392: 134072.

[14]
Zhang B H, Li Z Q, Li C, Li M, Fu C, Tao R, Zha X H, Li H L, Luo J T. Sens. Actuat. A Phys., 2023, 350: 114138.

[15]
Giddey S, Badwal S P S, Kulkarni A. Int. J. Hydrog. Energy, 2013, 38(34): 14576.

[16]
Rogers E I, O’Mahony A M, Aldous L, Compton R G. ECS Trans., 2010, 33(7): 473.

[17]
Ji X B, Banks C E, Compton R G. Anal., 2005, 130(10): 1345.

[18]
Sazhin S G, Soborover E I, Tokarev S V. Russ. J. Nondestruct. Test., 2003, 39(10): 791.

[19]
King B H, Gramada A, Link J R, Sailor M J. Adv. Mater., 2007, 19(22): 4044.

[20]
Patel S, Jamunkar R, Sinha D, Monisha, Patle T K, Kant T, Dewangan K, Shrivas K. Trends Environ. Anal. Chem., 2021, 31: e00136.

[21]
Wu Y, Feng J, Hu G, Zhang E, Yu H H. Sensors, 2023, 23(5): 2749.

[22]
Lee S, Lee E H, Lee S W. Biosensors, 2022, 12(8): 664.

[23]
Bârsan N, Hübner M, Weimar U. Sens. Actuat. B Chem., 2011, 157(2): 510.

[24]
Walker J, Karnati P, Akbar S A, Morris P A. Sens. Actuat. B Chem., 2022, 355: 131242.

[25]
Hu Q, Wang Z M, Chang J Y, Wan P, Huang J H, Feng L. Sens. Actuat. B Chem., 2021, 344: 130179.

[26]
Zhang J, Qin Z Y, Zeng D W, Xie C S. Phys. Chem. Chem. Phys., 2017, 19(9): 6313.

[27]
Shishiyanu S T, Shishiyanu T S, Lupan O I. Sens. Actuat. B Chem., 2005, 107(1): 379.

[28]
Kathwate L H, Umadevi G, Kulal P M, Nagaraju P, Dubal D P, Nanjundan A K, Mote V D. Sens. Actuat. A Phys., 2020, 313: 112193.

[29]
Zhang D Z, Jiang C X, Sun Y E. J. Alloys Compd., 2017, 698: 476.

[30]
Boomashri M, Perumal P, Gunavathy K V, Alkallas F H, Ben Gouider Trabelsi A, Shkir M, AlFaify S. Ceram. Int., 2023, 49(6): 10096.

[31]
Wang T, Liu G F, Zhang D Z, Wang D Y, Chen F J, Guo J Y. Appl. Surf. Sci., 2022, 597: 153564.

[32]
Lawaniya S D, Kumar S, Yu Y, Awasthi K. Sens. Actuat. B Chem., 2023, 382: 133566.

[33]
Baker C O, Huang X W, Nelson W, Kaner R B. Chem. Soc. Rev., 2017, 46(5): 1510.

[34]
Ćirić-Marjanović G. Synth. Met., 2013, 177: 1.

[35]
Ballabio M, Zhang T, Chen C, Zhang P, Liao Z Q, Hambsch M, Mannsfeld S C B, Zschech E, Sirringhaus H, Feng X L, Bonn M, Dong R H, Cánovas E. Adv. Funct. Mater., 2021, 31(43): 2105184.

[36]
Kang K, Watanabe S, Broch K, Sepe A, Brown A, Nasrallah I, Nikolka M, Fei Z P, Heeney M, Matsumoto D, Marumoto K, Tanaka H, Kuroda S I, Sirringhaus H. Nat. Mater., 2016, 15(8): 896.

[37]
Bhadra S, Khastgir D, Singha N K, Lee J H. Prog. Polym. Sci., 2009, 34(8): 783.

[38]
Chiang J C, MacDiarmid A G. Synth. Met., 1986, 13(1/3): 193.

[39]
Tian X, Cui X X, Xiao Y W, Chen T, Xiao X C, Wang Y D. ACS Appl. Mater. Interfaces, 2023, 15(7): 9604.

[40]
Li P D, Li J Z, Liu F, Shi J J, Gao X W, Xu H Y. ACS Appl. Nano Mater., 2023, 6(19): 17423.

[41]
Aalam S M, Sarvar M, Sadiq M, Ali J. ACS Omega, 2024, 9(4): 4486.

[42]
Qin Z J, Wu Z F, Sun Q H, Sun J, Zhang M, Chen F J, Zhang D Z, Lv C W, Duan H M. Carbon, 2023, 213: 118297.

[43]
Kim Y, Choi Y S, Park S Y, Kim T, Hong S P, Lee T H, Moon C W, Lee J H, Lee D, Hong B H, Jang H W. Nanoscale, 2019, 11(6): 2966.

[44]
Pham T, Li G H, Bekyarova E, Itkis M E, Mulchandani A. ACS Nano, 2019, 13(3): 3196.

[45]
Gao D Q, Xia B R, Zhu C R, Du Y H, Xi P X, Xue D S, Ding J, Wang J. J. Mater. Chem. A, 2018, 6(2): 510.

[46]
Weber M, Kim J Y, Lee J H, Kim J H, Iatsunskyi I, Coy E, Miele P, Bechelany M, Kim S S. J. Mater. Chem. A, 2019, 7(14): 8107.

[47]
Faye O, Eduok U, Szpunar J A. J. Phys. Chem. C, 2019, 123(49): 29513.

[48]
Lee E, VahidMohammadi A, Prorok B C, Yoon Y S, Beidaghi M, Kim D J. ACS Appl. Mater. Interfaces, 2017, 9(42): 37184.

[49]
Yang J C, Gui Y G, Wang Y F, He S S. J. Ind. Eng. Chem., 2023, 119: 476.

[50]
Cao L C T, Zhou M H, Opaprakasit P, Sreearunothai P, Nagao Y, Boonruang S, Fallah H, Tseng S F, Hsu S H. Adv. Mater. Interfaces, 2023, 10(16): 2300166.

[51]
Li L, Li G S, Zhang W Q, She C K, Lin J Q, Liu S H, Yue F Y, Jing C B, Cheng Y, Chu J H. Mater. Lett., 2020, 278: 128438.

[52]
Liu A, Lv S Y, Zhao L J, Liu F M, Wang J, You R, Yang Z J, He J M, Jiang L, Wang C G, Yan X, Sun P, Lu G Y. Sens. Actuat. B Chem., 2021, 330: 129313.

[53]
Das T, Das S, Karmakar M, Chakraborty S, Saha D, Pal M. Sens. Actuat. B Chem., 2020, 325: 128765.

[54]
Wu G D, Du H S, Lee D, Cha Y L, Kim W, Zhang X Y, Kim D J. ACS Appl. Mater. Interfaces, 2022, 14(50): 56056.

[55]
Duan X H, Duan Z H, Zhang Y J, Liu B H, Li X, Zhao Q N, Yuan Z, Jiang Y D, Tai H L. Sens. Actuat. B Chem., 2022, 369: 132302.

[56]
Jin L, Wu C L, Wei K, He L F, Gao H, Zhang H X, Zhang K, Asiri A M, Alamry K A, Yang L, Chu X F. ACS Appl. Nano Mater., 2020, 3(12): 12071.

[57]
Wang C, Cai Y Y, Zhou W, Chen P, Xu L, Han T, Hu Y L, Xu X H, Liu B T, Yu X. ACS Appl. Mater. Interfaces, 2022, 14(10): 12630.

[58]
Li S, Liu A, Yang Z, He J, Wang J, Liu F, Lu H, Yan X, Sun P, Liang X, Gao Y, Lu G. Sens. Actuators B Chem., 2019, 299: 126970.

[59]
Kulkarni S B, Navale Y H, Navale S T, Stadler F J, Ramgir N S, Patil V B. Sens. Actuat. B Chem., 2019, 288: 279.

[60]
Fan S X, Tang W. Sens. Actuat. B Chem., 2022, 362: 131789.

[61]
Wu G D, Du H S, Cha Y L, Lee D, Kim W, Feyzbar-Khalkhali-Nejad F, Oh T S, Zhang X Y, Kim D J. Sens. Actuat. B Chem., 2023, 375: 132858.

[62]
Li H Y, Lee C S, Kim D H, Lee J H. ACS Appl. Mater. Interfaces, 2018, 10(33): 27858.

[63]
Jia A Q, Liu B T, Liu H Y, Li Q F, Yun Y X. Front. Chem., 2020, 8: 383.

[64]
Gautam S K, Panda S. Talanta, 2023, 258: 124418.

[65]
Haick H. J. Phys. D: Appl. Phys., 2007, 40(23): 7173.

[66]
Persaud K, Dodd G. Nature, 1982, 299(5881): 352.

[67]
Li Y, Wei X Y, Zhou Y M, Wang J, You R. Microsyst. Nanoeng., 2023, 9: 129.

[68]
Yan J, Guo X Z, Duan S K, Jia P F, Wang L D, Peng C, Zhang S L. Sensors, 2015, 15(11): 27804.

[69]
Zhang T C, Tan R Q, Shen W F, Lv D W, Yin J Q, Chen W G, Fu H Y, Song W J. Sens. Actuat. B Chem., 2023, 382: 133555.

[70]
Yan J, Duan S K, Huang T W, Wang L D. Sens. Rev., 2016, 36(1): 23.

[71]
Ogbeide O, Bae G, Yu W B, Morrin E, Song Y, Song W, Li Y, Su B L, An K S, Hasan T. Adv. Funct. Mater., 2022, 32(25): 2113348.

[72]
Sun H, Tian F C, Liang Z F, Sun T, Yu B, Yang S X, He Q H, Zhang L L, Liu X M. IEEE Trans. Ind. Electron., 2017, 64(9): 7350.

[73]
Martinelli E, Falconi C, D’Amico A, Di Natale C. Sens. Actuat. B Chem., 2003, 95(1/3): 132.

[74]
Liu B, Yu H Q, Zeng X P, Zhang D, Gong J, Tian L, Qian J H, Zhao L L, Zhang S Y, Liu R. Sens. Actuat. B Chem., 2021, 339: 129896.

[75]
Shakya P, Kennedy E, Rose C, Rosenstein J K. IEEE Sens. J., 2021, 21(3): 2495.

[76]
Fulcher B D, Jones N S. Cell Syst., 2017, 5(5): 527.

[77]
Weng X H, Li G H, Liu Z W, Liu R, Liu Z Y, Wang S Y, Zhao S S, Ma X T, Chang Z Y. Endocr. Connect., 2023, 12(3): e220437.

[78]
Guo D M, Zhang D, Li N M, Zhang L, Yang J H. IEEE Trans. Biomed. Eng., 2010, 57(11): 2753.

[79]
Moon H G, Jung Y, Han S D, Shim Y S, Shin B, Lee T, Kim J S, Lee S, Jun S C, Park H H, Kim C, Kang C Y. ACS Appl. Mater. Interfaces, 2016, 8(32): 20969.

[80]
Xu S, Zhou Z Y, Lu H Z, Luo X W, Lan Y B. Sensors, 2014, 14(3): 5486.

[81]
Pan X F, Zhao X J, Xu W, Fan Z Y, Bermak A. IEEE Trans. Electron Devices, 2022, 69(8): 4514.

[82]
V A B, Subramoniam M, Mathew L. Expert Rev. Mol. Diagn., 2021, 21(11): 1223.

[83]
Ding X Y, Zhang Y C, Zhang Y, Ding X F, Zhang H X, Cao T, Qu Z-B, Ren J, Li L, Guo Z J, Xu F, Wang Q X, Wu X, Shi G Y, Haick H, Zhang M. ACS Nano, 2022, 16(10): 17376.

[84]
Marzorati D, Mainardi L, Sedda G, Gasparri R, Spaggiari L, Cerveri P. 2019 41ST Annual International Conference of the IEEE Engineering in Medicine and Biology Society (EMBC). 2019: 1584.

[85]
Krizhevsky A, Sutskever I & Hinton, G E. Commun ACM. 2017, 60(6): 84.

[86]
Feng L H, Dai H H, Song X, Liu J M, Mei X. Sens. Actuat. B Chem., 2022, 351: 130986.

[87]
Kang M G, Cho I, Park J, Jeong J, Lee K, Lee B, Del Orbe Henriquez D, Yoon K, Park I. ACS Sens., 2022, 7(2): 430.

[88]
Aulia D, Sarno R, Hidayati S C, Rivai M. IEEE Access, 2023, 11: 74924.

[89]
Mohammed Alsumaidaee Y A, Yaw C T, Koh S P, Tiong S K, Chen C P, Yusaf T, Abdalla A N, Ali K, Raj A A. Sensors, 2023, 23(6): 3108.

[90]
Tsujii M, Kawano S, Tsuji S, Fusamoto H, Kamada T, Sato N. Gastroenterology, 1992, 102(6): 1881.

[91]
Chan M J, Li Y J, Wu C C, Lee Y C, Zan H W, Meng H F, Hsieh M H, Lai C S, Tian Y C. Biomedicines, 2020, 8(11): 468.

[92]
Brannelly N T, Hamilton-Shield J P, Killard A J. Crit. Rev. Anal. Chem., 2016, 46(6): 490.

[93]
Ok F, Erdogan O, Durmus E, Carkci S, Canik A. J. Med. Virol., 2021, 93(2): 786.

[94]
Ruan Q R, Yang K, Wang W X, Jiang L Y, Song J X. Intensive Care Med., 2020, 46(5): 846.

[95]
Shafi T, Michels W M, Levey A S, Inker L A, Dekker F W, Krediet R T, Hoekstra T, Schwartz G J, Eckfeldt J H, Coresh J. Kidney Int., 2016, 89(5): 1099.

[96]
Whittier W L, Sayeed K, Korbet S M. Clin. Kidney J., 2016, 9(1): 102.

[97]
Limeres J, Garcez J F, Marinho J S, Loureiro A, Diniz M, Diz P. Br. J. Biomed. Sci., 2017, 74(1):24.

[98]
Španěl P, Davies S, Smith D. Rapid Commun. Mass Spectrom., 1998, 12(12): 763.

[99]
Aguilar A D, Forzani E S, Nagahara L A, Amlani I, Tsui R, Tao N J. IEEE Sens. J., 2008, 8(3): 269.

[100]
Davies S, Spanel P, Smith D. Kidney Int., 1997, 52(1): 223.

[101]
Endre Z H, Pickering J W, Storer M K, Hu W P, Moorhead K T, Allardyce R, McGregor D O, Scotter J M. Physiol. Meas., 2011, 32(1): 115.

[102]
Le Maout P, Wojkiewicz J L, Redon N, Lahuec C, Seguin F, Dupont L, Mikhaylov S, Noskov Y, Ogurtsov N, Pud A. Sens. Actuat. B Chem., 2018, 274: 616.

[103]
Kearney D J, Hubbard T, Putnam D. Dig. Dis. Sci., 2002, 47(11): 2523.

[104]
Bazzoli F, Zagari M, Fossi S, Pozzato P, Ricciardiello L, Mwangemi C, Roda A, Roda E. Helicobacter, 1997, 2(s1): 34.

[105]
Ng R B F, Wang J W, Luo Y F, Chen X D. IEEE Nanotechnol. Mag., 2024, 18(1): 13.

[106]
Xiao S H, Hu M J, Hong Y H, Hu M J, Sun T T, Chen D J. Biosensors, 2024, 14(9): 411.

[107]
Lv W, Yang J H, Xu Q D, Mehrez J A, Shi J, Quan W J, Luo H Y, Zeng M, Hu N T, Wang T, Wei H, Yang Z. Nat. Commun., 2024, 15: 6936.

[108]
Ushimi Y, Ito Y, Horiuchi H, Kadota M, Nozaki Y, Hotta Y, Shiratori S. Electron. Commun. Jpn., 2015, 98(6): 1.

[109]
Zhang J Y, Xue Y Y, Sun Q Y, Zhang T, Chen Y T, Yu W J, Xiong Y Z, Wei X W, Yu G T, Wan H, Wang P. Sens. Actuat. B Chem., 2021, 326: 128822.

[110]
Yao Y B, Chen B, Liu C J, Feng C H, Gao X L, Gu Y. Expert Syst. Appl., 2024, 250: 123757.

Outlines

/