
Environmental Persistent Radicals in Atmospheric Particulate Matters
Received date: 2024-09-09
Revised date: 2024-12-24
Online published: 2025-06-20
Supported by
the National Natural Science Foundation of China(22206049)
the Fundamental Research Funds for Central Universities(2024MS174)
Compared with short-lived radicals, environmentally persistent free radicals (EPFRs) can exist in the environment for a long time and have long-distance migration ability. They mainly derive from vehicle emissions, industry emissions and biomass combustion. They are usually generated on the surface of particles. EPFRs exist widely in various environmental media like atmospheric particulate matters (PMs). Because the composition, source and formation mechanism of PMs varies in different regions, different seasons and different particle sizes, the characteristics of EPFRs are also different. Electron Paramagnetic Resonance (EPR) is an effective method to determine EPFRs in PMs. EPFRs on PMs can induce reactive oxygen species (ROS), cause oxidative stress in the cell and oxidative DNA damage. However, the assessment of their health risks is not perfect yet. Concentrated on the EPFRs in PMs, this paper summarized the occurrence characteristics of EPFRs in PMs in different regions, different seasons and different particle sizes, analyzed its source and generation mechanism, compared the advantages and disadvantages of existing determination methods, and discussed its health risk and related evaluation models. The related research work in the future is also prospected.
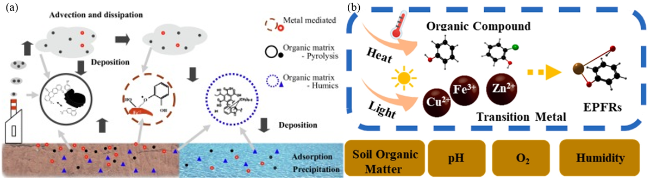
EPFRs in PMs mainly derive from the vehicle emission, industry emission and biomass combustion. Typically, EPFRs form through electron transfer from organic compounds to transition metals during thermal processes, they are generated on the surface of the PMs. Transition metals and transition metal oxides can promote the formation of EPFRs. The characteristics of EPFRs in PMs varies in different regions, different seasons and different particle sizes. EPR is the most effective method to determine EPFRs in PMs. EPFRs can induce health risk and the equivalent cigarette model usually used to assess the exposure dose. However, the assessment of their health risk is not perfect yet.
1 Introduction
2 Characteristics of EPFRs in PMs
2.1 Characteristics of EPFRs in PMs in different regions
2.2 Characteristics of EPFRs in PMs in different seasons
2.3 Characteristics of EPFRs in PMs with different particle sizes
3 Sources and formation mechanisms of EPFRs in PMs
4 Determination methods of EPFRs in PMs
4.1 Determination after solvent extraction
4.2 Determination directly using EPR
5 Health risks of EPFRs in PMs
5.1 Toxicological study
5.2 Exposure risk assessment
6 Conclusion and prospects
Chungang Yuan , Mingyu Li , Jiaojiao Xie , Yiran Fu , Yiwen Shen , Songyao Liu , Huiying Gao . Environmental Persistent Radicals in Atmospheric Particulate Matters[J]. Progress in Chemistry, 2025 , 37(7) : 1025 -1034 . DOI: 10.7536/PC240817
表1 EPFRs的分类Table1 EPFRs category |
| g factor | Types of EPFRs | Typical structural formula |
|---|---|---|
| <2.0030 | Carbon-centered EPFRs | 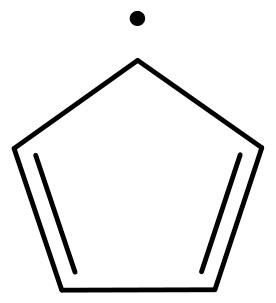 Cyclopentadienyl |
| 2.0030~ 2.0040 | Carbon-centered and adjacent oxygen EPFRs | 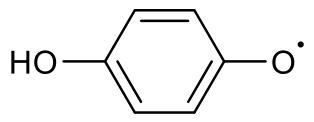 Semiquinone radicals |
| >2.0040 | Oxygen-centered EPFRs | 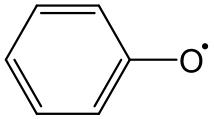 Phenoxy radicals |
表2 PMs中EPFRs测定方法汇总表Table 2 Determination methods of EPFRs in PMs |
| Methods | Sampling membrane type | Sampling location | Pre-treatment methods | Instrument Model | g-factor | Concentration of EPFRs | Ref |
|---|---|---|---|---|---|---|---|
| Direct assay | PM2.5 Quartz film | Beijing | Place the strip sample(5 mm × 28 mm) into a quartz tube | EPR EMX-plus,Burker | Range of g-factor:2.0024~2.0030 | 2018/1/22:4.36×1013 spins·m-3;2018/7/22:5.03×1012 spins·m-3 | 49 |
| Winter, Spring, Autumn: 2.0038;Summer:2.0035 | Spring:2.63×10¹³ spins·m-3 Summer:2.92×10¹³ spins·m-3 Autumn:1.50×10¹³ spins·m-3 Winter:2.13×10¹³ spins·m-3 | 50 | |||||
| Place the strip sample(2~3 cm) into a quartz tube | Bruker EMX nano continuous wave (CW) X-band | Range of g-factor:2.00339±0.00025 | The average concentration of EPFRs in Spring、3Autumn、Winter:6.00 ×10¹⁷ spins·m-3 The average concentration of EPFRs in cold mouth: 5.22×10²¹ spins·g-1 | 20 | |||
| Zheng- zhou | Place the 1/8 PM2.5 filter (ΦA =90mm) into a quartz tube | Spring:2.0032~2.0041;Summer:2.0031~2.0035;Autumn:2.0031~2.0036;Winter:2.0029~2.0035 | 1.73×10¹²~7.18×10¹⁴ spins·m-3 | 22 | |||
| Place the strip sample(7 mm×20 mm) into a quartz tube | Bruker EPR EMX plus (X-band) | Spring,2019:2.0032~2.0041;Summer,2020:2.0030~2.0035;Autumn,2020:2.0031~2.0036;Winter,2020:2.0029~2.0035 | Spring:1.73×10¹²~6.48×10¹³ spins·m-3 Summer:1.76×10¹²~5.25×10¹³ spins·m-3;Autumn:9.23×10¹⁴~1.32×10¹⁶ spins·m-3;Winter:9.98×10¹⁵~2.22×10¹⁷ spins·m-3 | 51 | |||
| Xi'an | Place two strip sample(5 mm×28 mm) into a quartz tube | EPR Burker MS5000 | Not detected | Spring:1.65×10¹⁴ spins·m-3;Summer:9.52×10¹³ spins·m-3;Autumn:1.04×10¹⁴ spins·m-3;Winter:1.79×10¹⁴ spins·m-3;Annual average concentration:1.36×10¹⁴ spins·m-3 | 52 | ||
| Place two strip sample(5 mm×28 mm) onto a quartz plate | EPR Burker MS5000 | Average g-factor:2.0034 | Range:1.23×10¹⁸~2.56×10¹⁹ spins·g-1 Average concentration:3.97×10¹⁴ spins/m3 | 48 | |||
| Xiamen | Place the 1/16 PM2.5 filter (ΦA =81mm) into a quartz tube | EPR Bruker EMX nano Bruker | Range of g-factor:2.0031~2.0038 | 1.60×10¹³~2.448×10¹⁴ spins·m-3 | 26 | ||
| PM2.5 PTFE film | Colorado, USA | Roll the entire filter membrane (Φ A=47 mm) into a cylindrical shape and place it in a quartz tube | EMX nano continuous wave X-band | Average g-factor:2.0016 | 1.04~1.47×10¹² spins·m-3 | 53 | |
| Solvent extraction method | PM2.5 Quartz film | Beijing | Shake 20ml DCM for 3 minutes, let it stand in the dark for 6 hours, and concentrate it to 100mL by nitrogen blowing | EPR EMX plus(X-band) | TSP:2.00316~2.00371 PM<1μm:2.00323~2.00371 | PM<1 μm:7.4×10¹⁹~3.9×10²⁰ spins·g-1;PM1.0-2.5 μm:4.7×10¹⁹~6.5 ×10²⁰ spins·g-1;PM2.5-10 μm:Not detected~8.2×10¹⁹spins/g; TSP:3.1×10¹⁹~6.2×10²⁰ spins·g-1 | 5 |
| Xi'an | Single solvent extraction: Soak the filter membrane in 30ml DCM for 3 minutes and leave it in the dark for 10 hours Multi solvent extraction: Wash the filter membrane with 10mL MeOH, 10mL DCM, and 10mL n-hexane in three sequential pressure washes | Burker MS5000 EPR | Average g-factor:2.0038 | Single solvent extraction:Not detected Multi solvent extraction: The average extraction efficiency is 6.8%; Average concentration:0.27×10¹⁴ spins·m-3 | 48 | ||
| 10mL MeOH, 10mL DCM, and 10mL n-hexane were sequentially pressurized to wash the filter membrane, then nitrogen blown to concentrate to 0.1mL and transferred to a 5×28mm quartz filter membrane. | Original sample:2.0028~2.0033 Extract samples:2.0027~2.0032 | Original sample:2.58×10¹⁴~5.41× 10¹⁴ spins·m-3; 2.58×10¹⁴~9.17×10¹⁸ spins·g-1;Extraction efficiency:88±10% | 45 |
| [1] |
|
| [2] |
|
| [3] |
|
| [4] |
|
| [5] |
|
| [6] |
|
| [7] |
|
| [8] |
|
| [9] |
|
| [10] |
|
| [11] |
|
| [12] |
|
| [13] |
|
| [14] |
|
| [15] |
|
| [16] |
|
| [17] |
|
| [18] |
|
| [19] |
|
| [20] |
|
| [21] |
|
| [22] |
|
| [23] |
|
| [24] |
|
| [25] |
|
| [26] |
|
| [27] |
|
| [28] |
|
| [29] |
|
| [30] |
|
| [31] |
|
| [32] |
|
| [33] |
|
| [34] |
|
| [35] |
|
| [36] |
|
| [37] |
|
| [38] |
|
| [39] |
|
| [40] |
|
| [41] |
|
| [42] |
|
| [43] |
|
| [44] |
|
| [45] |
|
| [46] |
|
| [47] |
|
| [48] |
|
| [49] |
|
| [50] |
|
| [51] |
(何清云. 郑州大学硕士论文, 2021).
|
| [52] |
(李升苹. 陕西科技大学硕士论文, 2021).
|
| [53] |
|
| [54] |
|
| [55] |
|
| [56] |
|
| [57] |
|
| [58] |
|
| [59] |
|
| [60] |
|
| [61] |
|
| [62] |
|
| [63] |
|
| [64] |
|
| [65] |
|
/
| 〈 |
|
〉 |