
The Sources, Emission Characteristics, and Environmental Management of Polychlorinated Naphthalenes
Received date: 2025-05-02
Revised date: 2025-06-06
Online published: 2025-09-30
Supported by
Strategic Priority Research Program of the Chinese Academy of sciences(XDB0750400)
National Natural Science Foundation of China(22376204)
National Natural Science Foundation of China(22576189)
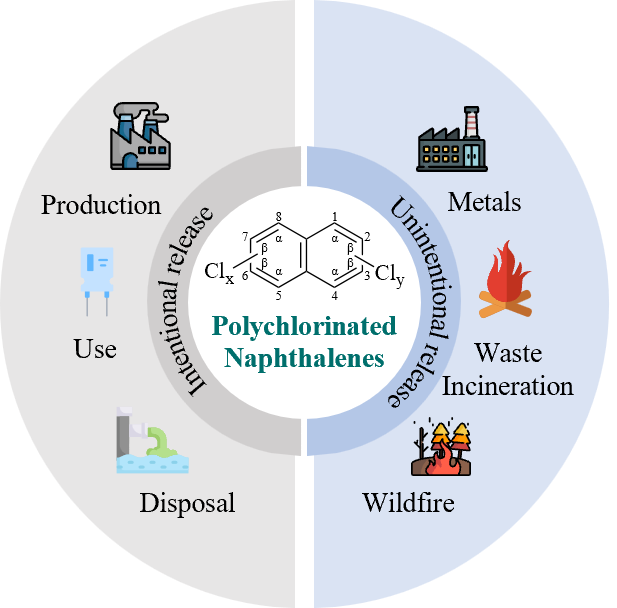
Polychlorinated naphthalenes (PCNs) are persistent organic compounds that are regulated by the Stockholm Convention. Because of their persistence and long-range transport, PCNs are widely distributed in the environment, even in the Tibetan Plateau and Arctic area. Historical manufacturing and unintentional release from human industrial activities are the two major sources of PCNs. Accurate characterization of PCNs is essential for the development of targeted pollution prevention strategies and effective reduction of their residual levels in the environment. In this paper we summarize the current status of emission studies on PCNs, including their emission sources, emission factors and progress in emission inventories. Historical emission studies show that PCN emissions are closely related to the industrialization process, with an increasing and then decreasing trend in most regions. Studies on unintentional emissions show that the emission factors of PCNs vary considerably between industries and processes and are strongly influenced by pollution control measures. Although some progress has been achieved, the systematic study of global emissions of PCNs is still inadequate, particularly in the determination of emission factors and the compilation of emission inventories. Future research is needed to further improve the emission inventory and strengthen monitoring and management to effectively control the environmental risks of PCNs.
Contents
1 Introduction
2 Properties of PCNs
2.1 Physicochemical properties of PCNs
2.2 Toxicity of PCNs
2.3 Environmental behavior of PCNs
3 Current status of global management policies for PCNs
4 Source of PCNs
5 Progress in the study of historical production and emission of PCNs
5.1 Estimation of historical production
5.2 Release of PCNs as historical chemicals
6 Unintentional emissions of PCNs
6.1 Emission factors for PCNs
6.2 Emission inventories of PCNs
7 Conclusion and outlook
Yuyan Luo , Guorui Liu . The Sources, Emission Characteristics, and Environmental Management of Polychlorinated Naphthalenes[J]. Progress in Chemistry, 2025 , 37(11) : 1704 -1718 . DOI: 10.7536/PC20250502
| CN groups | Boiling point/℃ | Melting point/℃ | Aqueous solubility/(μg/L) | log Kow | log Koa | log Kaw | KH/(Pa·m3/mol) | Atmospheric half-life/d |
|---|---|---|---|---|---|---|---|---|
| Mono-CN | 260 | -2.3~60 | 924~2870 | 3.93~3.97 | 5.93~6.02 | -2.05~-2.01 | 22.21~24.48 | 2 |
| Di-CN | 285~298 | 37~138 | 85~862 | 4.20~4.67 | 6.55~7.02 | -2.83~-1.93 | 3.67~29.15 | 5 |
| Tri-CN | 274 | 68~133 | 16.7~65 | 4.59~5.50 | 7.19~7.94 | -3.35~-1.68 | 1.11~51.24 | 10 |
| Tetra-CN | NA.a) | 111~198 | 3.7~8.3 | 5.14~6.10 | 7.88~8.79 | -3.54~-1.78 | 0.71~40.66 | 19 |
| Penta-CN | 313 | 147~171 | 7.3 | 5.67~6.49 | 8.79~9.40 | -3.73~-2.30 | 0.46~12.45 | 39 |
| Hexa-CN | 331 | 194 | 0.11 | 6.02~6.68 | 9.62~10.17 | -4.13~-3.04 | 0.19~2.27 | 79 |
| Hepta-CN | 348 | 194 | 0.04 | 6.48~6.57 | 10.68~10.81 | -4.34~-4.11 | 0.11~0.19 | 163 |
| Octa-CN | 365 | 198 | 0.08 | 6.43 | 11.64 | -5.21 | 0.02 | 343 |
a) N.A. = Not available. |
表2 不同国家PCNs制剂的历史生产情况[54]Table 2 The historical manufacture of PCN formulations in different countries[54] |
| Product name | Company | Country | Production |
|---|---|---|---|
| Halowax | Koppers | USA | major |
| N-Oil | Halochem | USA | major |
| N-Wax | Halochem | USA | major |
| Basileum | Desowag-Bayer | Germany | major |
| Nirben wax | I.G.Farbenindustrie/BayerLeverkusen | Germany | major |
| Perna wax | Chemische Fabrik Greisheim | Germany | |
| Naphthalin | Westeregeln | Germany | |
| Seekay wax | CI Runcorn | Great Britain | major |
| Clonacire wax | Prodelec | Paris, France | major |
| Cerifal Material | Caffaro | Italy | minor |
| Wako-PCN | Wako Chemicals | Japan | minor |
| Monochloronaphthalene | Wako Chemicals | Japan | |
| Hodogaya Amber wax | Hodogaya Chemical Co. Ltd. | Japan | |
| Nankai wax | Hodogaya Chemical Co. Ltd. | Japan | |
| Tokyo Ohka wax | Tokyo Ohka Kogyo Co. Ltd., Tokyo | Japan | |
| Woskol | Zakłady Azotowe | Poland | minor |
| Monochloronaphthalene | Zakłady Azotowe | Poland | |
| PCNs | Usolie-Sibirskoe | Russia | |
| Halowax | OOO Khimprom | Russia |
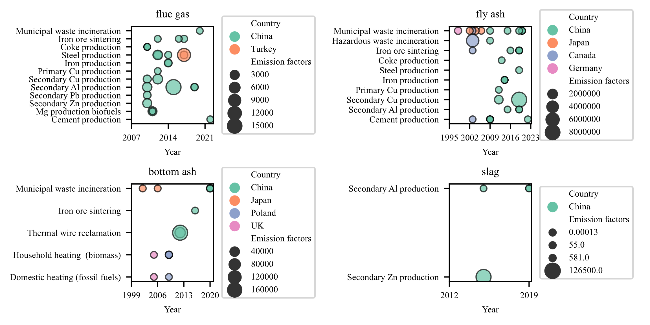
表3 PCNs排放因子Table 3 Emission factors of PCNs |
| Source | Release route | Year | Country | Process/fuel type | Homologues analysed (congeners) | Emission factors/(μg/t) (main homologues/ congeners) | Emission factors/(ng/t) (main homologues/ congeners) | Ref |
|---|---|---|---|---|---|---|---|---|
| PCBs (technical mixture) | - | - | - | - | 39 000 000~ 1 300 000 000 | - | 73-74,53 | |
| Chlorinated paraffins (product) | - | - | - | - | 40 000 000 | - | 53 | |
| Tetrachloromethane production | - | - | - | - | 3~8 | 4 750 000 (8, CN75) | 6 260 000 | 47 |
| Municipal waste incineration | flue gas | 2020 | China | ESP+WS+SCR/ CY+SDA+ACI+BH* | 1~8 (75) | 6.7~6.95 (1 / 2, CN1/CN2) | 0.79~1.45 (CN73/CN66/67) | 69 |
| fly ash | 2020 | China | ESP+WS+SCR | 1~8 (75) | 11 700 (6) | - | 69 | |
| 2020 | China | CY+SDA+ACI+BH | 1~8 (75) | 11 400 (2) | - | 69 | ||
| 2020 | China | SDS+AC+BF | 1~8 (75) | 2236.3 (1,3) | 250 | 100 | ||
| 2006 | Japan | BF+AC | 1~8 (75) | 960 (4, CN33/37) | - | 56 | ||
| 2004 | Japan | SDS+AC+BF | 1~7 (74) | 370 000 (1, CN1) | - | 78 | ||
| Municipal waste incineration | fly ash | 1998 | Germany | SDS+AC+BF | 1~8 (75) | 324 100 (5, CN52/60) | 86 680 (CN66/67) | 70 |
| bottom ash | 2020 | China | ESP+WS+SCR | 1~8 (75) | 730 (4) | - | 69 | |
| 2020 | China | CY+SDA+ACI+BH | 1~8 (75) | 6000 (4) | - | 69 | ||
| 2020 | China | SDS+AC+BF | 1~8 (75) | 810.5 (4) | 360 | 100 | ||
| 2006 | Japan | BF+AC | 1~8 (75) | 1700 (4, CN1) | - | 56 | ||
| Iron ore sintering | flue gas | 2017 | China | CC/ESP/GD+ESP | 1~8 (75) | 552(117~2910) (CN1,CN2) | 10.4(2.3~48.9) | 94 |
| fly ash | 2019 | China | Small-scale (< 90 m2) | 2~8 (74) | 31 250 (2) | 9032.5 | 99 | |
| 2019 | China | Medium-scale (90~180 m2) | 2~8 (74) | 19 000 (2) | 7285 | 99 | ||
| 2019 | China | Large-scale(> 180 m2) | 2~8 (74) | 10450 (2) | 5700 | 99 | ||
| Coke production | flue gas | 2010 | China | charging of coal (CC) and pushing of coke (PC) | 1~8 (75) | 50.3 | 1.2 | 83 |
| 2010 | China | CC | 1~8 (75) | 43.6 | 1.0 | 83 | ||
| 2010 | China | PC | 1~8 (75) | 6.7 | 0.2 | 83 | ||
| Iron production | flue gas | 2014 | China | Oxy. | 1~8 (75) | 229~759 (1, CN-1, CN-2, CN-5/7) | 0.3~1.5 | 89 |
| fly ash | 2019 | China | Oxy. | 1~8 (75) | 57000 (8) | 5120 | 96 | |
| flue gas | 2022 | China | Elec. | 1~8 (75) | - | 2.7~346.7 (5~7, CN66/67, CN2, CN10) | 102 | |
| 2017 | Turkey | Elec. (no pre-heating) | 3~8 (32) | 1300 (3, CN24/14) | - | 72 | ||
| 2017 | Turkey | Elec. (pre-heating) | 3~8 (32) | 11900 (3, CN24/14) | - | 72 | ||
| 2012 | China | Elec. (160 t/batch) | 1~8 (75) | 1970 (1) | 21.6 | 86 | ||
| 2012 | China | Elec. (60 t/batch) | 1~8 (75) | 4475 (3) | 30.1 | 86 | ||
| Steel production | flue gas | 2014 | China | BH | 2~8 (74) | 267 (2~3, CN3, CN14/26, CN25/13) | 17.8 (7, CN66/67, CN73) | 71 |
| 2014 | China | WS | 2~8 (74) | 1472 (2, CN11/8) | 26.8 (7, CN66/67) | 71 | ||
| fly ash | 2014 | China | BH | 2~8 (74) | 62.6 (10.3~108) (2, 3, CN23, CN5/7) | 3.4 (0.8~12.6) (7, CN66/67) | 71 | |
| 2014 | China | CY | 2~8 (74) | 61.1 (3, CN23) | 0.95 (7, CN73) | 71 | ||
| 2014 | China | WS | 2~8 (74) | 54 (3, CN23) | 0.8 (7, CN73) | 71 | ||
| 2014 | China | no APCS | 2~8 (74) | 54 (3, CN23) | 1.8 (7, CN73) | 71 | ||
| Secondary Cu production | flue gas | 2020 | China | converter furnace | 1~8 (25) | - | 12 (2, 4, CN1, CN10) | 5 |
| Secondary Cu production | flue gas | 2020 | China | converter furnace | 1~8 (25) | - | 10 (4, CN10, CN66/67) | 5 |
| 2020 | China | oxygen-enriched smelting furnace | 1~8 (25) | - | 78 (4, CN38/40) | 5 | ||
| 2020 | China | oxygen-enriched smelting furnace | 1~8 (25) | - | 90 (1, CN1) | 5 | ||
| 2020 | China | SDS+ACI+BH | 2, 4~8 | - | 7.8 (2, CN5/7) | 103 | ||
| 2020 | China | CY+SCC+QT+ACI+WS | 2, 4~8 | - | 3120 (2, CN10) | 103 | ||
| Secondary Al production | flue gas | 2019 | China | 300 000t | 1~8 | 300 (2,3) | 0.000 006 (6) | 97 |
| 2019 | China | 600 000t | 1~8 | 930 (2,3) | 0.000 005 (6) | 97 | ||
| fly ash | 2019 | China | 300 000t | 1~8 | 28 (5) | 11 | 97 | |
| 2019 | China | 600 000t | 1~8 | 45 700 (6) | 53100 | 97 | ||
| slag | 2019 | China | 300 000t | 1~8 | 55 (3) | 50 | 97 | |
| 2019 | China | 600 000t | 1~8 | 581 (3) | 1 | 97 | ||
| Secondary Pb production | flue gas | 2020 | China | EP+GS+BH | 1~8 (25) | - | 20 (4, CN1) | 5 |
| 2020 | China | BH | 1~8 (25) | - | 31 (4, CN1) | 5 | ||
| Secondary Zn production | flue gas | 2020 | China | GS+BH | 1~8 (25) | - | 510 (2, CN4) | 5 |
| 2020 | China | EP+BH | 1~8 (25) | - | 400 (2, CN4) | 5 | ||
| Mg production | flue gas | 2011 | China | oxidation stage | 1~8 | 3319 (1~3) | 32 (CN-1, CN-2, CN-66/67, CN-73) | 84 |
| 2011 | China | reduction stage | 1~8 | 9 (3~5) | 0.1 (CN-66/67, CN-73) | 84 | ||
| Thermal wire reclamation | residual ash | 2012 | China | waste electronic motors | 1~8 | 66000 (4) | - | 87 |
| 2012 | China | waste enameled wires | 1~8 | 195000 (3) | - | 87 | ||
| Household heating (biomass) | bottom ash | 2009 | Poland | coke | 2~8 | 8300 (3, CN14/21/24) | - | 81 |
| 2009 | Poland | wood | 2~8 | 7600 (3, CN22/23) | - | 81 | ||
| 2009 | Poland | waste | 2~8 | 6000 (3, CN14/21/24) | - | 81 | ||
| 2005 | UK | hardwood | 3~8 | 120 (3, CN24) | 2 (4, CN38/40) | 79 | ||
| Domestic heating (fossil fuels) | bottom ash | 2009 | Poland | coal | 2~8 | 240-260 (3, CN5, CN14/21/24) | - | 81 |
| 2005 | UK | housecoal | 3~8 | 680 (3, CN24) | 9 (4, CN38/40) | 79 | ||
| Cement production | fly ash | 2009 | China | Dry-process rotary kiln+ESP | 4~8 | 1042 (4) | 2800 (CN66/67) | 80 |
| 2009 | China | Wet-process rotary kiln+ESP | 4~8 | 2032 (4,6) | 760 (CN66/67) | 80 | ||
| 2009 | China | Shaft kiln+BH | 4~8 | 3514~8430 (4) | 470~900 (CN66/67) | 80 |
*ESP is electrostatic precipitator; WS is wet scrubber; SCR is selective catalytic reduction; CY is cyclone; SDA is semi-dry absorber; ACI is activated carbon injection; BH is baghouse; SDS is semi-dry scrubber; AC is activated carbon; GD is gas desulfurization system; APCS is air pollution control system; SCC is secondary combustion chamber; QT is quench tower; GS is gravity settling; Oxy. is oxygen blown converter; Elec. is electric arc furnace. Emission factors for fly ash and bottom ash are the concentrations in ash, which correspond to the activity level for ash fly/bottom |
| [1] |
|
| [2] |
|
| [3] |
UNEP. Report of the conference of the Parties to the Stockholm Convention on persistent organic pollutants on the work of its seventh meeting. SC-7/14: Listing of polychlorinated naphthalenes.: UNEP/POPS/COP.7/36., 2015.
|
| [4] |
|
| [5] |
|
| [6] |
|
| [7] |
|
| [8] |
|
| [9] |
|
| [10] |
|
| [11] |
|
| [12] |
|
| [13] |
|
| [14] |
|
| [15] |
|
| [16] |
|
| [17] |
UNEP. Risk profile on chlorinated naphthalenes: UNEP/POPS/POPRC.8/16/Add.1. 2012.
|
| [18] |
Concise International Chemical Assessment Document No. Chlorinated Naphthalenes. Ed.: IPCS. Geneva: World health organization, 2001.
|
| [19] |
ECCC. Screening assessment report for chlorinated naphthalenes. Environment and Climate Change Canada, 2009.
|
| [20] |
|
| [21] |
|
| [22] |
|
| [23] |
|
| [24] |
|
| [25] |
|
| [26] |
|
| [27] |
|
| [28] |
|
| [29] |
|
| [30] |
|
| [31] |
|
| [32] |
|
| [33] |
UNEP. Basel convention on the control of transboundary movements of hazardous wastes and their disposal. 2011.
|
| [34] |
|
| [35] |
UNECE. Decision 2009/2 on the Listing of short-chain chlorinated paraffins and polychlorinated naphthalenes in annexes I and II to the 1998 Protocol on Persistent Organic Pollutants: ECE/EB.AIR/99/ADD.1. United Nations Economic Commission for Europe, 2009.
|
| [36] |
|
| [37] |
EU. Commission Regulation (EU) No 519/2012 of 19 June 2012 amending Regulation (EC) No 850/2004 of the European Parliament and of the Council on persistent organic pollutants as regards Annex I. 2012.
|
| [38] |
EU. Commission Regulation (EU) No 1342/2014 - of 17 December 2014 - amending Regulation (EC) No 850/2004 of the European Parliament and of the Council on persistent organic pollutants as regards Annexes IV and V. EU Codex: EU 1342/2014. 2014: L 363/67-L 363/74.
|
| [39] |
EU. Regulation (EU) 2019/1021 of the European Parliament and of the Council - of 20 June 2019 - on persistent organic pollutants. EU Codex: EU 2019/1021. 2019: L 169/45-L 169/77.
|
| [40] |
UNEP. Risk management evaluation on chlorinated naphthalenes: UNEP/POPS/POPRC.9/13/Add.1. Rome, 2013: 19.
|
| [41] |
Ministry of Ecology and Environment of the People's Republic of China. Announcement on the Environmental Risk Control Requirements for Five Types of Persistent Organic Pollutants, Including Polychlorinated Naphthalenes. 2023
(中华人民共和国生态环境部. 关于多氯萘等5种类持久性有机污染物环境风险管控要求的公告. 2023).
|
| [42] |
|
| [43] |
|
| [44] |
|
| [45] |
|
| [46] |
|
| [47] |
|
| [48] |
|
| [49] |
|
| [50] |
EPA.Environmental monitoring near industrial sites: Polychloronaphthalenes: EPA-560/6-77-019 1997/6. United States Environmental Protection Agency, 1997.
|
| [51] |
AMAP. AMAP Assessment 2002: The Influence of Global Change on Contaminant Pathways to, within, and from the Arctic. Ed.: Jensson H. Oslo: AMAP Arctic Monitoring and Assessment Programme, 2003.
|
| [52] |
|
| [53] |
UNEP. Guidance on preparing inventories of polychlorinated naphthalenes (PCNs). Geneva, Switzerland: Secretariat of the Basel, Rotterdam and Stockholm Conventions, United Nations Environment Programme, 2021: 36.
|
| [54] |
Global Contamination Trends of Persistent Organic Chemicals. Eds.: Loganathan B G, Lam P K S. CRC Press, 2011.
|
| [55] |
EPA. Environmental hazard assessment report: Chlorinated naphthalenes: EPA-560/8-75-001 1975/12. United States Environmental Protection Agency, 1975.
|
| [56] |
|
| [57] |
UNEP. Draft guidance on preparing inventories of polychlorinated naphthalenes (PCNs): UNEP/POPS/COP.8/INF/19. Geneva: United Nations Environment Programme, 2017: 74.
|
| [58] |
|
| [59] |
|
| [60] |
|
| [61] |
(潘静, 杨永亮, 杨伟贤, 路国慧, 谷保佐知, 山下信义. 环境科学学报, 2011, 31(4): 816).
|
| [62] |
|
| [63] |
|
| [64] |
|
| [65] |
|
| [66] |
|
| [67] |
(黄浩瑜, 高艳珊, 王强. 能源环境保护, 2023, 37(3): 204).
|
| [68] |
|
| [69] |
|
| [70] |
|
| [71] |
|
| [72] |
|
| [73] |
|
| [74] |
|
| [75] |
Ministry of Ecology and Environment of the People's Republic of China. Manual on Production and Emission Accounting Methods and Coefficients for Statistical Survey of Emission Sources. 2021
(中华人民共和国生态环境部. 排放源统计调查产排污核算方法和系数手册. 2021).
|
| [76] |
|
| [77] |
|
| [78] |
|
| [79] |
|
| [80] |
(张婧, 倪余文, 张海军, 张雪萍, 张青, 陈吉平. 环境科学, 2009, 30(2): 568).
|
| [81] |
|
| [82] |
|
| [83] |
|
| [84] |
|
| [85] |
|
| [86] |
|
| [87] |
|
| [88] |
|
| [89] |
|
| [90] |
(刘国卿, 刘德华, 周志华. 深圳大学学报(理工版), 2015, 32(4): 398).
|
| [91] |
|
| [92] |
|
| [93] |
|
| [94] |
|
| [95] |
|
| [96] |
|
| [97] |
|
| [98] |
|
| [99] |
|
| [100] |
|
| [101] |
|
| [102] |
(杨莉莉, 申佳, 刘国瑞, 赵晓光, 郑明辉. 科学通报, 2022, 67(3): 278).
|
| [103] |
|
| [104] |
|
| [105] |
|
| [106] |
|
/
| 〈 |
|
〉 |

