Metal-Support Interactions for Electrocatalytic Water Splitting
Received date: 2026-01-14
Revised date: 2026-03-18
Online published: 2026-03-20
Supported by
program for Strong Youth Technology Leading Talents(2023CB-11)
National Natural Science Foundation of China(52302105)
Metal-support interactions (MSIs) strategy play a critical role in designing and optimizing water-splitting catalysts. This review constructs a comprehensive framework for MSIs research, spanning from theoretical foundations to water-splitting applications. The fundamental concepts and historical evolution of MSIs are clarified, together with a taxonomic classification based on their physicochemical nature. On this basis, it delves into the formation mechanisms of various MSIs and systematically summarizes advanced characterization techniques used to analyze their electronic structures and interfacial properties. This review further explores how support properties, metal morphology, and preparation conditions collectively determine the strength and interaction mode of MSIs. A dedicated section introduces enhancement strategies, summarizing recent approaches for strengthening MSIs effects through defect engineering, interfacial design, and dynamic regulation. The applications of MSIs regulation in hydrogen evolution reaction (HER), oxygen evolution reaction (OER), and overall water splitting systems (OWS) are comprehensively discussed, along with the corresponding activity-enhancement mechanisms. It also outlines the challenges and future development directions in this field concerning atom-level precision control, operational condition characterization, and large-scale application.
1 Introduction
2 The formation and classification of MSIs
2.1 The formation of MSIs
2.2 The classification of MSIs
3 Characterization of MSIs
3.1 XANES
3.2 AC-TEM
3.3 Density functional theory of MSIs
3.4 Others
4 The formation and influencing factors of MSIs
4.1 Support
4.2 Metal
4.3 Interface temperature effect
5 Application of MSIs in HER and OER
5.1 HER
5.2 OER
6 Summary and outlook
6.1 Summary
6.2 Outlook
Key words: metal-support interactions; water electrolysis; catalysis
Aojie Yuan , Huan Liu , Danyang Hu , Lin Lan , Long Chen . Metal-Support Interactions for Electrocatalytic Water Splitting[J]. Progress in Chemistry, 2026 , 38(3) : 443 -464 . DOI: 10.7536/PC20260112
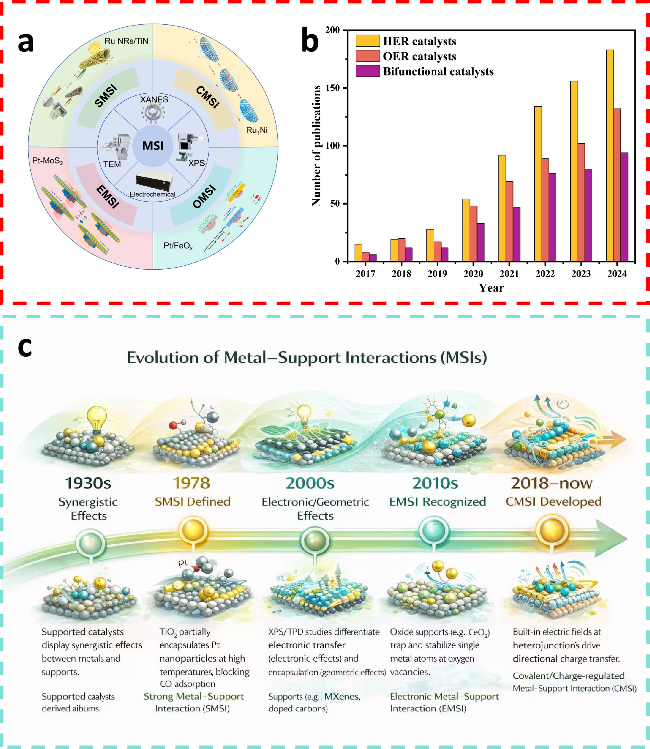
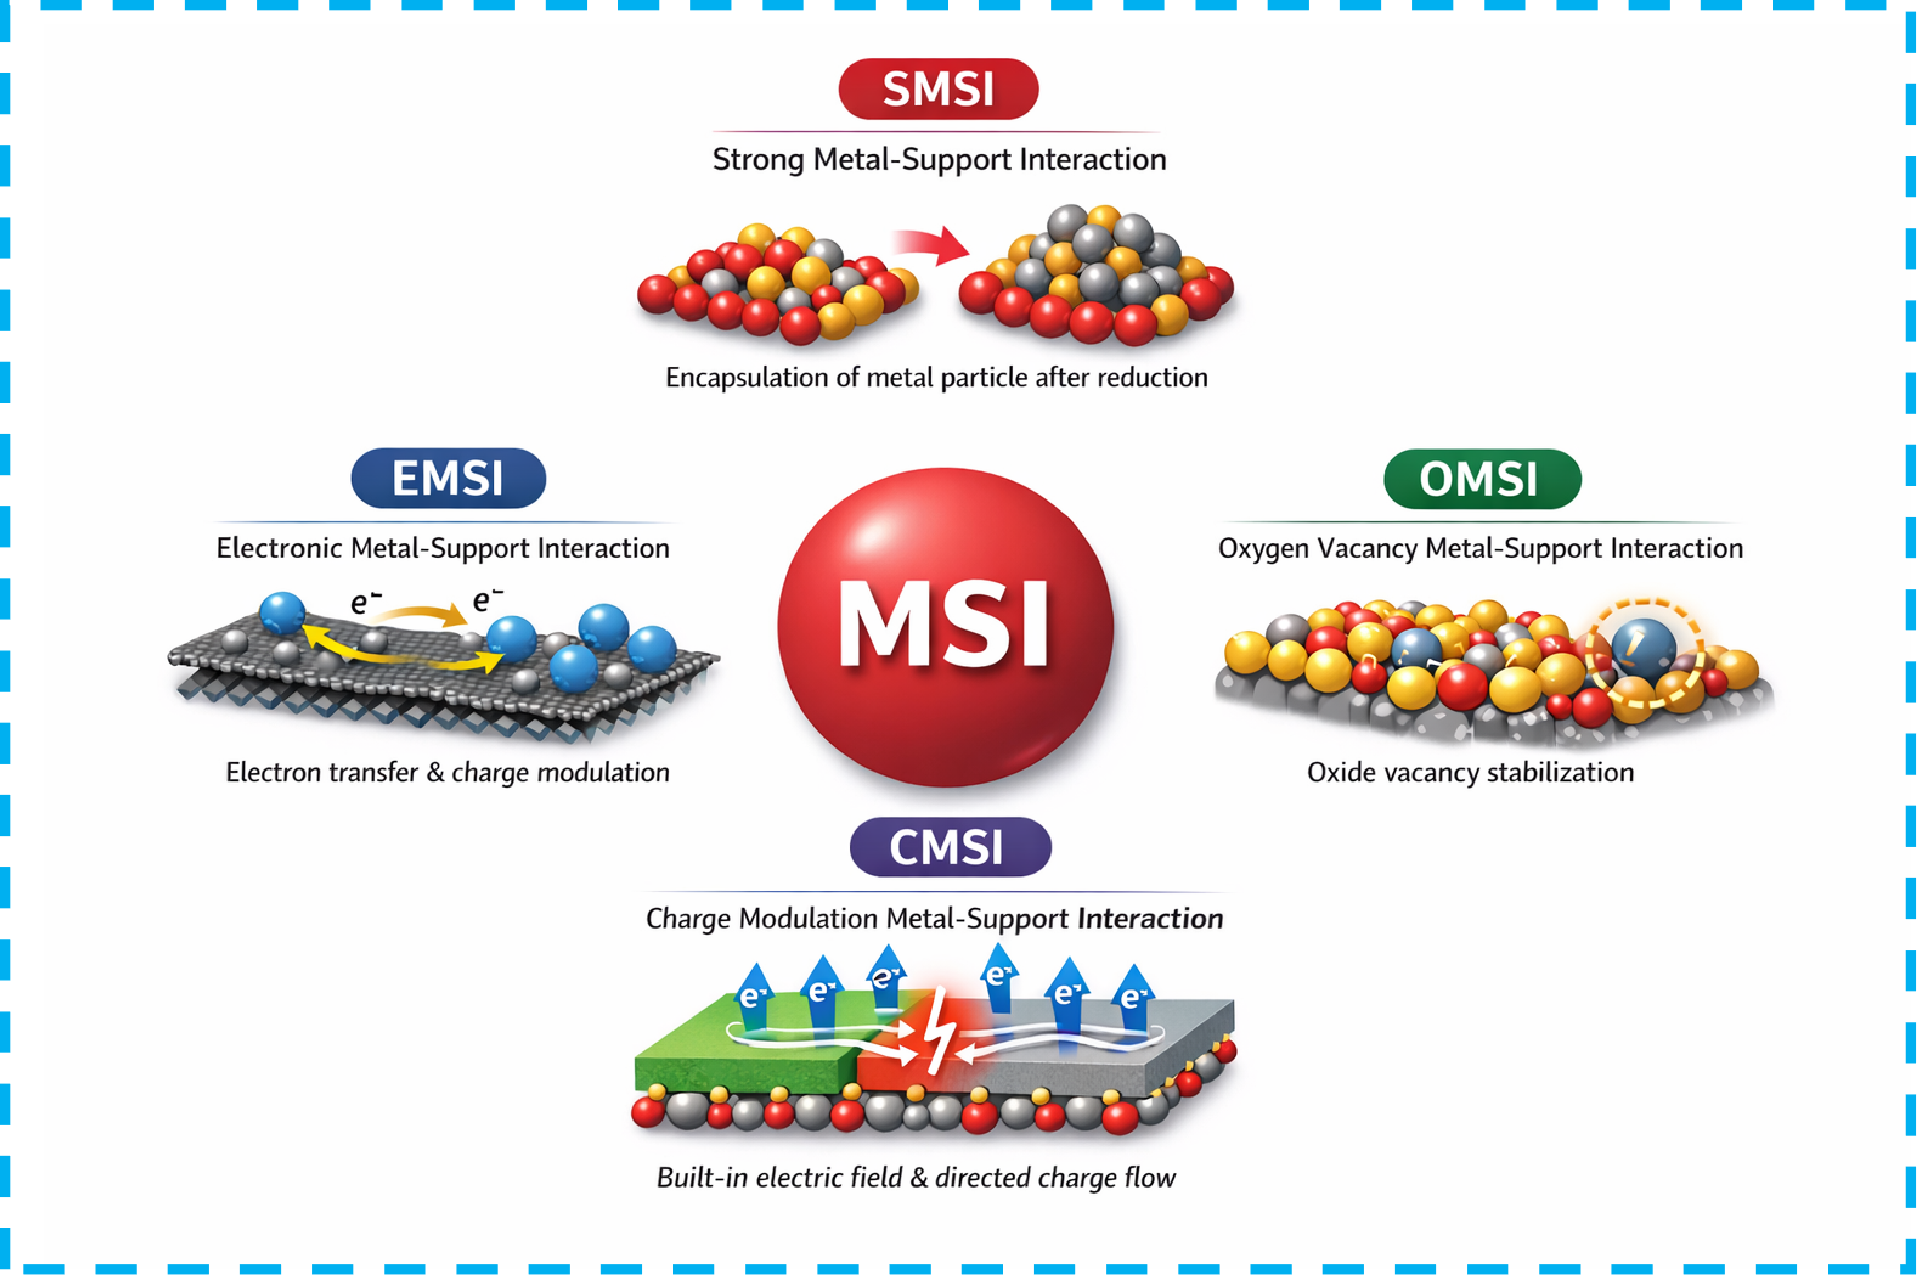
图1 (a) MSIs的表征及其主要分类;(b) 关于MSIs在电催化领域的已发表论文数量 (数据来源:Web of Science,检索日期:2025年10月18日);(c) MSIs的发展Fig.1 (a) The characterization of MSIs and its main classification. (b) The number of published research articles for the MSIs in catalysis fields (data source: Web of Science, retrieved: October 18, 2025). (c) Development of MSIs |
表1 不同催化剂在MSIs作用下的催化性能比较[19]Table 1 Comparison of catalytic performances of various catalysts under the action of MSIs[19]. Copyright, 2023, Royal Society of Chemistry |
| Types of MSI | Catalyst | Applications | Methods | Work Conditions | Performances |
|---|---|---|---|---|---|
| CMSI | Pt-TiN(C) | HER | Gas-phase synthesis | 0.5 mol/L H2SO4 | 31 mV@10 mA/cm2 |
| CMSI | W/PdGa | HER | Hydrothermal and calcination | 0.5 mol/L H2SO4 | 42 mV@10 mA/cm2 |
| CMSI | RuMo2C@CNT | HER | Solid-phase microwave pyrolysis | 0.1 mol/L KOH | 15 mV@10 mA/cm2 |
| CMSI | IrRu/T90G10 | OER | Ultrasonic spray pyrolysis | 0.1 mol/L HClO4 | 54 mV@10 mA/cm2 |
| CMSI | 11.0 wt%Ir/ATO | OER | Delignin-impregnation-carbonization | 0.1 mol/L KOH | 300 mV@10 mA/cm² E1/2=0.82V |
| CMSI | HsGDY/Cu3Pd-750 | ORR | In situ growth | 1.0 mol/L KOH | 0.870 V@57.7mA/cm2 |
| CMSI | PB@Met-700 | ORR | Pyrolysis | 0.1 mol/L KOH | E1/2=0.855V |
| CMSI | Pt/MFO/NPC | ORR | Solvothermal method | 0.1 mol/L KOH | E1/2=0.835V |
| CMSI | PTO-Vo-H/C | ORR | Hydrothermal and atomic layer deposition (ALD) | 0.1 mol/L HClO4 | E1/2=0.87V |
| CMSI | Pt/TiO2@CNT | ORR | a sol-gel process | 0.1 mol/L HClO4 | E1/2=0.927V |
| CMSI | SACs of Rh1-TiC | HER | Wetness impregnation | 0.5 mol/L H2SO4 | 22 mV@10 mA/cm2 |
| EMSI | PtNP/MHCS | HER | Pre-precipitation | 0.5 mol/L H2SO4 | 40 mV@10 mA/cm2 |
| EMSI | NiMo/Ti3C2Tx | HER | A wet chemical method | 1.0 mol/L KOH | HER current density of 10 mA/cm2@0.044 V |
| HOR | HOR current density of 1.5 mA/cm2@0.1V | ||||
| EMSI | NiFe-MS/MOF@NF | OER | A simple one-step solvothermal reaction | 1.0 mol/L KOH | 230 mV@50 mA/cm2 |
| HER | 156 mV@50 mA/cm2 |
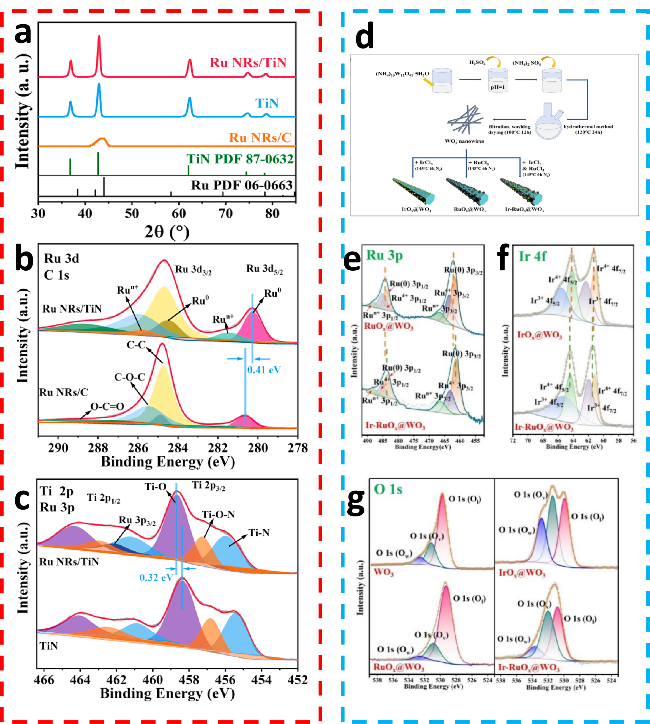
图2 (a) Ru NRs/TiN催化剂的XRD图谱;(b) Ru NRs/TiN和Ru NRs/C的Ru 3p XPS谱图;(c) Ru NRs/TiN和TiN的Ti 2p XPS谱图[23]; (d) WO3纳米线、IrOx@WO3、RuOx@WO3和 Ir-RuOx@WO3的合成过程,IrOx@WO3、RuOx@WO3和Ir-RuOx@WO3的(e) Ru 3p、(f) Ir 4f及(g) O 1s高分辨XPS谱图[8]Fig.2 (a) XRD patterns of Ru NRs/TiN catalyst. (b) Ru 3p XPS spectra of Ru NRs/TiN and Ru NRs/C. (c) Ti 2p XPS spectrum of Ru NRs/TiN and TiN[23]. Copyright, 2022, Elsevier. (d) Schematic diagram describes the synthesis of WO3 nanowires, IrOx@WO3, RuOx@WO3, and Ir-RuOx@WO3. High-resolution XPS spectra of (e) Ru 3p, (f) Ir 4f, and (g) O 1s of IrOx@WO3, RuOx@WO3 and Ir-RuOx@WO3[8].Copyright, 2024, American Chemical Society |
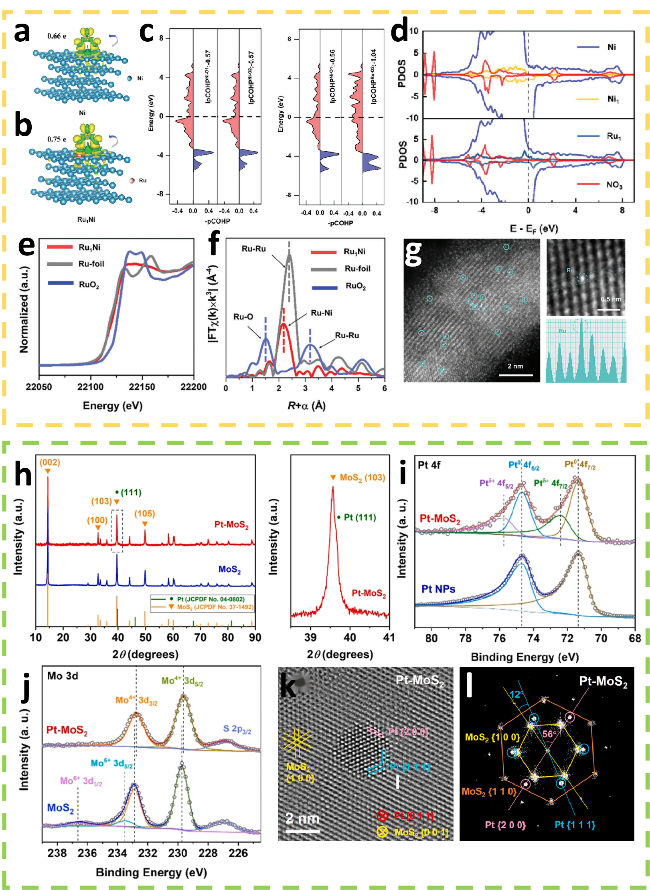
图3 (a) 和(b) 分别显示了NO3-在Ni和Ru1Ni表面吸附前后巴德电荷分析及电荷密度差,黄色和绿色分别代表电荷积累和电荷耗尽;(c) Ni、Ru原子与吸附NO3-中的O原子之间的投影轨道哈密顿布局。蓝色和红色分别代表成键态和反键态;(d) NO3-吸附在Ni和Ru1Ni催化剂上的PDOS图;(e) Ru1Ni SAA、Ru标样和RuO2的XANES光谱;(f) Ru1Ni SAA、Ru标样和RuO2的的EXAFS光谱;(g) Ru1Ni SAA的AC-HAADF-STEM图像[40];(h) Pt-MoS2和MoS2的XRD谱图;(i) Pt-MoS2和纯MoS2的Mo 3d能级的XPS谱图;(j) Pt-MoS2和Pt纳米颗粒的XPS谱图;(k) HRTEM图像;(l) 傅里叶变换图像[41]Fig.3 (a) and (b) is Barder charge analysis and charge density difference before and after adsorption of NO3- on Ni and Ru1Ni surfaces, where yellow and green represent the charge accumulation and depletion. (c) The -pCOHP between Ni, Ru atoms, and O atoms of adsorbed NO3-. The blue and red represent the bonding and antibonding states, respectively. (d) The PDOS plots of NO3- adsorption on Ni and Ru1Ni catalysts. (e) Normalized XANES spectra of Ru1Ni SAA, Ru foil, and RuO2. (f) EXAFS spectra of Ru1Ni SAA, Ru-foil and RuO2. (g) AC-HAADF-STEM image of Ru1Ni SAA[40]. Copyright, 2024, Wiley. (h) XRD spectra of the Pt-MoS2 and MoS2. (i) XPS spectra of Pt-MoS2 and pure MoS2. (j) XPS spectra of Pt-MoS2 and Pt nanoparticles. (k) HRTEM image. (l) FFT image[41]. Copyright, 2021, Elsevier. |
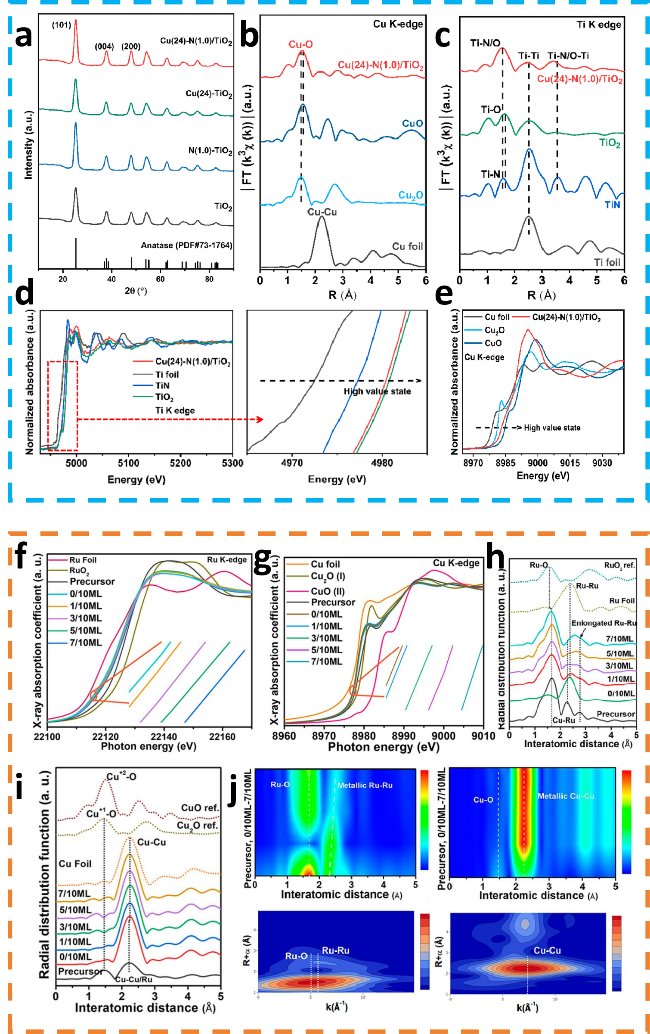
图4 (a) TiO2、N(1.0)/TiO2、Cu(24)-TiO2和Cu(24)-N(1.0)/TiO2的XRD谱图;(b) Cu(24)-N(1.0)/TiO2、CuO、Cu2O和Cu标样的EXAFS谱图;(c) Cu(24)-N(1.0)/TiO2、TiN、Ti标样和TiO2的EXAFS谱图;(d) Cu(24)-N(1.0)/TiO2、Ti标样、TiN和TiO2的Ti的XANES谱图;(e) Cu(24)-N(1.0)/TiO2、CuO、Cu2O和Cu标样的XANES谱图[52];(f) 和(g) 是所有催化剂与标准样品的XANES谱图; 所有催化剂中Cu (h) 和Ru (i) 的EXAFS光谱(含标准参考物),以及(j) 5/10 ML催化剂中Ru和Cu的WT-EXAFS的二维等高线图[53]Fig.4 (a) XRD spectra of TiO2, N(1.0)/TiO2, Cu(24)-TiO2 and Cu(24)-N(1.0)/TiO2. (b) EXAFS spectra of Cu(24)-N(1.0)/TiO2, CuO, Cu2O and Cu foil. (c) EXAFS spectra of Cu(24)-N(1.0)/TiO2, TiN, Ti foil and TiO2. (d) XANES spectra of Cu(24)-N(1.0)/TiO2, Ti foil, TiN and TiO2. (e) XANES spectra of Cu(24)-N(1.0)/TiO2, CuO, Cu2O and Cu foil[52]. Copyright, 2024, Elsevier. (f) and (g) XANES spectra of all catalysts. Insets in f and g are the magnified views of the selected XANES region. EXAFS spectra of Cu (h) and Ru (i) of all catalysts with standard references, and corresponding 2-dimensional contour map (j) WT-EXAFS of Ru and Cu in a 5/10 ML catalyst[53]. Copyright, 2023, American Chemical Society. |
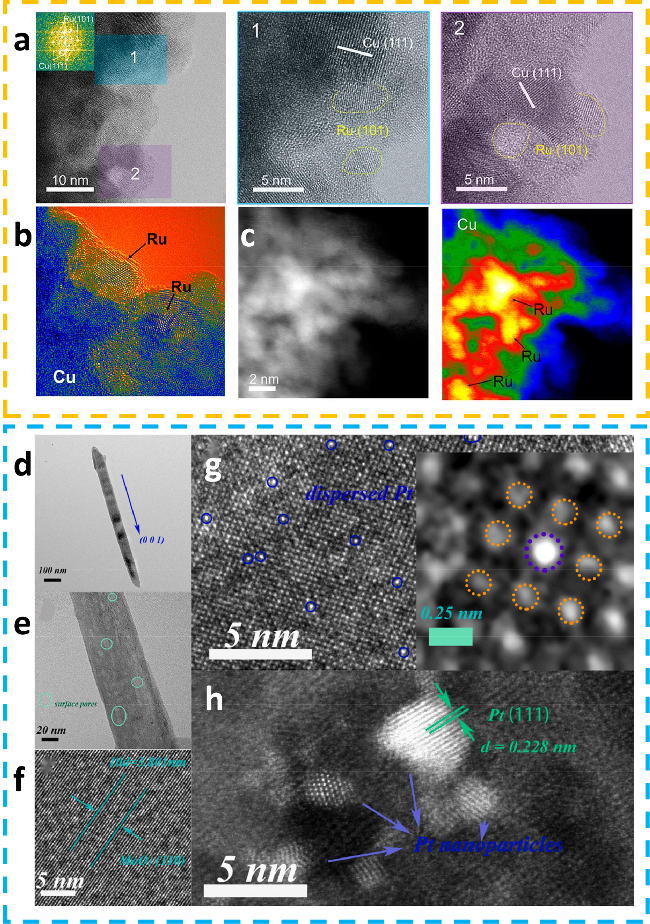
图5 (a) Ru-Cu的HRTEM图像;(b) 5/10 ML的HRTEM图像得到的相应渲染图;(c) Ru-Cu的HAADF-STEM图像及相应的渲染图[53];(d) 和(e) 为0.1 Pt掺杂MoO3的TEM图像;(f) 0.1 Pt掺杂MoO3的HRTEM图像;(g) 和(h) 分别为0.1 Pt掺杂MoO3和1.0 Pt掺杂MoO3的HAADF-STEM图像[55]Fig.5 (a) HRTEM images of Ru-Cu. (b) Rendered images derived from the of 5/10 ML HRTEM image. (c) HAADF-STEM and corresponding rendered images of Ru-Cu[53]. Copyright, 2023, American Chemical Society. (d) and (e) is the TEM characterization of 0.1Pt doped MoO3. (f) HRTEM image of 0.1Pt doped MoO3. (g) and (h) the aberration-corrected HAADF-STEM images of 0.1Pt doped MoO3 and 1.0Pt doped MoO3[55]. Copyright, 2022, Elsevier. |
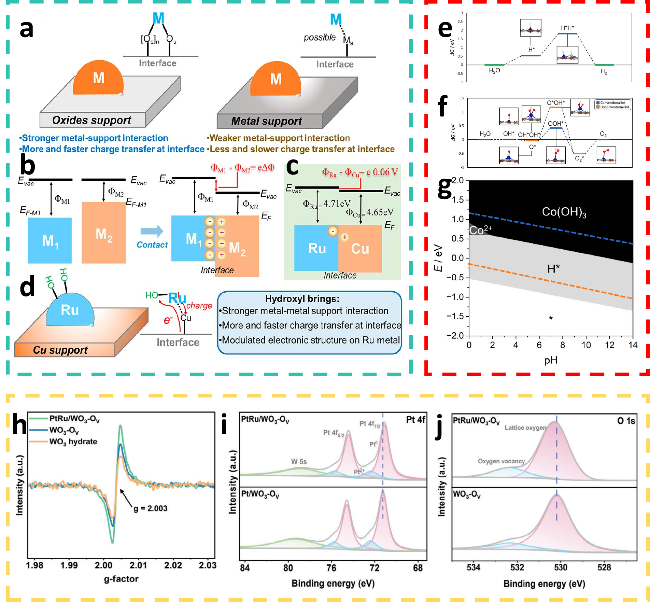
图6 (a) 金属-氧化物支撑体与金属-金属支撑体相互作用及键合特性示意图;(b) 关于金属1-金属2 (M1-M2) 支撑体相互作用起源及相关接触电位的根本观点,Evac为真空能,EF-M1为M1的费米能级,EF-M2为M2的费米能级,ΦM1 为M1的功函数,ΦM2为M2的功函数;(c) Ru与Cu之间的理论接触电位仅为0.06 V;(d) HO-修饰对Ru-Cu催化剂所产生优势的示意图[53]; (e) Co@4 N-掺杂石墨烯/MoS2的(f) OER和(g) HER吉布斯自由能图及稳定性图[57];(h) 制备样品的EPR信号;(i) Pt 4f,(j) O 1s的XPS光谱[58]Fig.6 (a) Diagram describing the interaction and bonding properties of the metal-oxide support and metal-metal support. (b) The fundamental viewpoint of metal1-metal2 (M1-M2) supports the interaction origin and related contact potential. Evac is the vacuum energy, EF‑M1 is the Fermi level of M1, EF‑M2 is the Fermi Level of M2, ΦM1 is the work function of M1, and ΦM2 is the work function of M2. (c) Theoretical contact potential between ruthenium (Ru) and copper (Cu) is only e0.06 V. (d) Schematic illustrations of advantages induced by hydroxyl (HO-) modification for Ru-Cu catalysts[53]. Copyright, 2023, American Chemical Society. (e) HER and (f) OER Gibbs free energy diagrams and (g) stability diagram for Co@4 N-doped graphene/MoS2[57]. Copyright, 2025, Elsevier. (h) EPR signals of the prepared samples. XPS spectra of the prepared samples: (i) Pt 4f, and (j) O 1s[58]. Copyright, 2024, Wiley. |
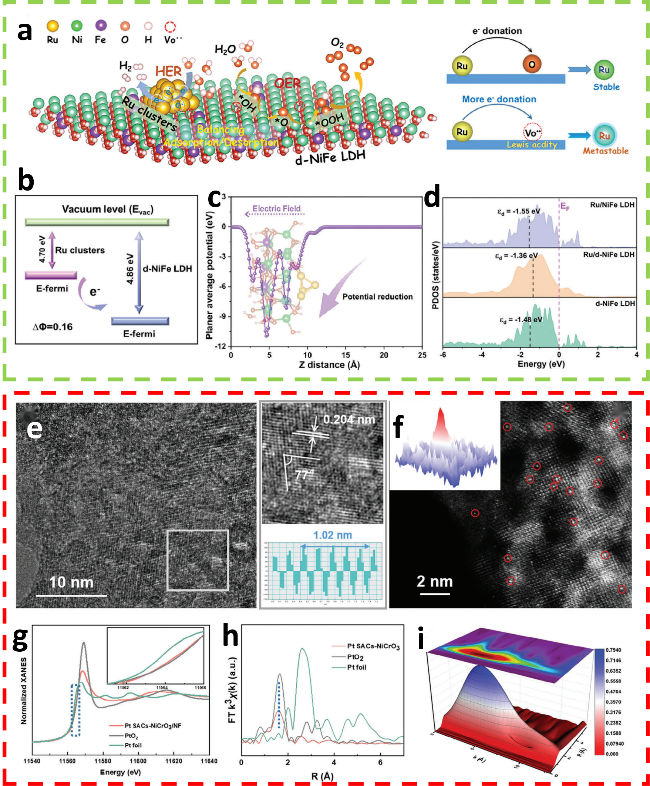
图7 (a) 受界面Vo••影响的Ru位点亚稳态化机理示意图;(b) Ru团簇与d-NiFe LDH之间的功函数;(c) 沿Z方向的平面平均电位;(d) Ru/NiFe LDH、Ru/d-NiFe LDH和d-NiFe LDH中Ni 3d轨道的PDOS[58]; (e) Pt SACs-NiCrO3/NF的TEM图像;(f) Pt SACs-NiCrO3/NF的AC-HAADF-STEM图像;(g) Pt SACs-NiCrO3/NF、PtO2和Pt标样的归一化Pt K边XANES谱图;(h) Pt SACs-NiCrO3/NF、PtO2 和Pt标样的k3加权FT-EXAFS光谱;(i) Pt SACs-NiCrO3/NF的k3加权 EXAFS 信号的小波变换[37]Fig.7 (a) Schematic diagram of the interfacial Vo•• affected Ru site metastablization mechanism. (b) The work function between the Ru clusters and d-NiFe LDH. (c) Planar average potential along the Z-direction. (d) PDOS of Ni 3d orbits of Ru/NiFe LDH, Ru/d-NiFe LDH, and d-NiFeLDH[58]. Copyright, 2024, Wiley. (e) TEM images of Pt SACs-NiCrO3/NF. (f) AC-HAADF-STEM images of Pt SACs-NiCrO3/NF. (g) Normalized Pt K-edge XANES of Pt SACs-NiCrO3/NF, PtO2 and Pt foil, respectively. (h) The k3-weighted FT-EXAFS spectra of Pt SACs-NiCrO3/NF, PtO2 and Pt foil. (i) Wavelet transform for k3-weighted EXAFS signal of Pt SACs-NiCrO3/NF[37]. Copyright, 2024, Wiley. |
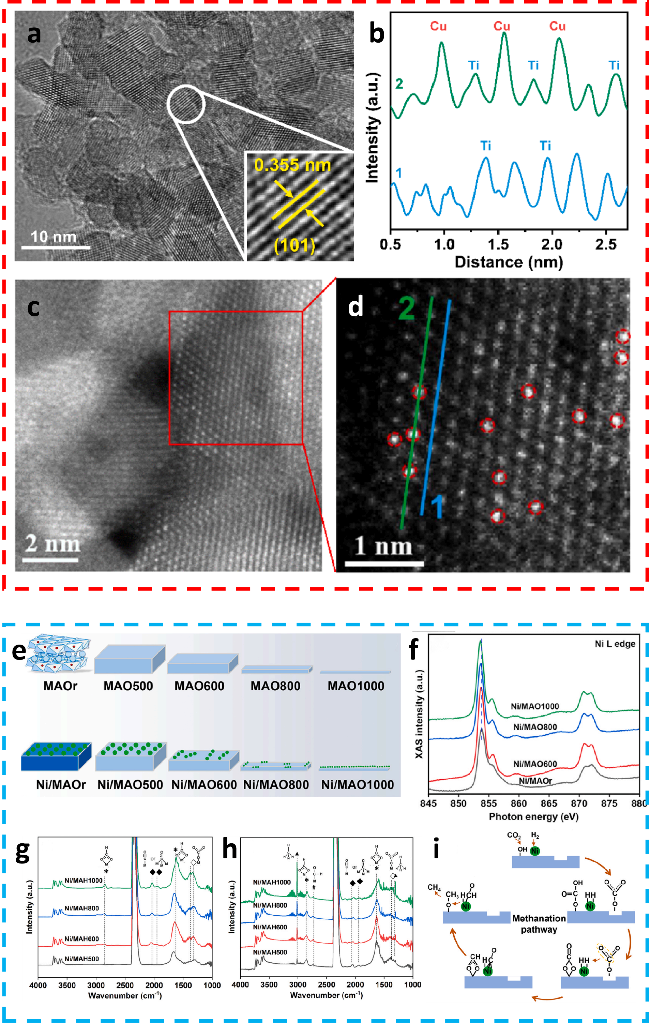
图8 (a) Cu(24)-N(1.0)/TiO2的HRTEM图像;(b) 图(d)中标记的晶格条纹的线扫描原子强度分布图;(c) Cu(24)-N(1.0)/TiO2的AC-HAADF-TEM图像;(d) 经高斯滤波降噪处理的Cu(24)-N(1.0)/TiO2图像[24];(e) MAOs及Ni/MAO催化剂的形成路径;(f) Ni/MAO催化剂的Ni L边光谱;(g) 和 (h) Ni/MAO1000上CO2吸附和CO2甲烷化的原位DRIFT谱;(i) Ni/MAO催化剂上CO2甲烷化的反应机理[69]Fig.8 (a) HRTEM images of Cu(24)-N(1.0)/TiO2. (b) the line scan atomic intensity profiles of lattic fringes marked in (d). (c) raw AC-HAADF-TEM images. (d) the corresponding noise reduction images by Gaussian filter of Cu(24)-N(1.0)/TiO2[52]. Copyright, 2024, Elsevier. (e) The formation pathway of MAOs and Ni/MAO catalysts. (f) Ni L-edge spectra of Ni/MAO catalysts. (g) and (h) In situ DRIFT spectra of CO2 adsorption and CO2 methanation over Ni/MAO1000. (i) Proposed mechanism of CO2 methanation over Ni/MAO catalysts[69]. Copyright, 2023, Elsevier. |
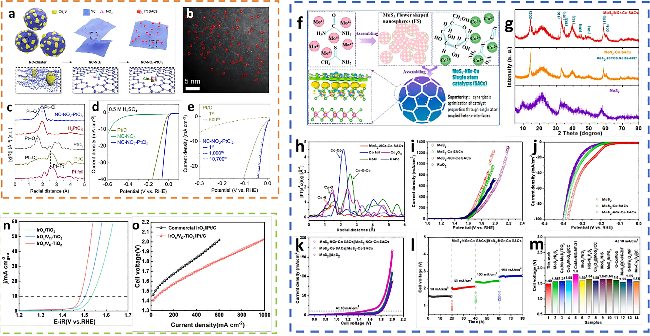
图9 (a) NC-NO2-PtCl2的制备过程;(b) NC-NO2-PtCl2的STEM图像;(c) Pt标样、Pt/C、PtO2、H2PtCl6和NC-NO2-PtCl2在R空间k²加权的FT-EXAFS光谱; (d) LSV曲线;(e) Pt/C与NC-NO2-PtCl2的循环LSV稳定性对比[71];(f) MoS2-NGr-Co SACs的合成流程图;(g) MoS2-NGr-Co SACs、MoS2-Co SACs及MoS2催化剂的XRD图;(h) MoS2-NGr-Co SACs及 Co 标样、Co3O4、CoO 和 CoPc 参比样品的FT-EXAFS谱图, MoS2-NGr-Co SACs、MoS2-Co SACs 和 MoS2FS的(i) OER极化曲线;(j) HER极化曲线;(k) 电极极化曲线;(l) 不同电流密度下MoS2-NGr-Co SACs电极的电化学稳定性分析;(m) 催化剂MoS2-NGr-Co SACs在10 mA/cm2时的电压与典型文献报道值的比较[57];(n) LSV曲线(电流值按几何面积归一化);(o) 80 ℃下IrOx/VO-TiO2和商用TiO2阳极的PEM电解槽的极化曲线[1]Fig.9 (a) Illustration showing the fabrication process of NC-NO2-PtCl2, starting from the NC-cluster and converting it into NC-NO2 and NC-NO2-PtCl2. Dashed areas in NC-cluster, NC-NO2, and NC-NO2-PtCl2 are magnified and described as atomic ball-and-stick models. (b) STEM image of NC-NO2-PtCl2 showing an atomic distribution of Pt signals. (c) k2-Weighted FT-EXAFS spectra of Pt foil, Pt/C, PtO2, H2PtCl6, and NC-NO2-PtCl2 in R-space. (d) LSV curves. (e) Comparison of cyclic LSV stability between Pt/C and NC-NO2-PtCl2[71]. Copyright, 2025, Wiley. (f) The synthesis procedure of MoS2-NGr-Co SACs. (g) XRD pattern of MoS2-NGr-Co SACs, MoS2-Co SACs, MoS2 catalysts. (h) FT-EXAFS of MoS2-NGr-Co SACs, as well as Co foil, Co3O4, CoO, and CoPc reference. (i) OER polarization curves. (j) HER polarization curves. (k) Polarization curves of electrodes: MoS2-NGr-Co SACs, MoS2-Co SACs, and MoS2 FS. (l) Electrochemical stability analysis of MoS2-NGr-Co SACs electrode at different current densities. (m) Comparison of the cell voltage of the target catalyst, MoS2-NGr-Co SACs, at 10 mA cm-2 with that reported in typical literature[57]. Copyright, 2025, Elsevier. (n) LSV curves (the currents are normalized by geometric area). (o) Polarization curves of PEM water electrolyzers with IrOx/VO-TiO2 and commercial TiO2 anodes at 80 ℃[1]. Copyright, 2025, American Chemical Society. |
| [1] |
|
| [2] |
|
| [3] |
|
| [4] |
|
| [5] |
|
| [6] |
|
| [7] |
|
| [8] |
|
| [9] |
|
| [10] |
|
| [11] |
|
| [12] |
|
| [13] |
|
| [14] |
|
| [15] |
|
| [16] |
|
| [17] |
|
| [18] |
|
| [19] |
|
| [20] |
|
| [21] |
|
| [22] |
|
| [23] |
|
| [24] |
|
| [25] |
|
| [26] |
|
| [27] |
|
| [28] |
|
| [29] |
|
| [30] |
|
| [31] |
|
| [32] |
|
| [33] |
|
| [34] |
|
| [35] |
|
| [36] |
|
| [37] |
|
| [38] |
|
| [39] |
|
| [40] |
|
| [41] |
|
| [42] |
|
| [43] |
|
| [44] |
|
| [45] |
|
| [46] |
|
| [47] |
|
| [48] |
|
| [49] |
|
| [50] |
|
| [51] |
|
| [52] |
|
| [53] |
|
| [54] |
|
| [55] |
|
| [56] |
|
| [57] |
|
| [58] |
|
| [59] |
|
| [60] |
|
| [61] |
|
| [62] |
|
| [63] |
|
| [64] |
|
| [65] |
|
| [66] |
|
| [67] |
|
| [68] |
|
| [69] |
|
| [70] |
|
| [71] |
|
/
| 〈 |
|
〉 |