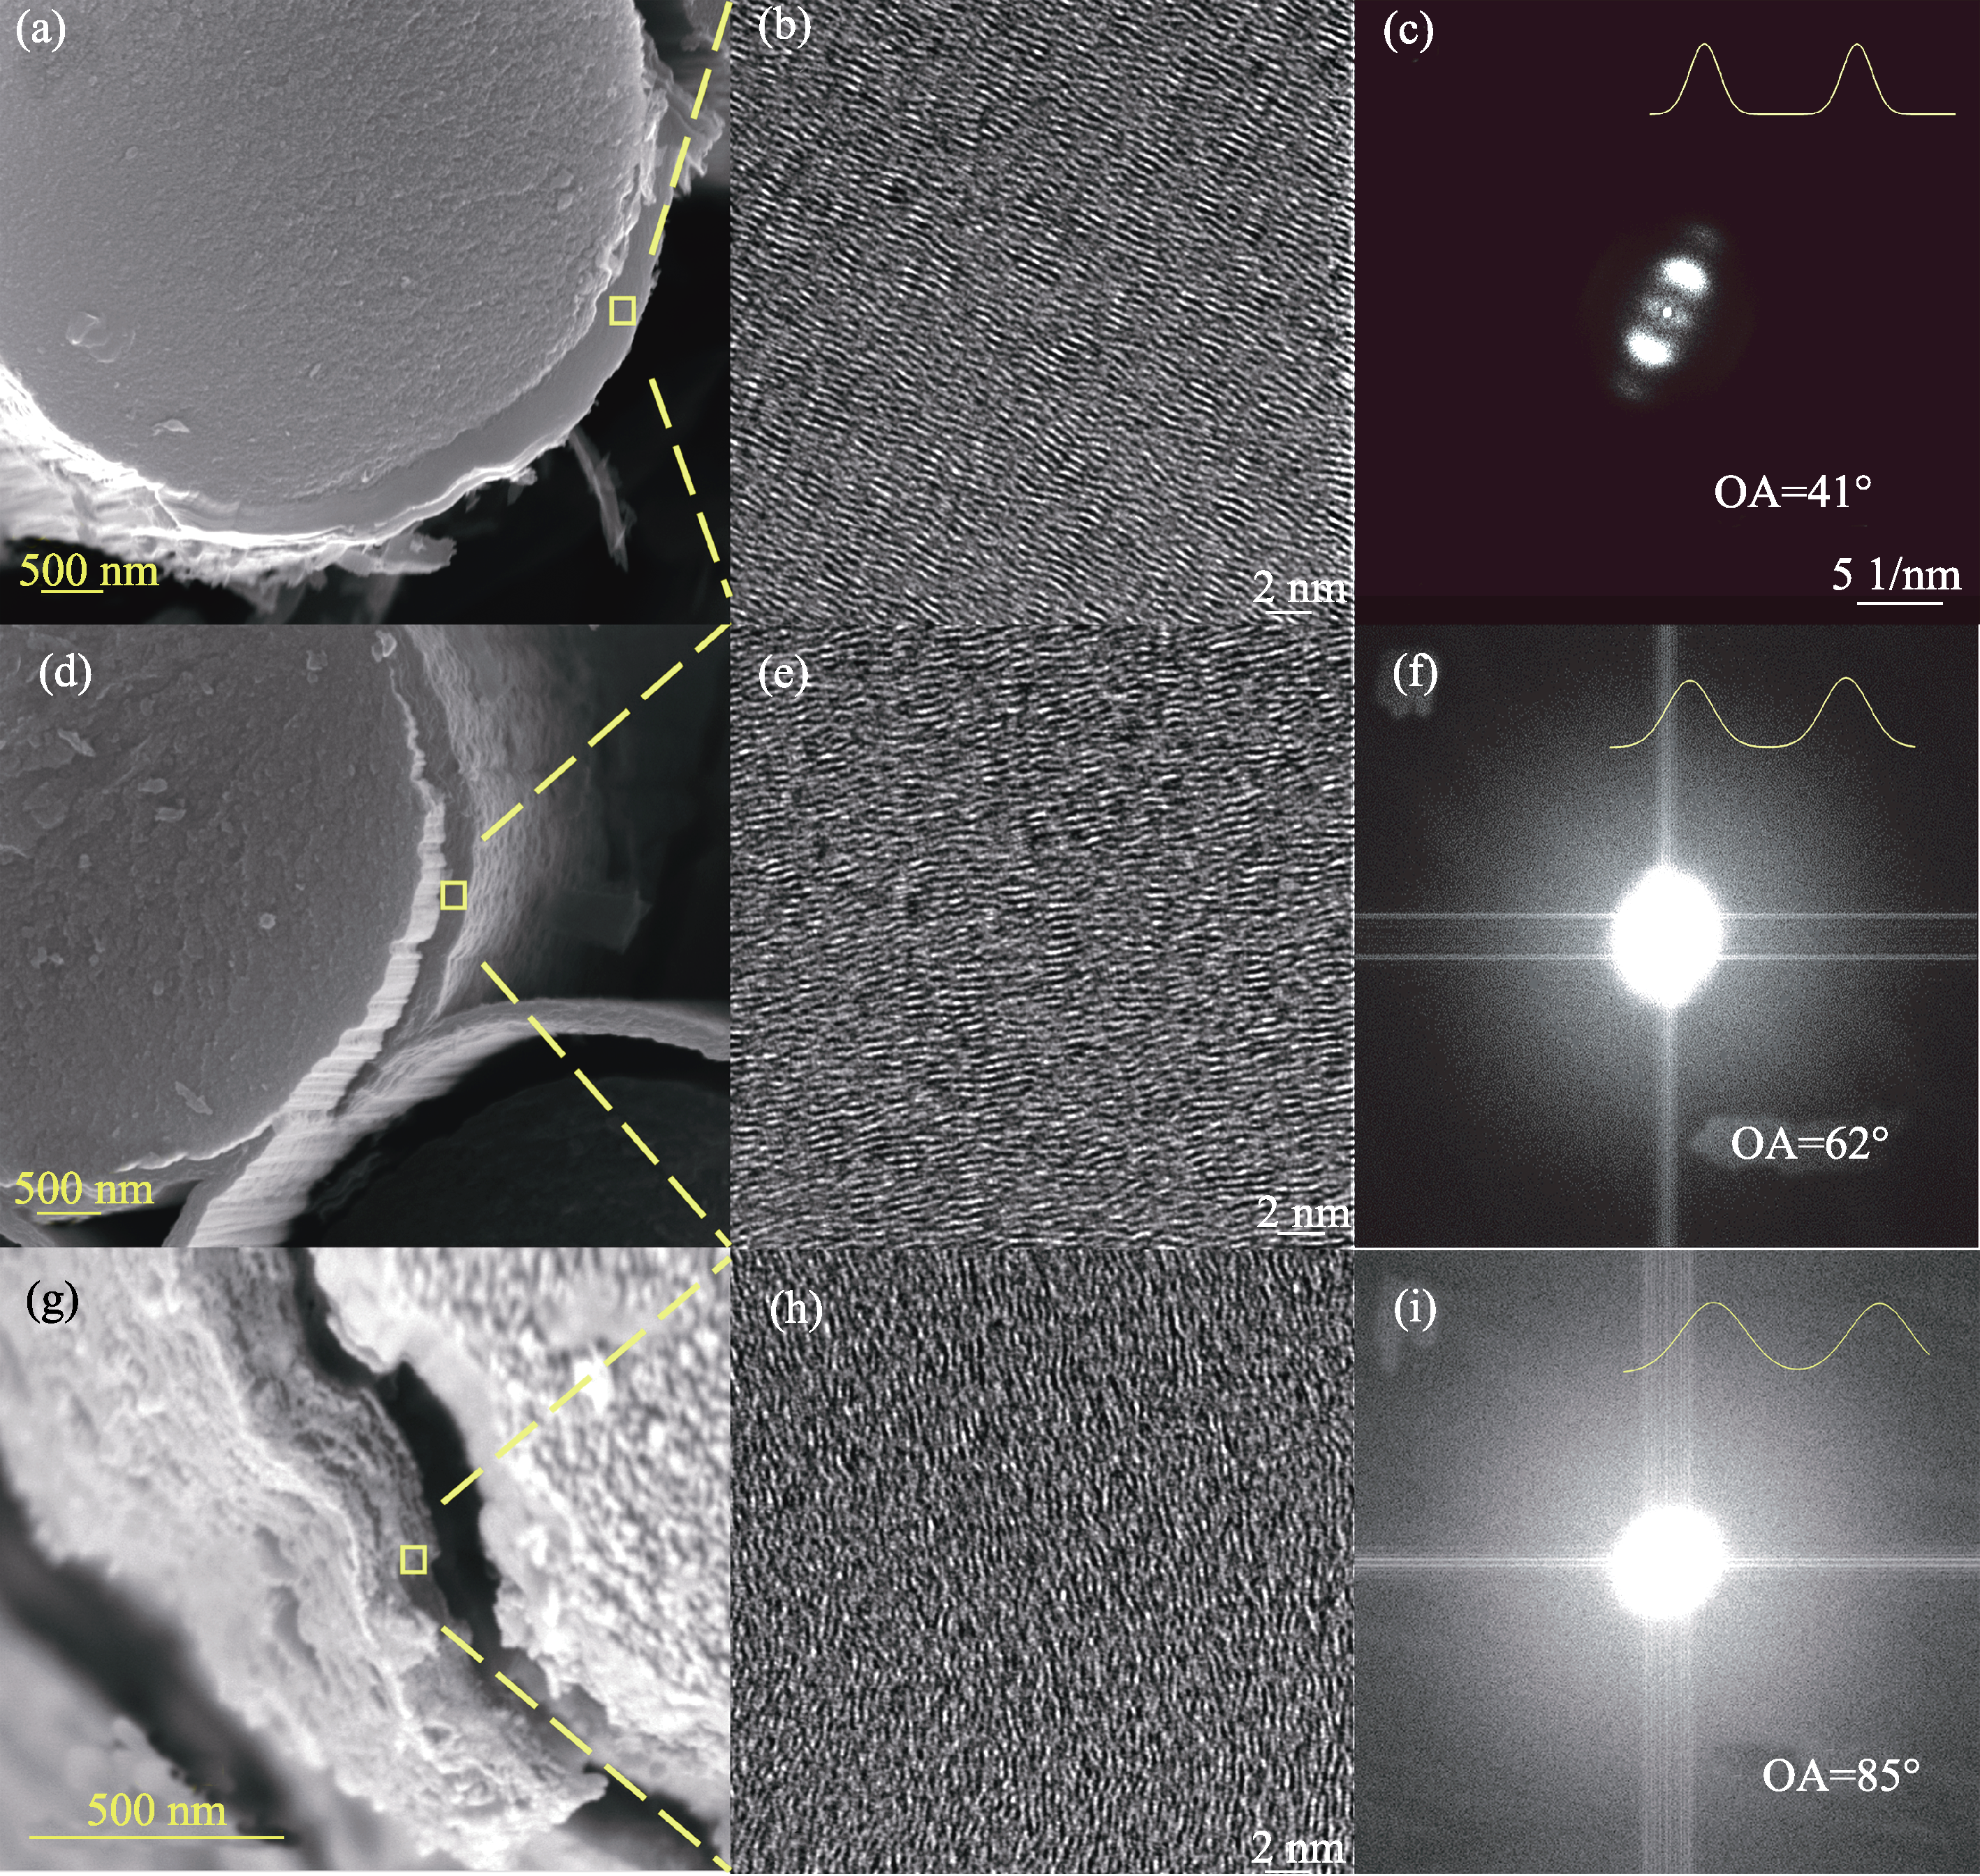
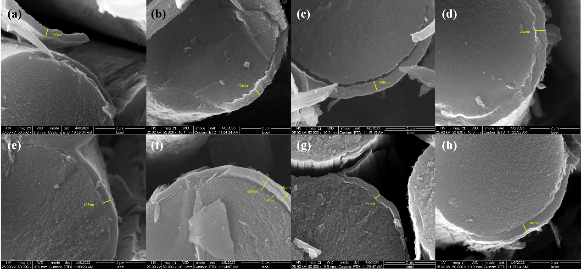
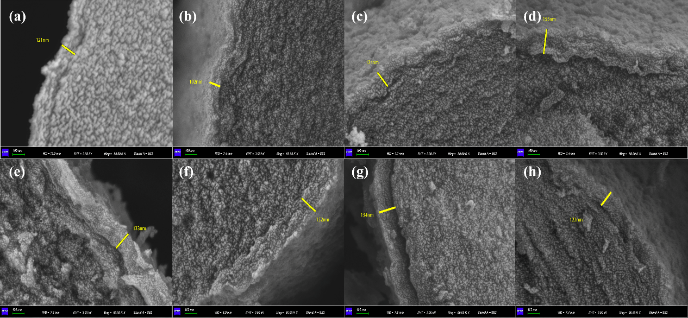
Fig. 2 TEM charaterizations of three typical samples (a) SEM image of interphase, (b) HRTEM image of interphase and (c) Fourier transform of HT (Group 2); (d) SEM image of interphase, (e) HRTEM image of interphase and (f) Fourier transform of MT (Group 4); (g) SEM image of interphase, (h) HRTEM image of interphase and (i) Fourier transform of LT (Group 8)
Other figure/table from this article