×
模态框(Modal)标题
在这里添加一些文本
Close
Close
Submit
Cancel
Confirm
×
模态框(Modal)标题
×
About
Journals
Join iAC
Contact
Help
Home
Journals
Journal of Inorganic Materials
Journal of Inorganic Materials
Abbreviation (ISO4):
J Inorg Mat
Editor in chief:
Lidong CHEN
About
/
Aim & scope
/
Editorial board
/
Indexed
/
Contact
/
Online first
/
Current issue
/
All issues
/
Top access
/
RSS
Figure/Table detail
Process Control of PyC Interphases Microstructure and Uniformity in Carbon Fiber Cloth
Yifan XUE, Weijie LI, Zhongwei ZHANG, Xu PANG, Yu LIU
J Inorg Mat
, 2024, 39(
4
): 399-408. DOI:
10.15541/jim20230512
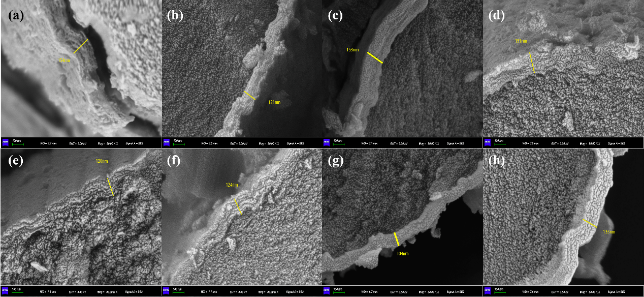
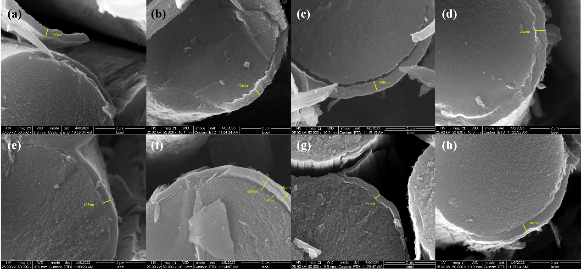
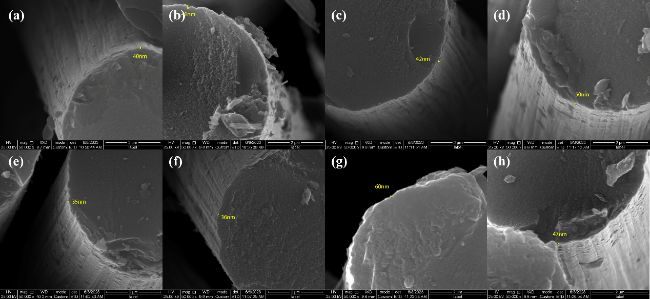
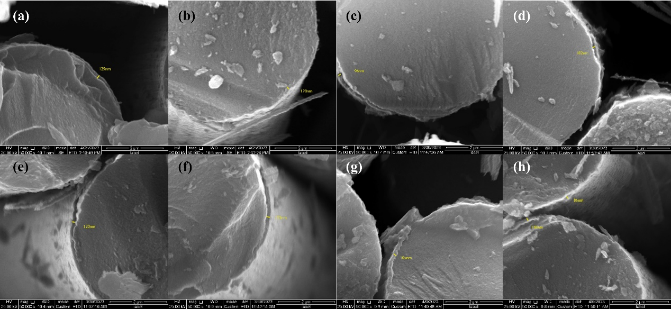
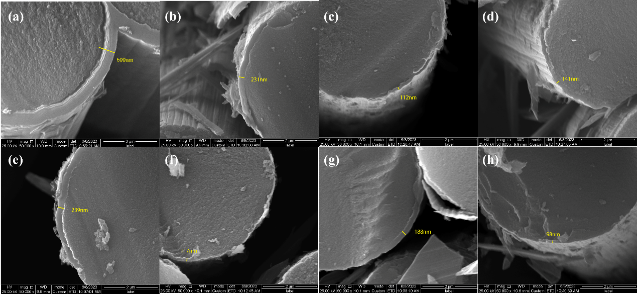
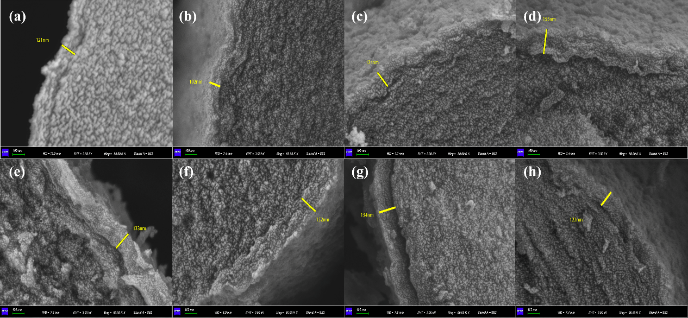
Fig. S8
Group 8 SEM images
Other figure/table from this article
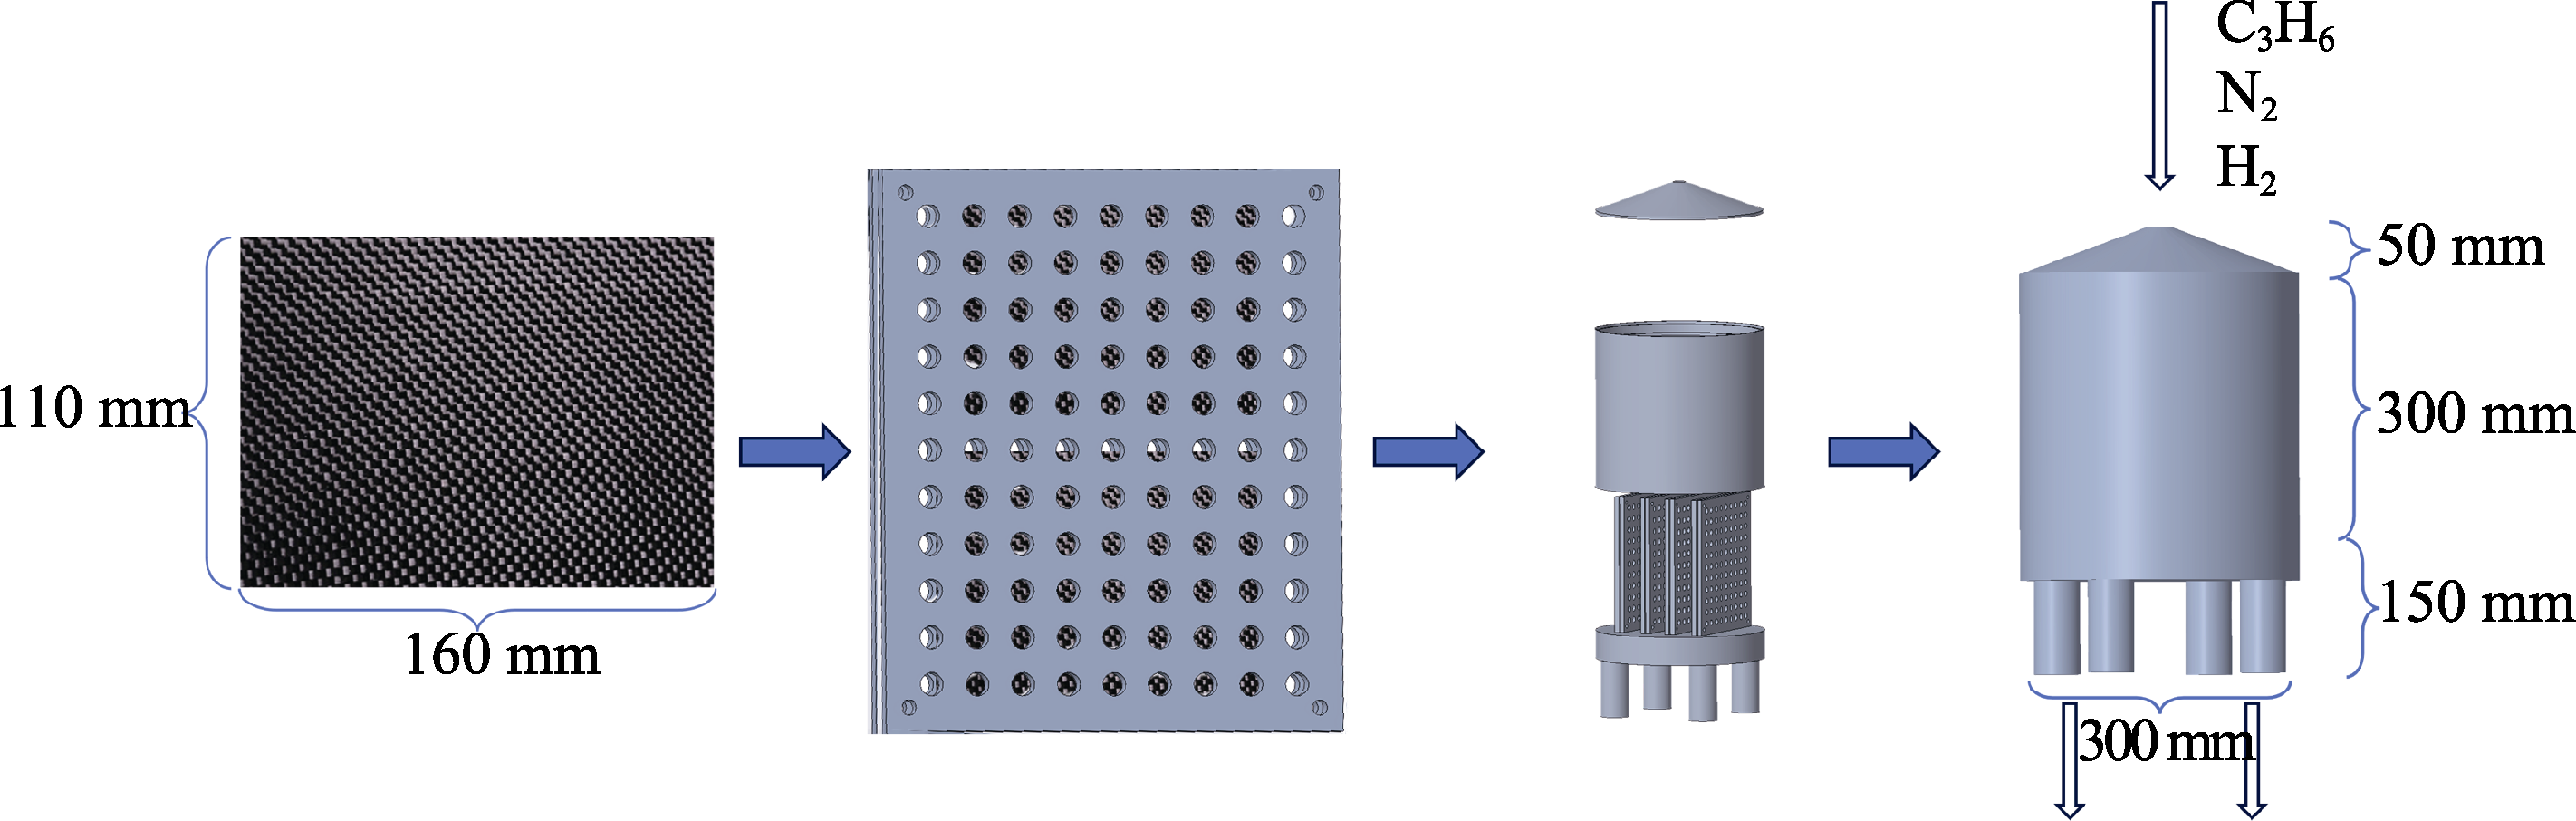
Fig. 1
Schematic diagram of mold
Table 1
Design parameters for experiment
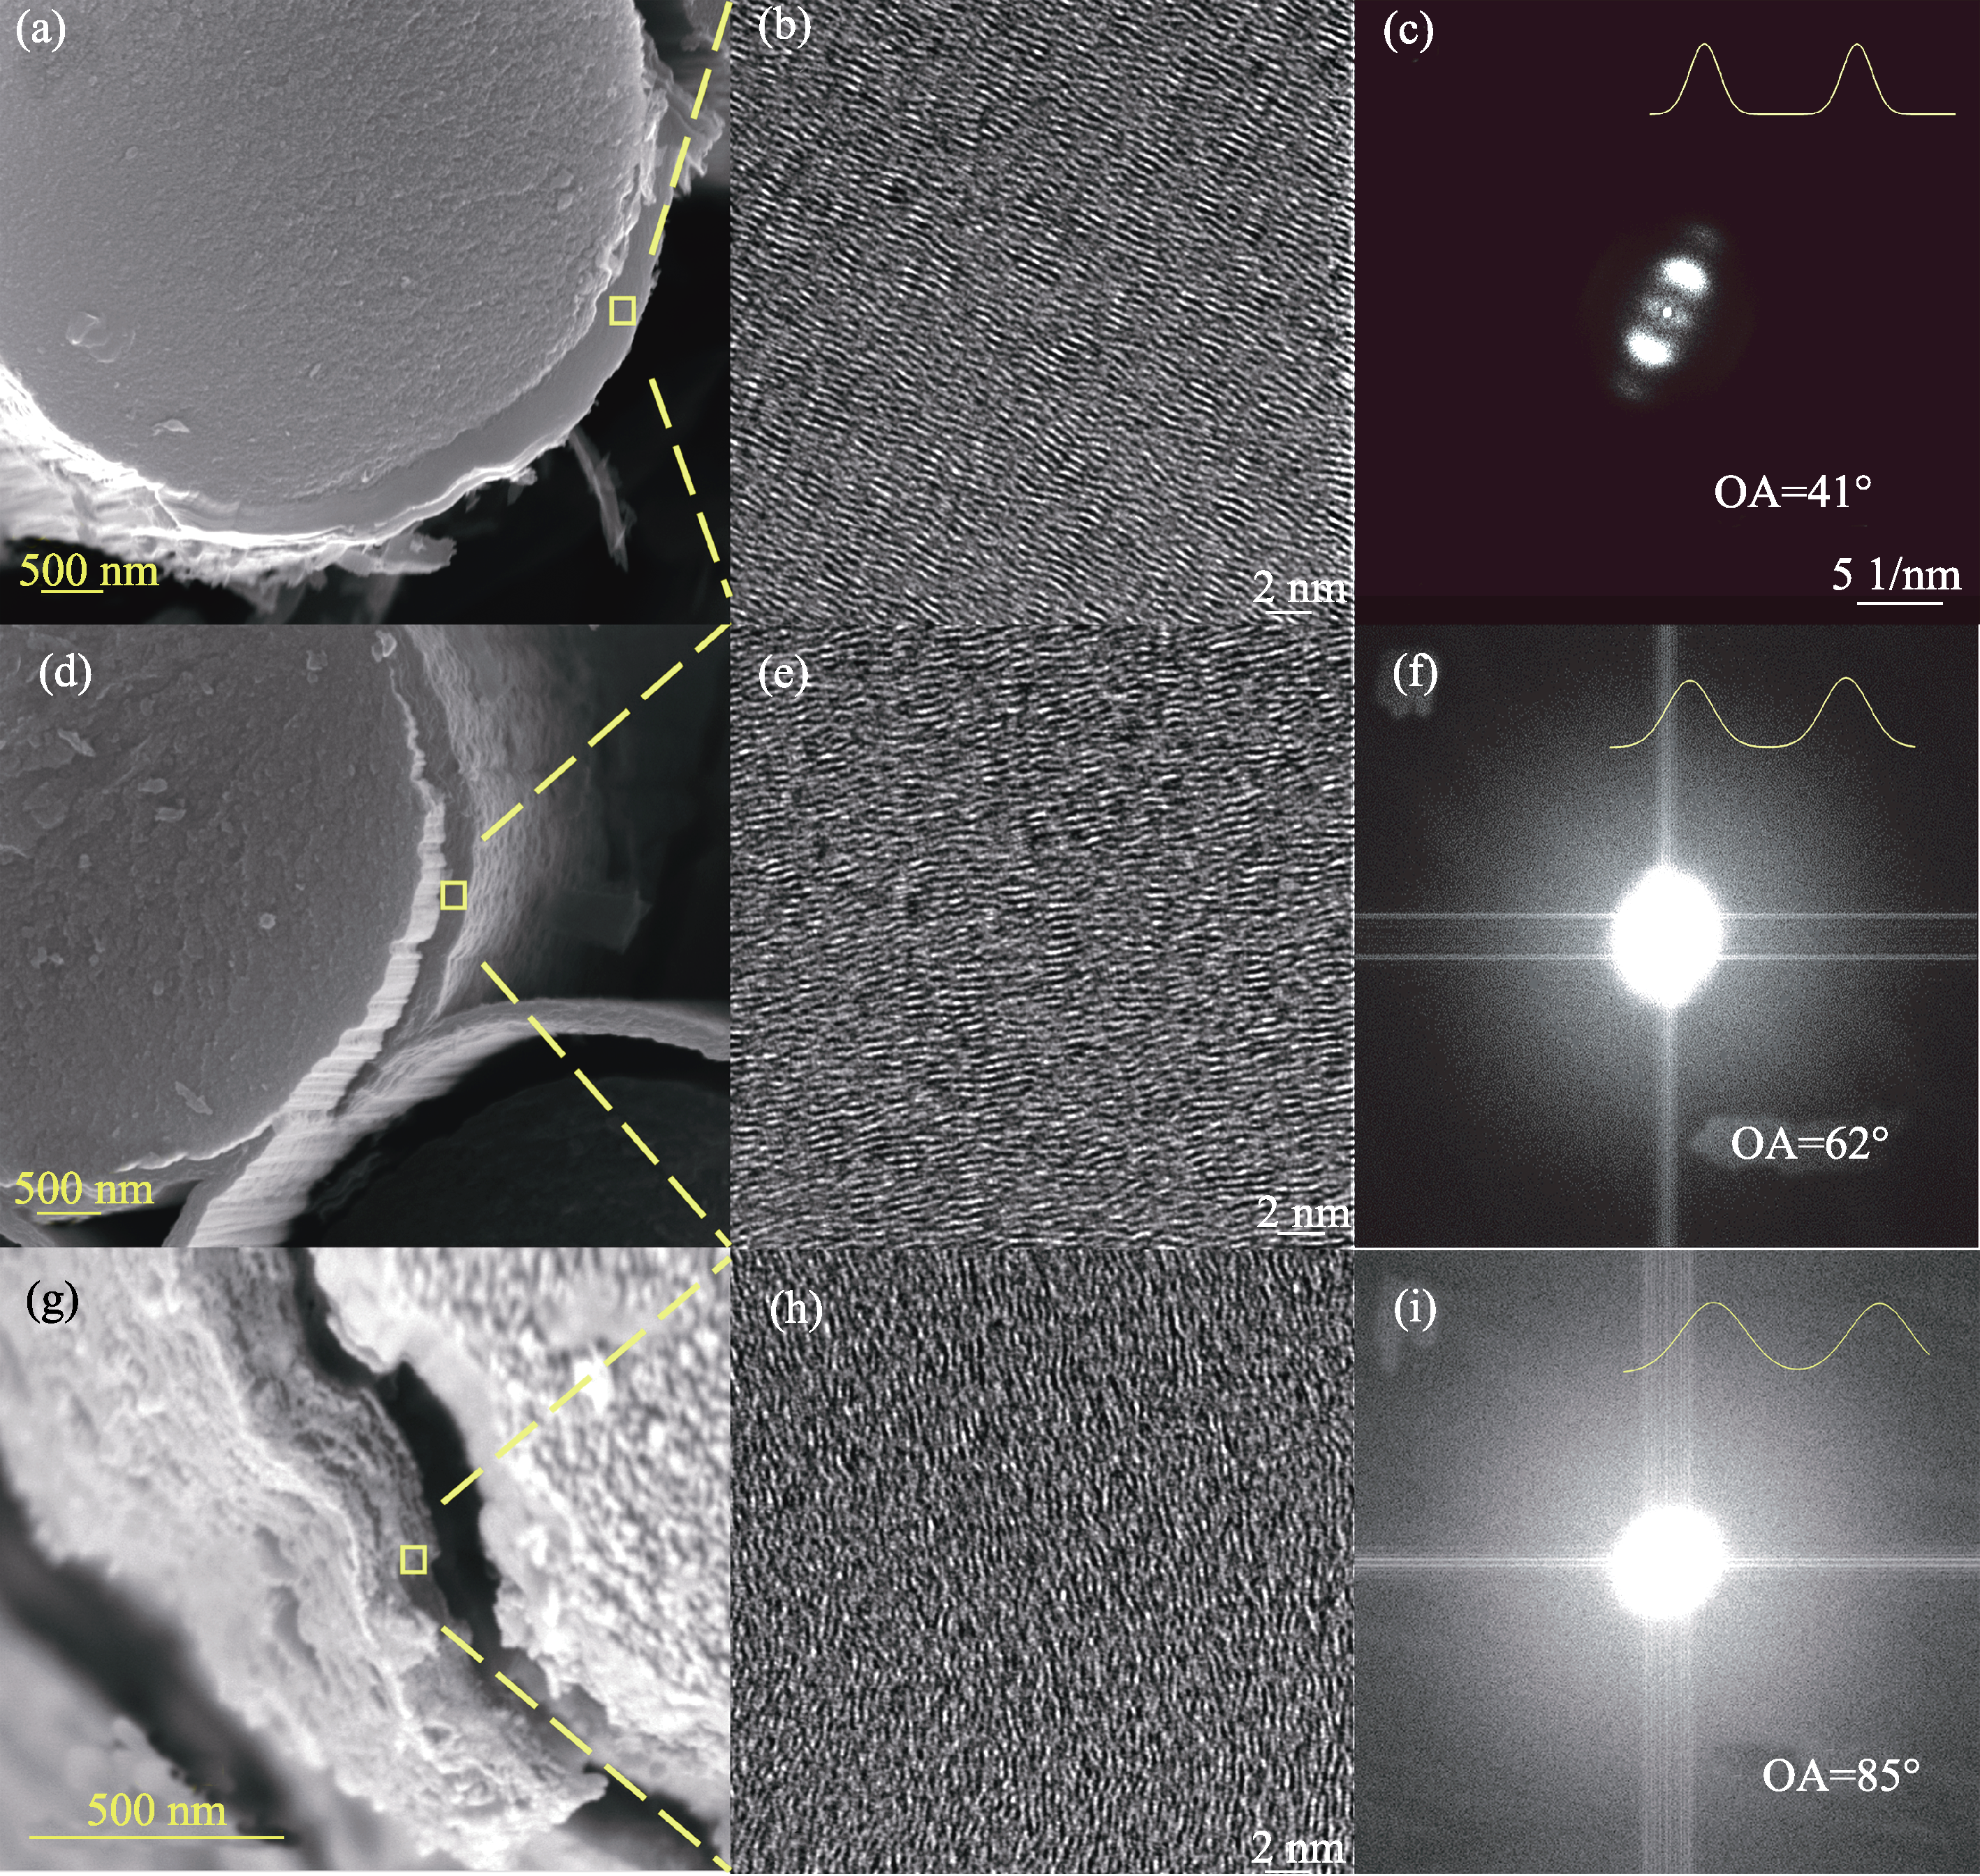
Fig. 2
TEM charaterizations of three typical samples
(a) SEM image of interphase, (b) HRTEM image of interphase and (c) Fourier transform of HT (Group 2); (d) SEM image of interphase, (e) HRTEM image of interphase and (f) Fourier transform of MT (Group 4); (g) SEM image of interphase, (h) HRTEM image of interphase and (i) Fourier transform of LT (Group 8)
Table 2
Summary of XRD FWHM and R (R=I
D
/I
G
) for Raman spectra of PyC interphases, and texture classifications
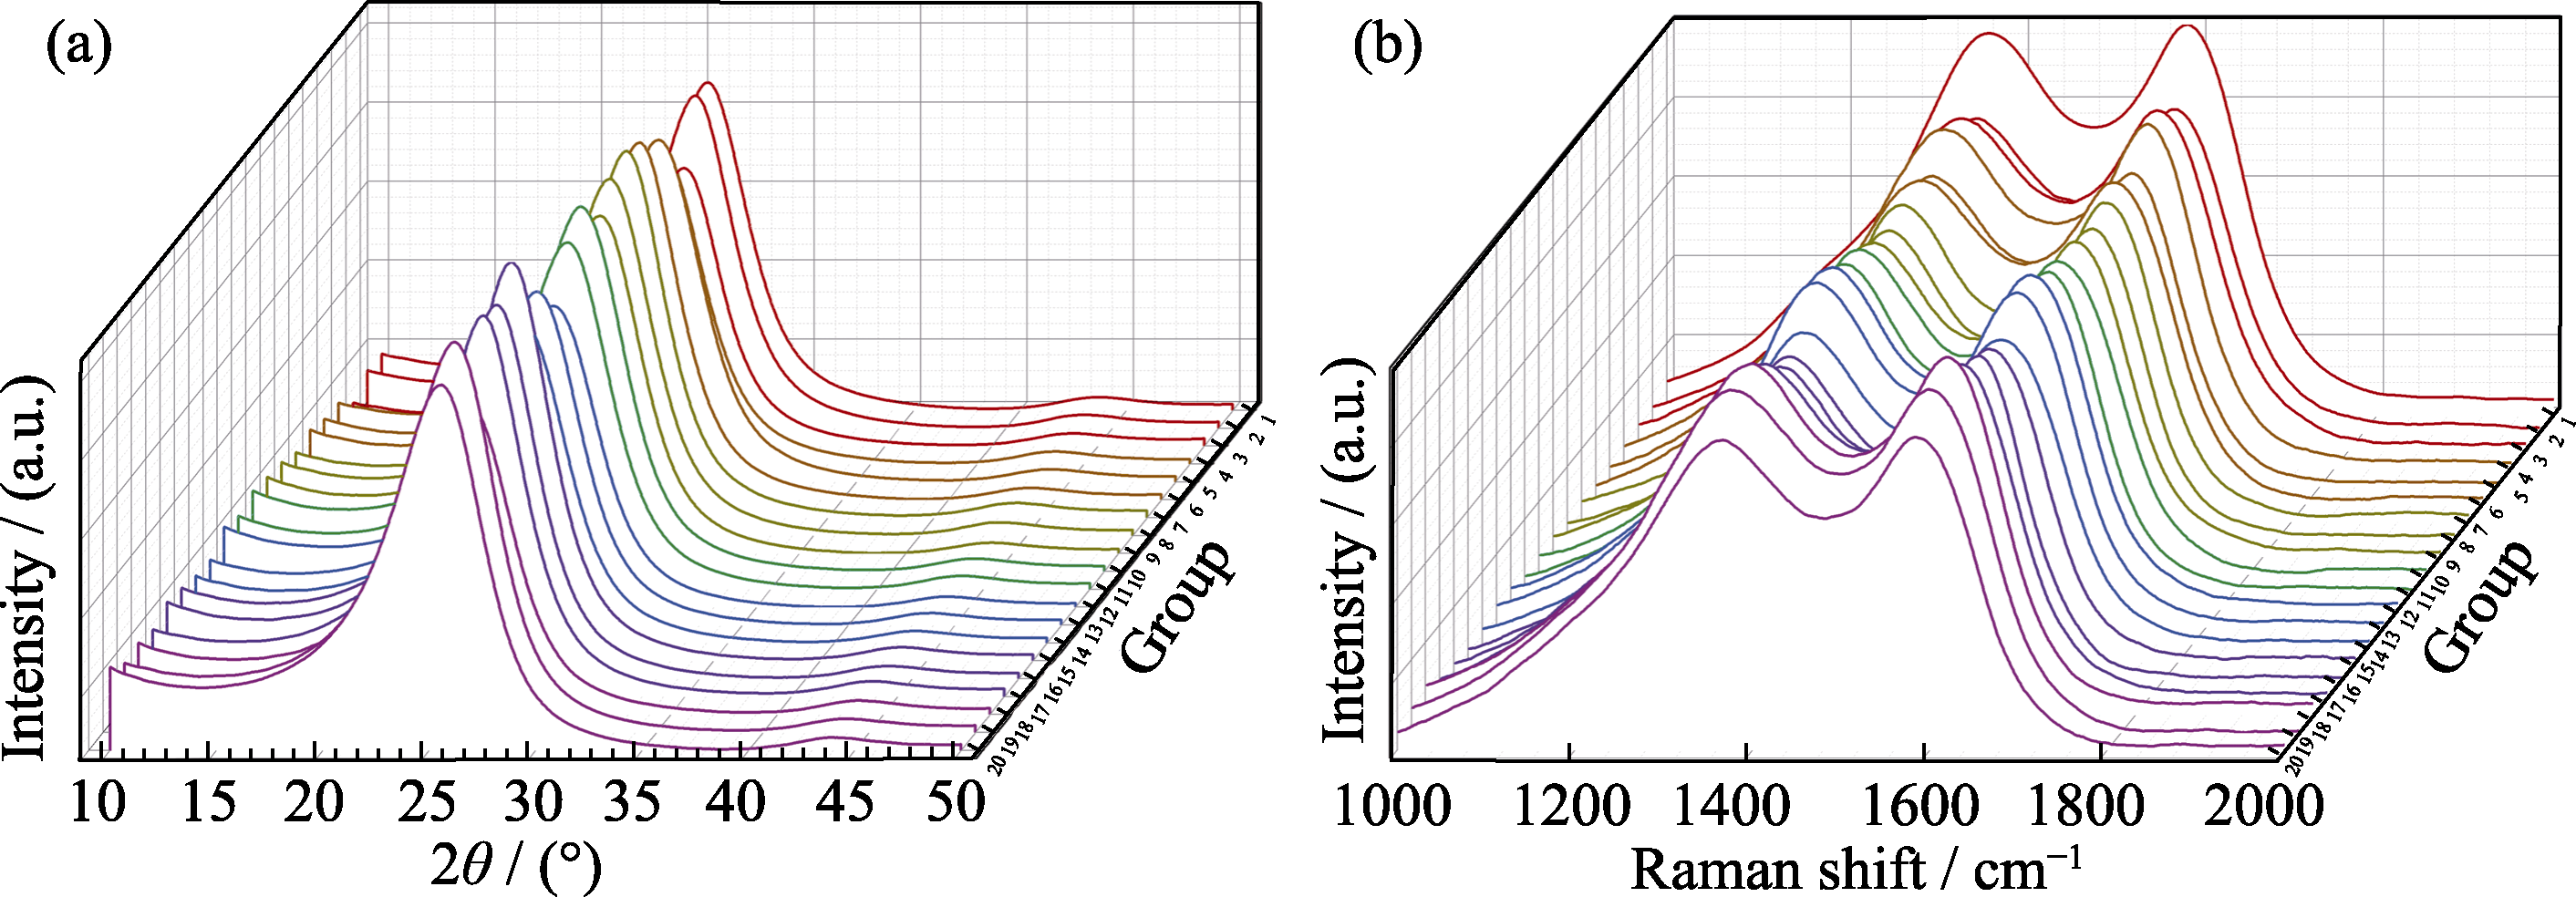
Fig. 3
(a) XRD patterns and (b) Raman spectra of PyC interphase on carbon fiber prepared by different fabrication processes
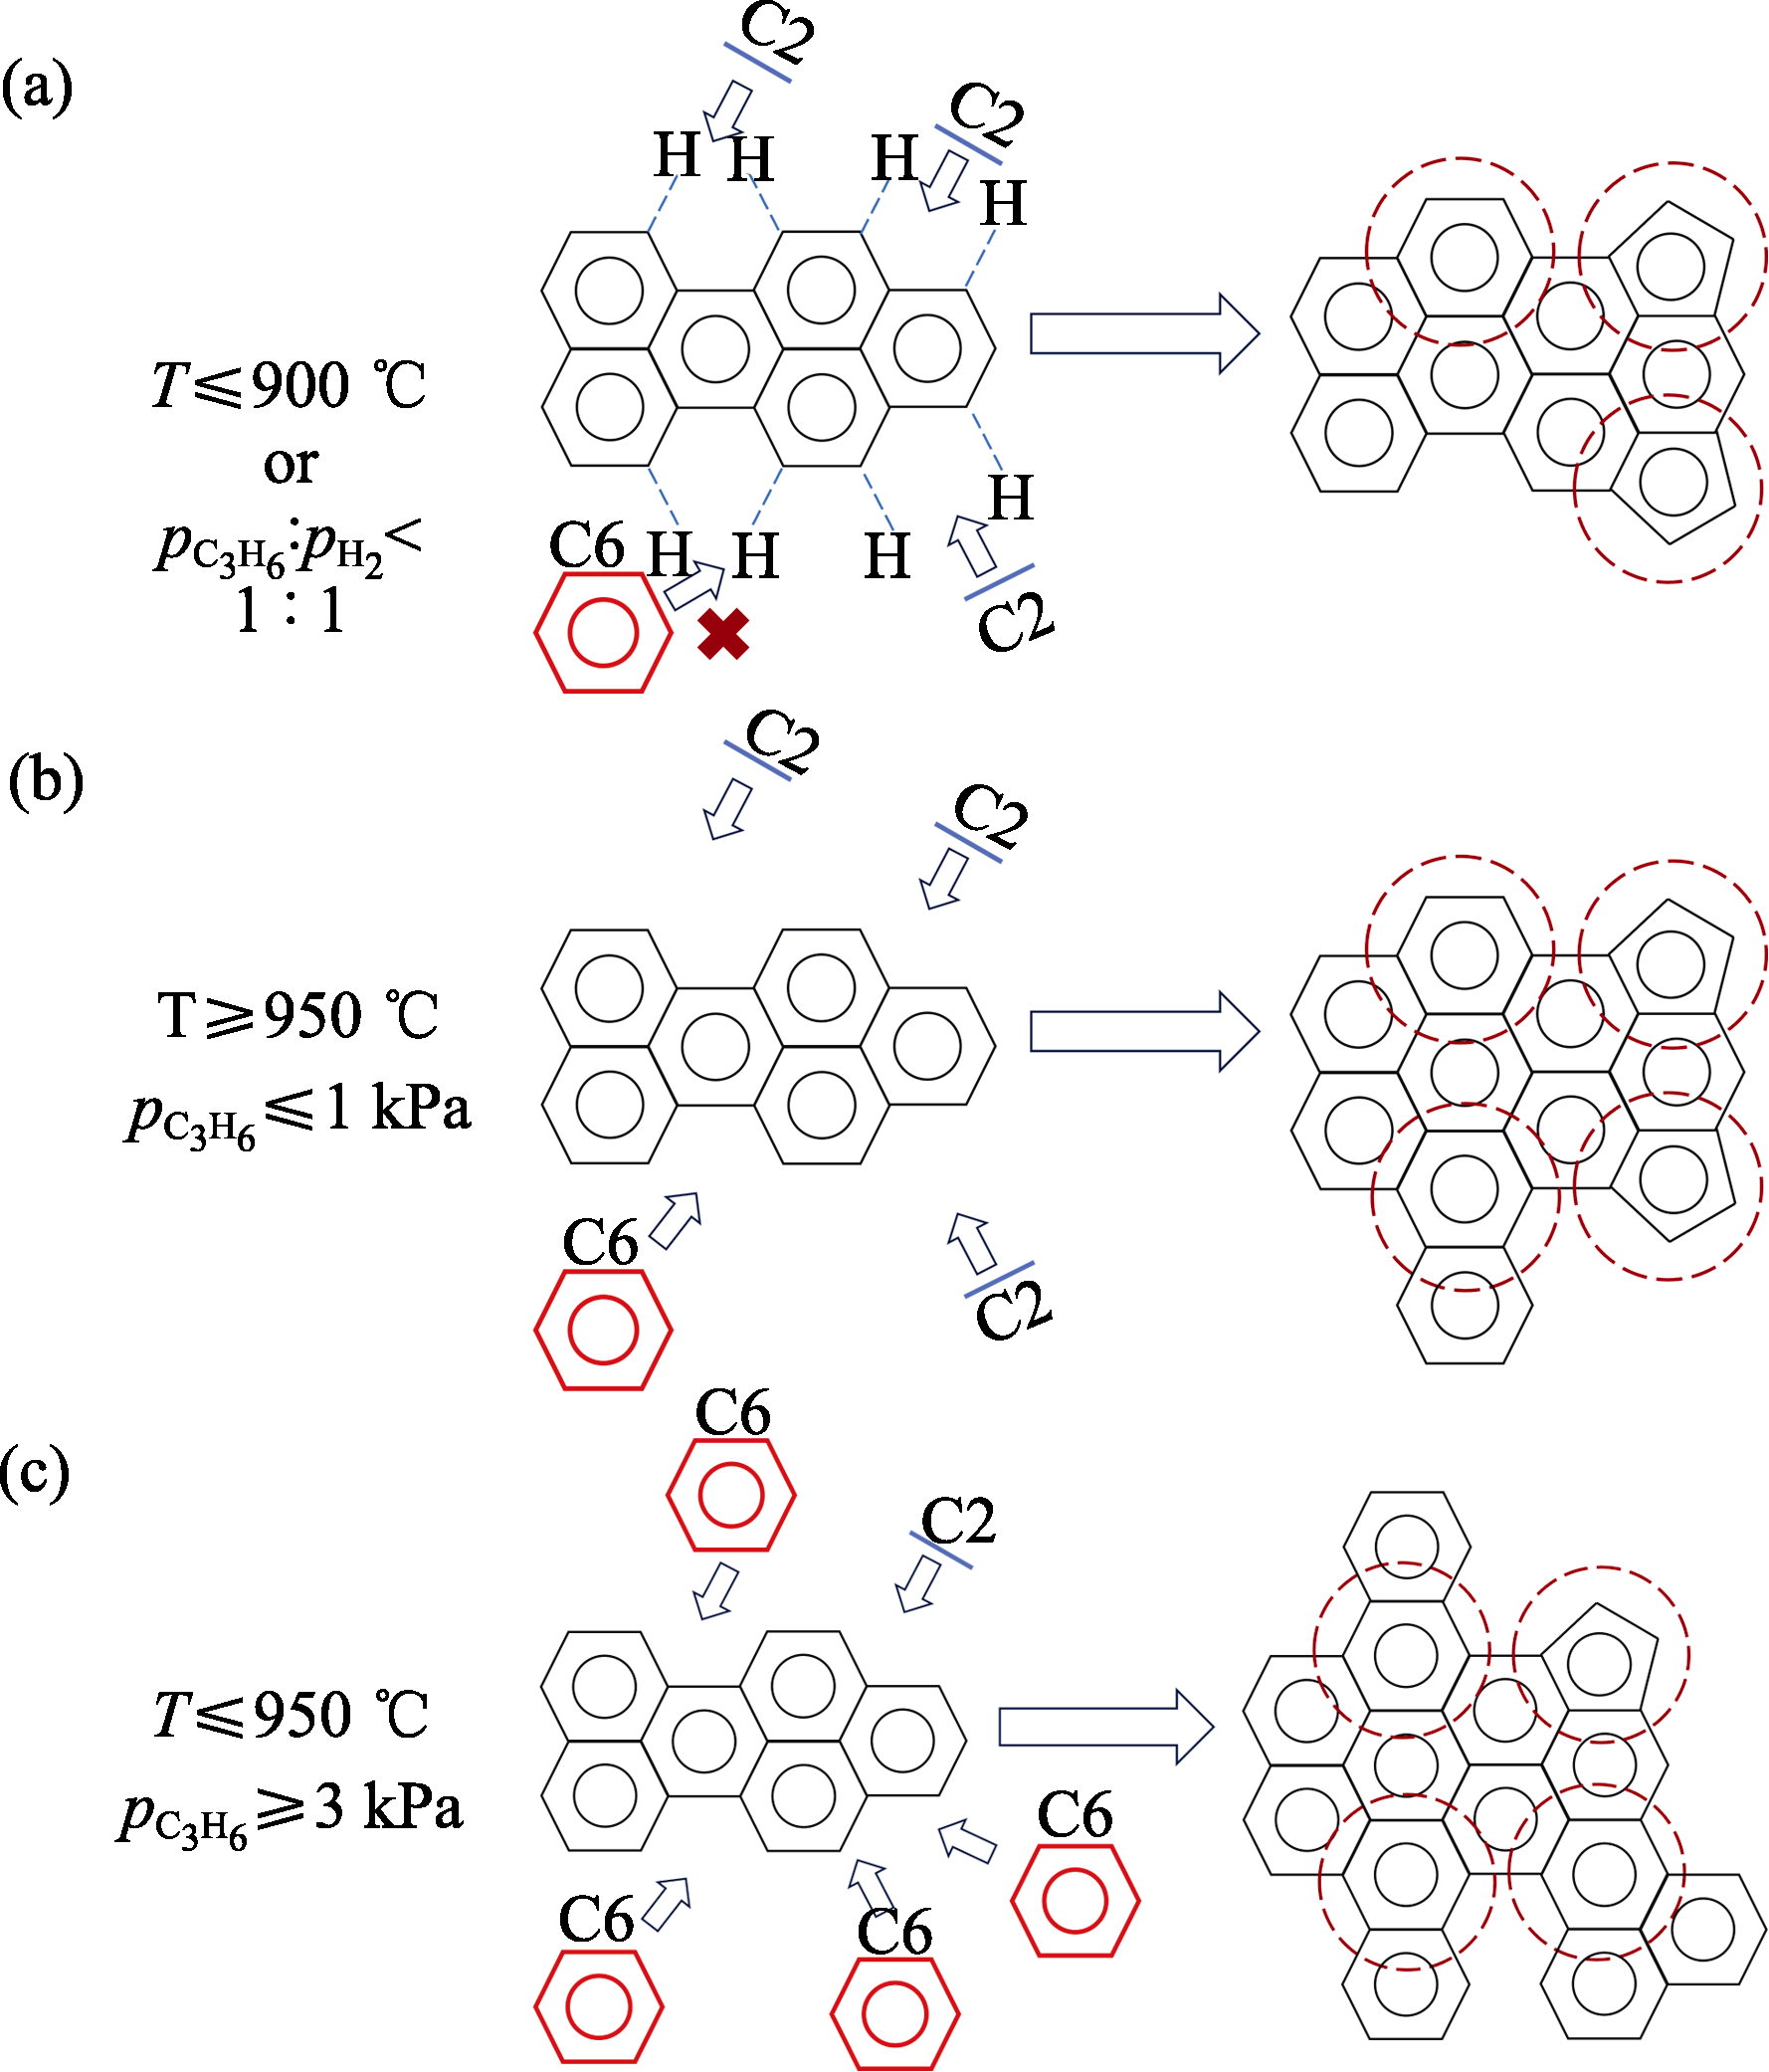
Fig. 4
Deposition mechanism and boundary conditions for
(a) LT, (b) MT and (c) HT
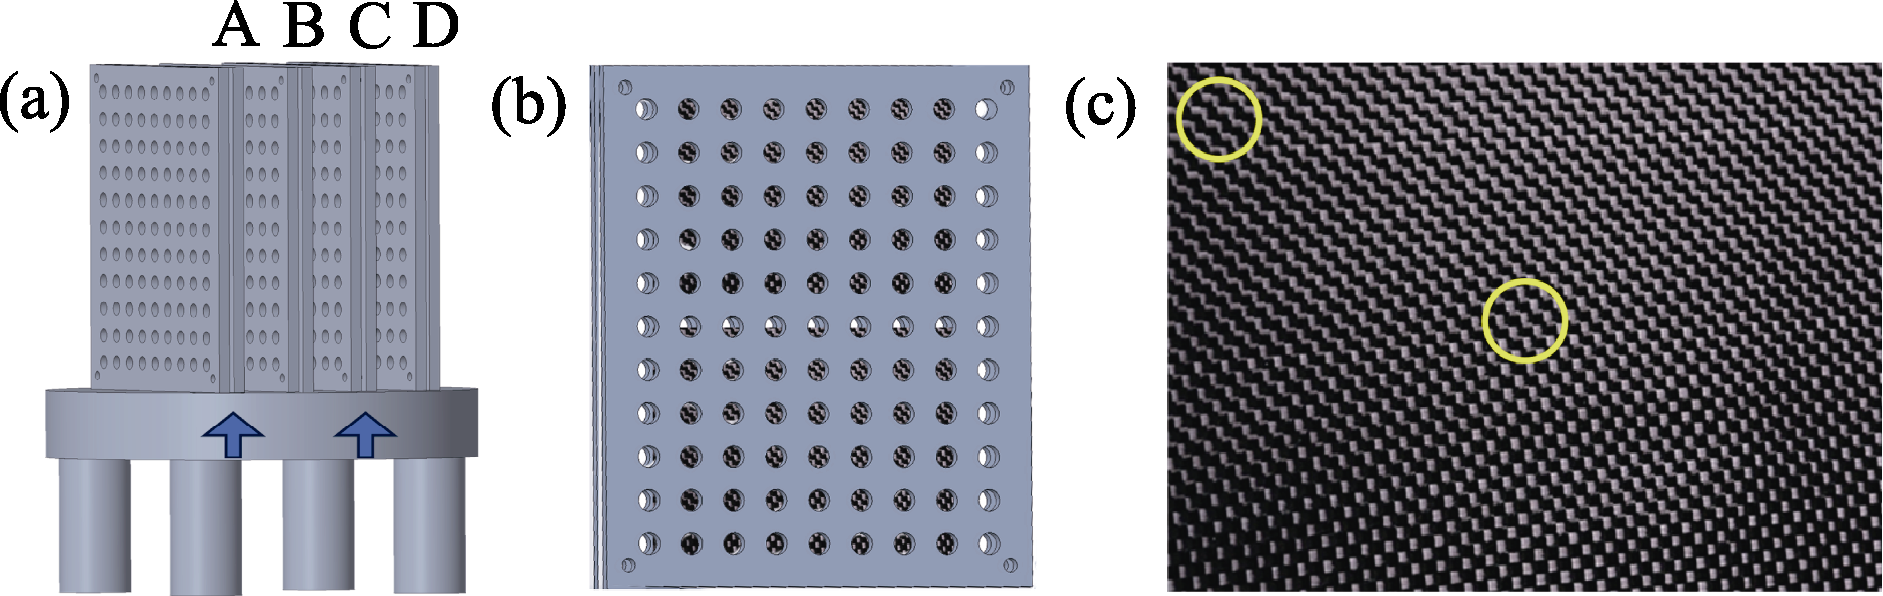
Fig. 5
(a) Fixture layout diagram, (b) fixture main view and (c) sampling position of fiber fabric
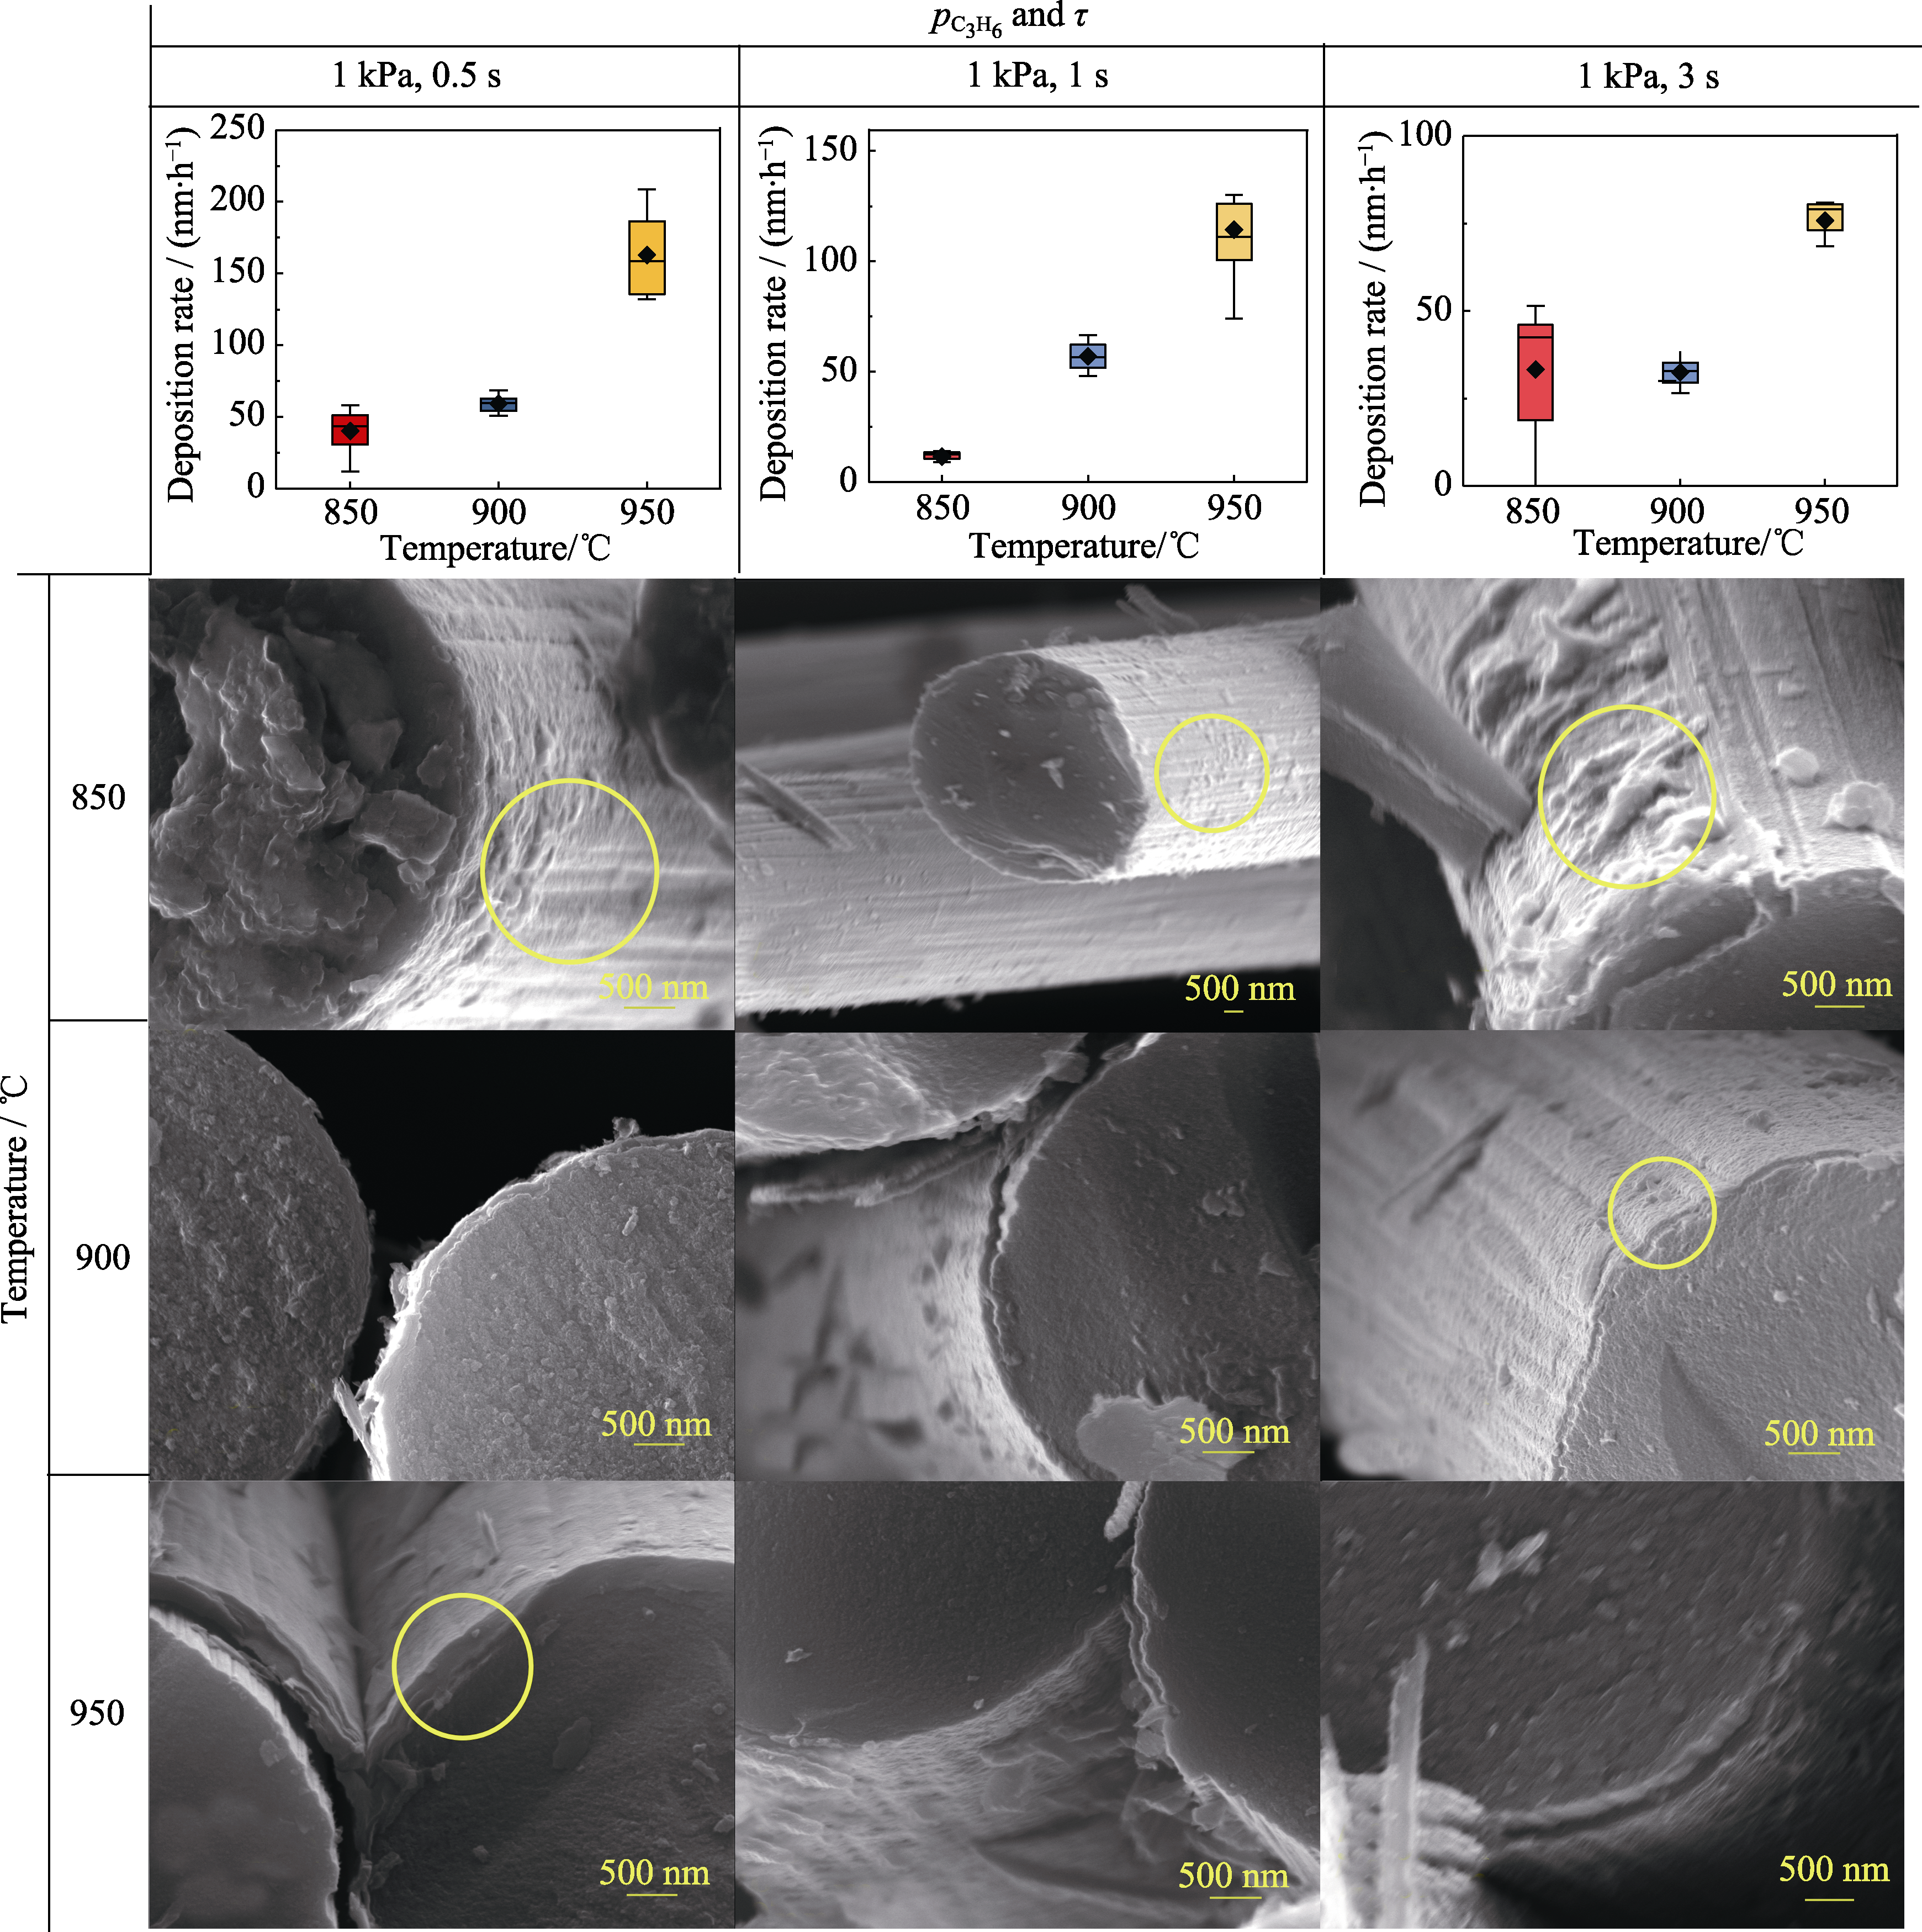
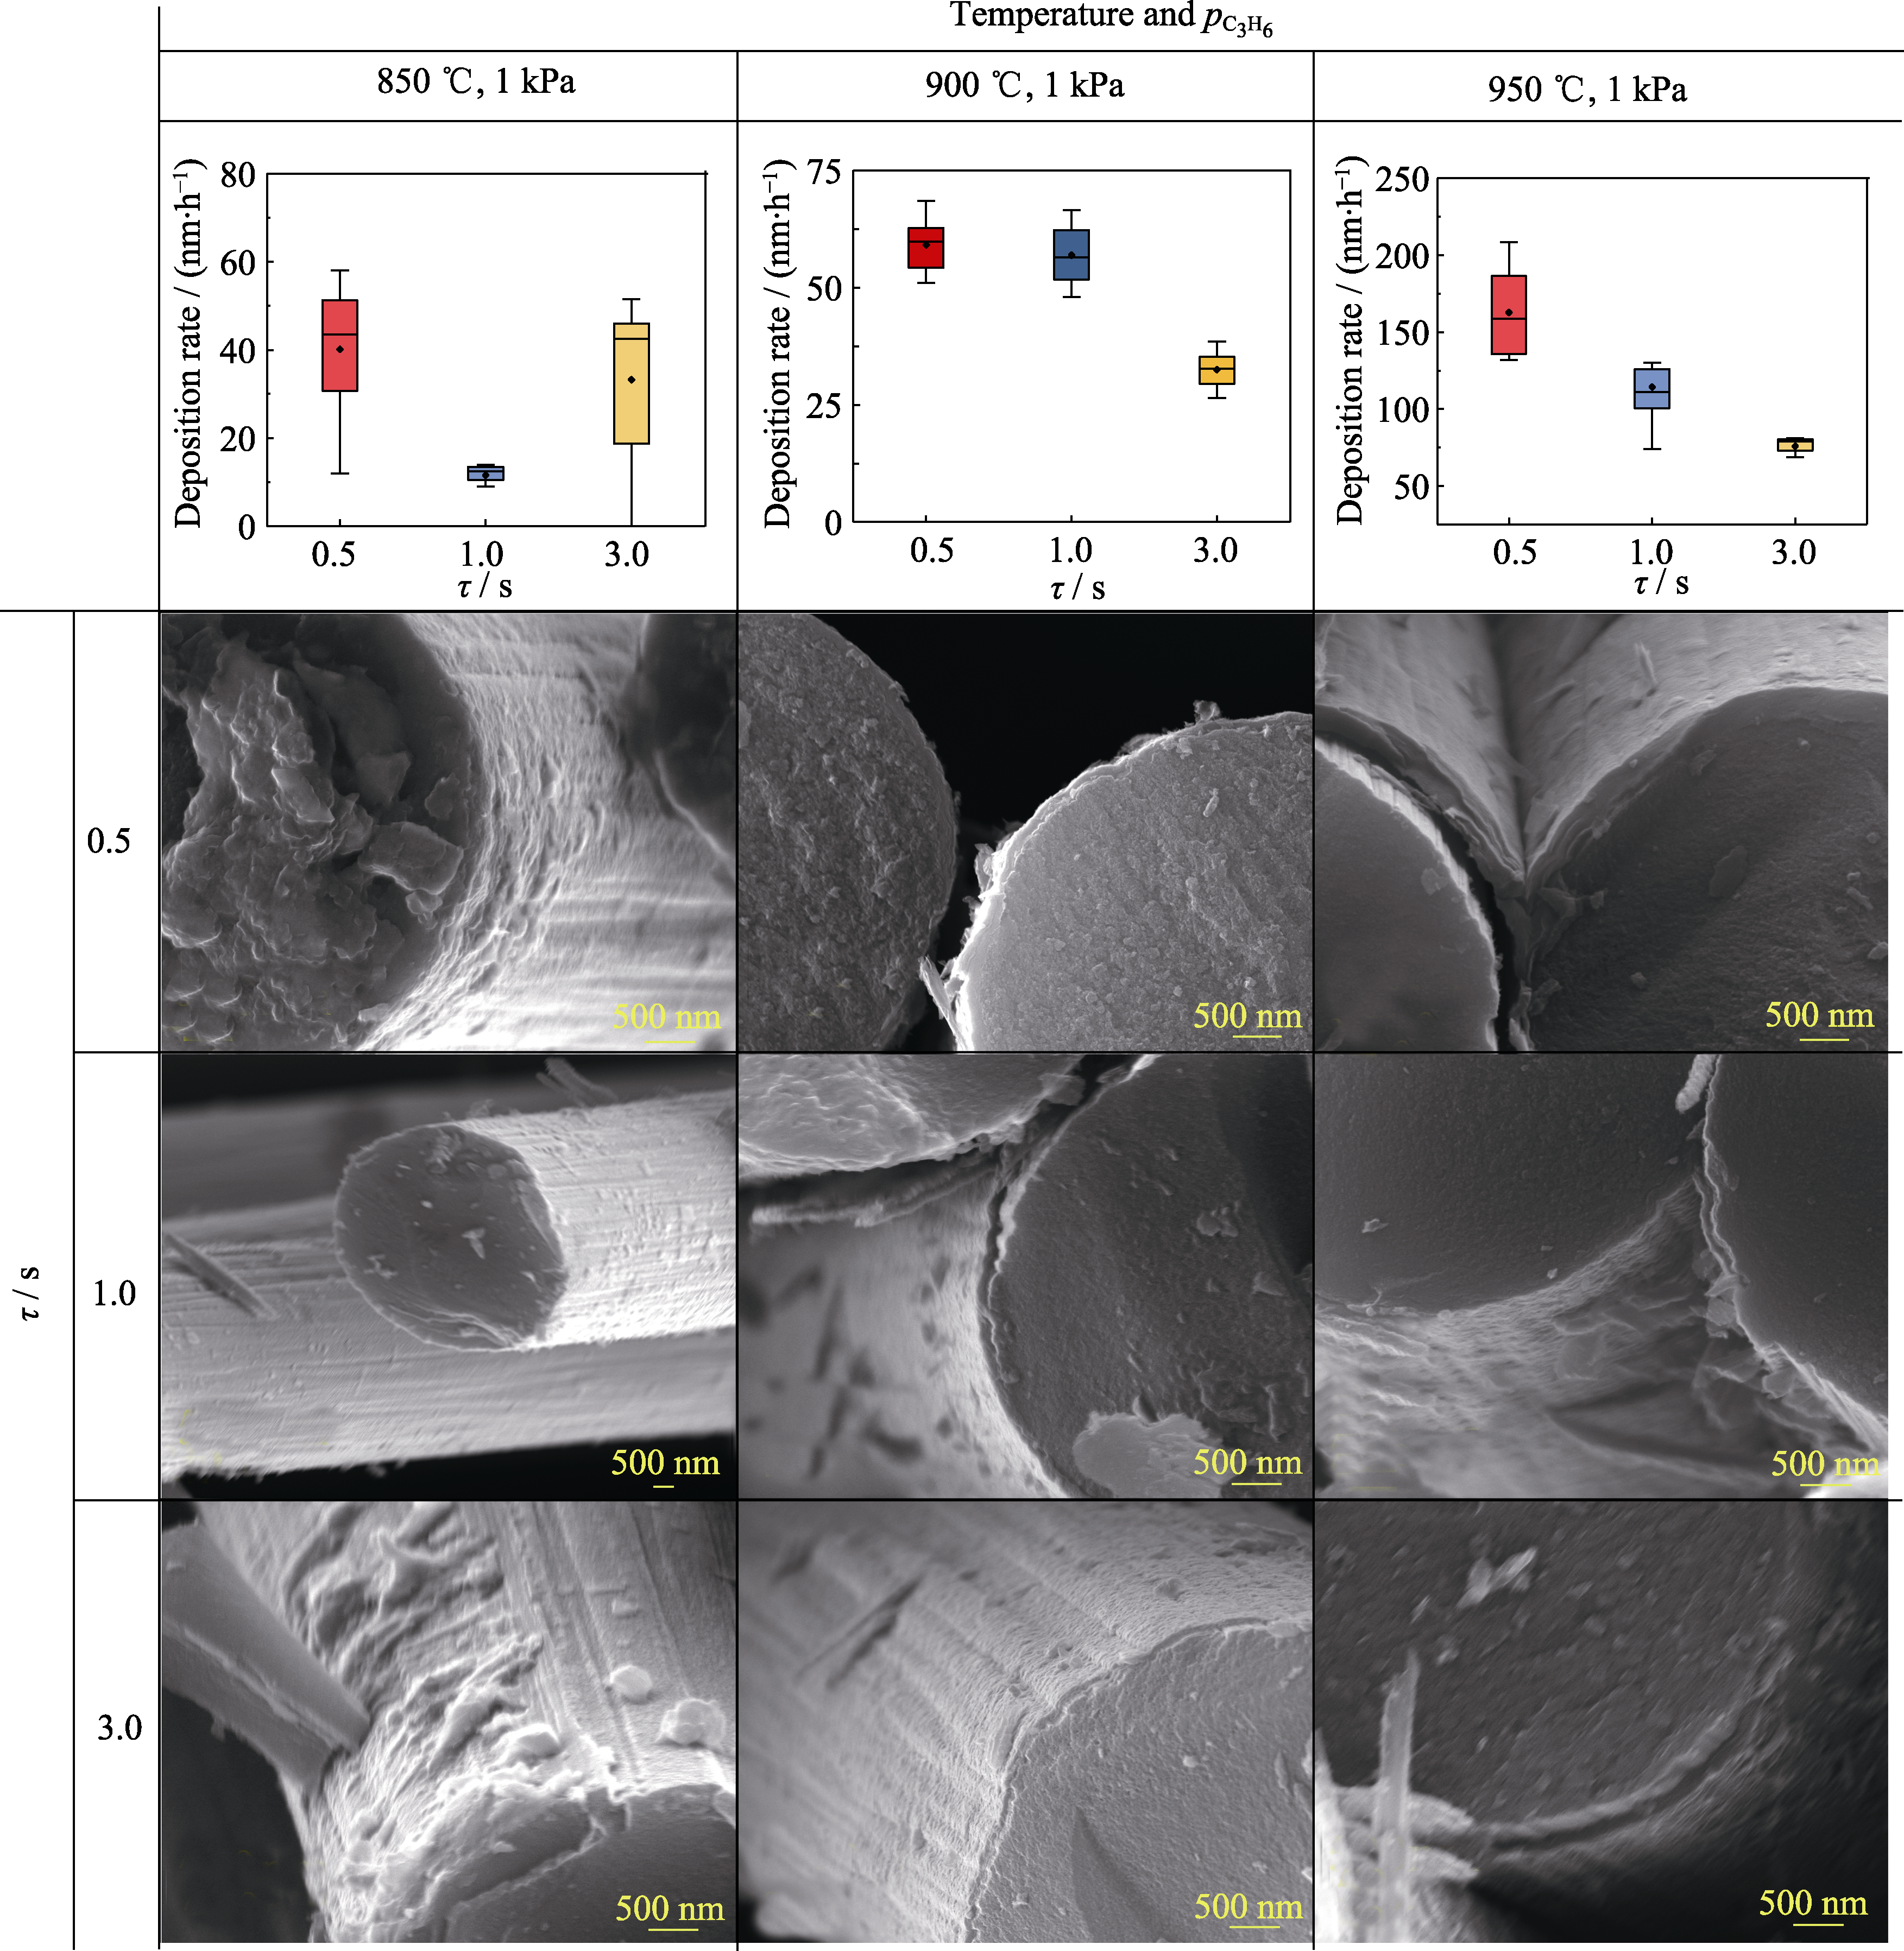
Fig. 6
Deposition rate, uniformity and typical SEM images of cross-section of PyC interphases at various temperatures
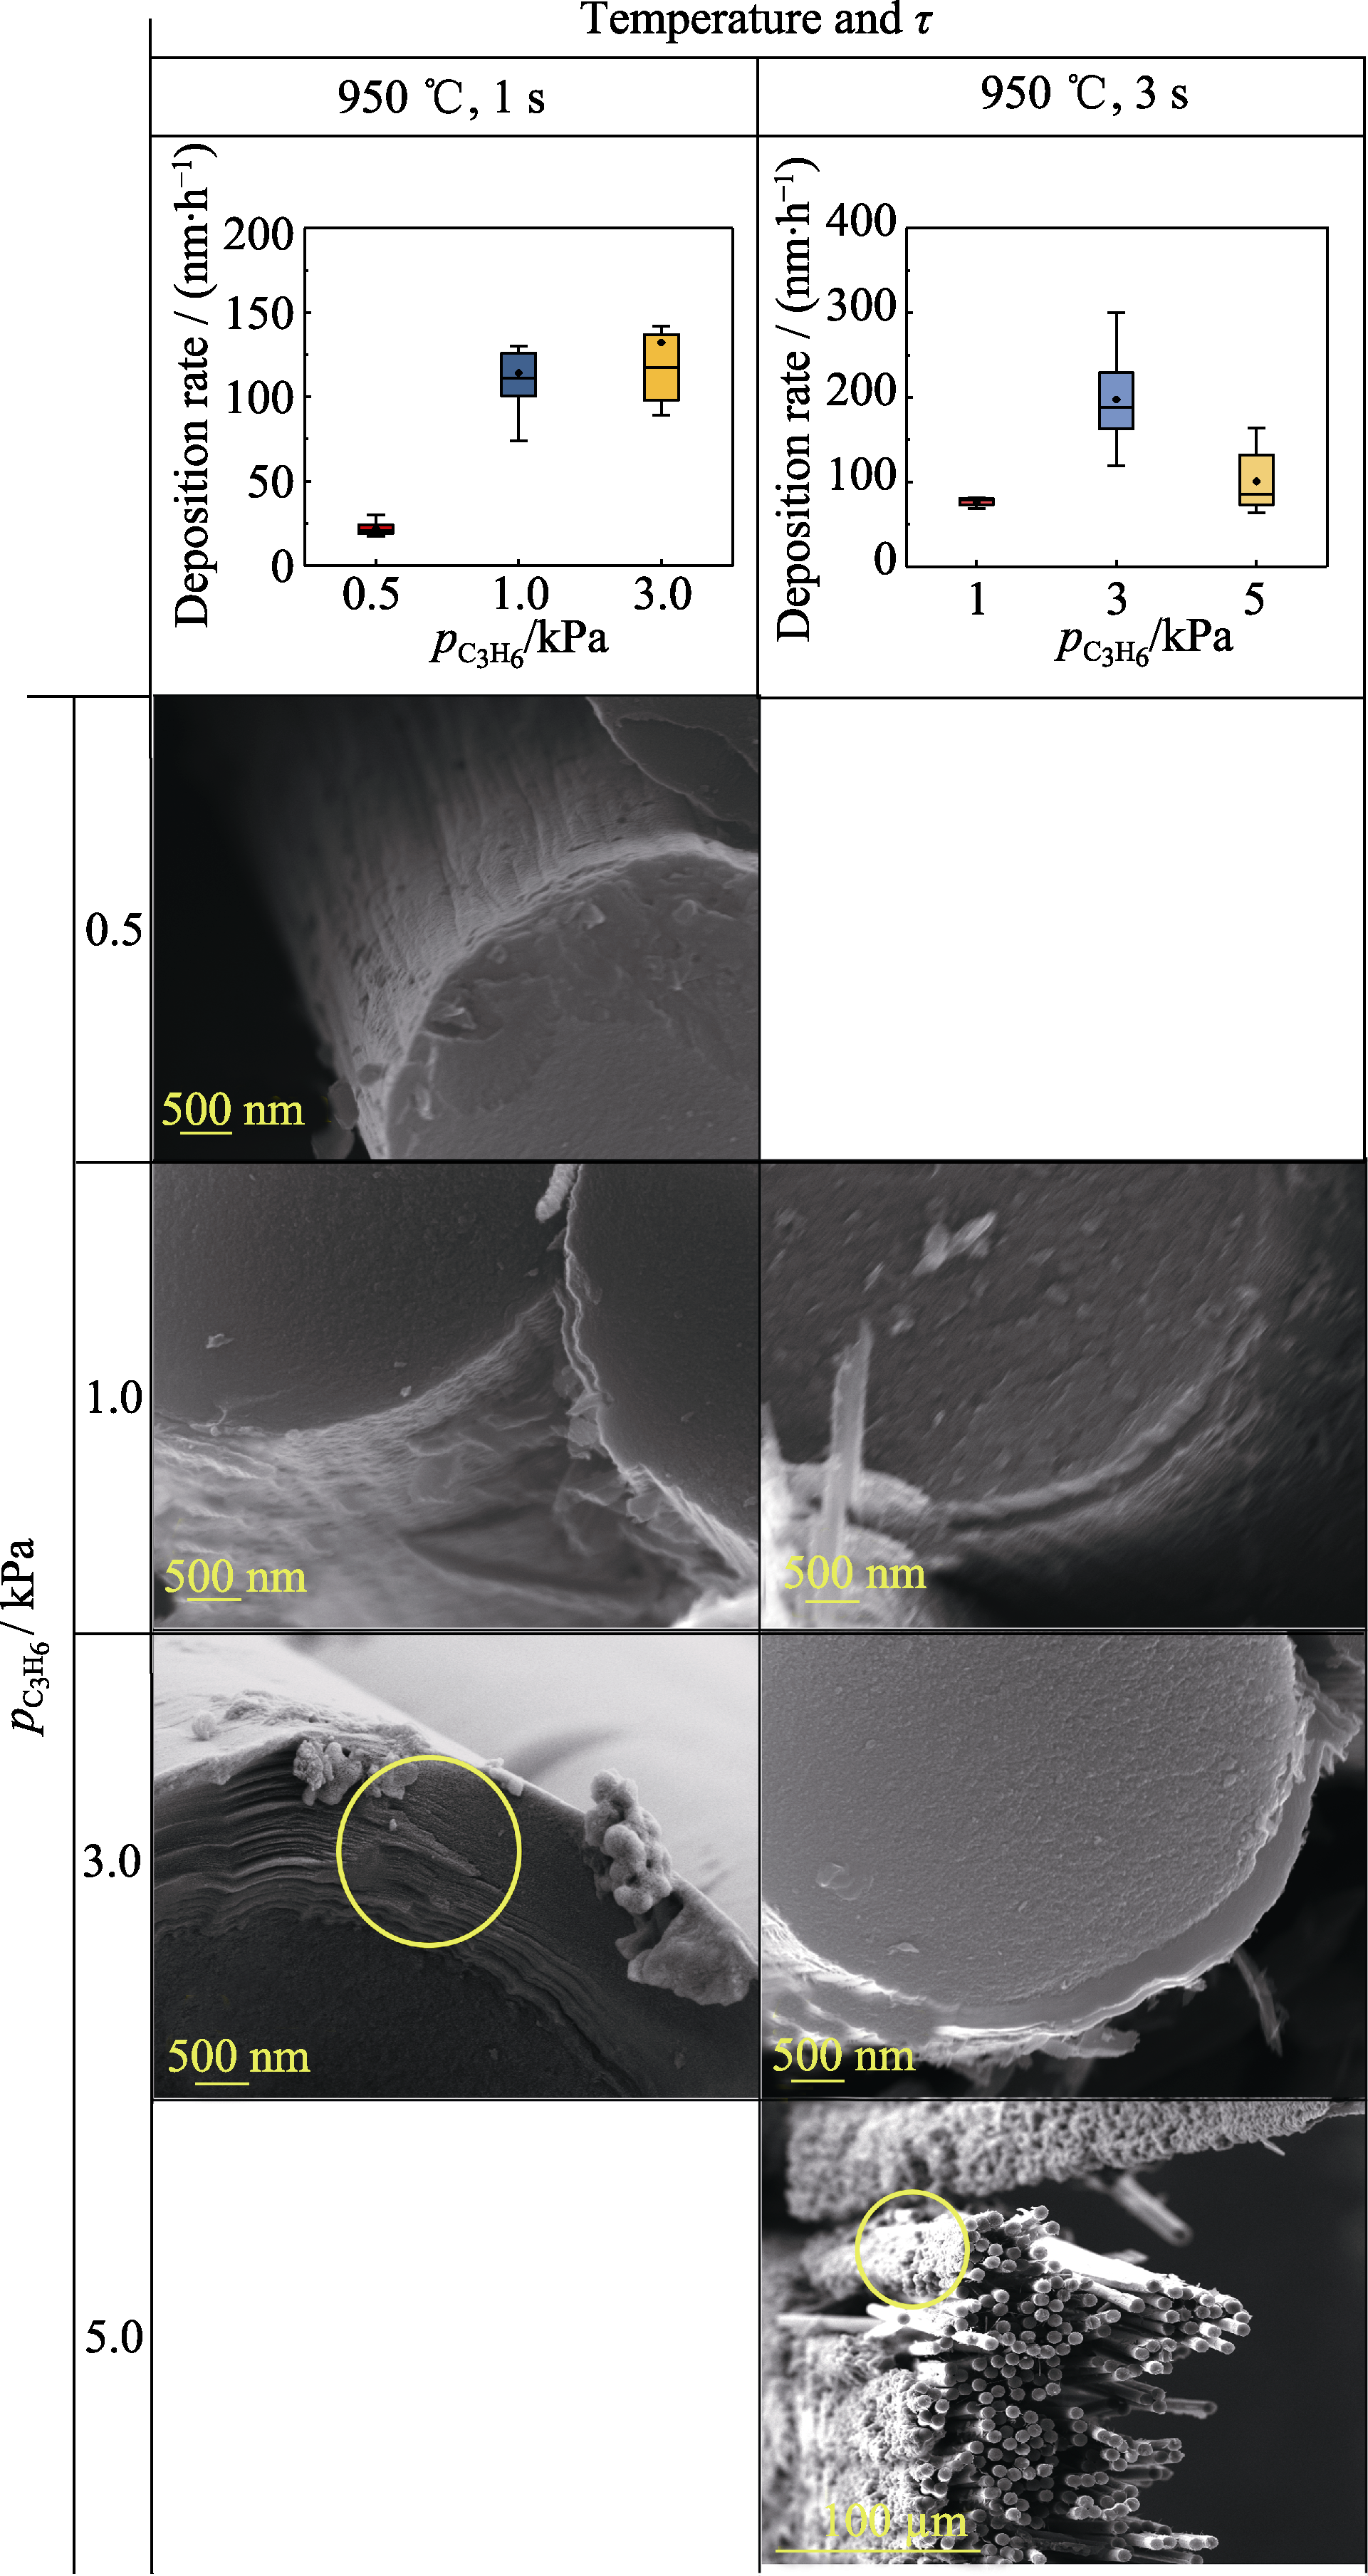
Fig. 7
Deposition rate, uniformity and typical SEM images of cross-section of PyC interphases at various
p
C3H6
Fig. 8
Deposition rate, uniformity and typical SEM images of cross-section of PyC interphases at various residence time
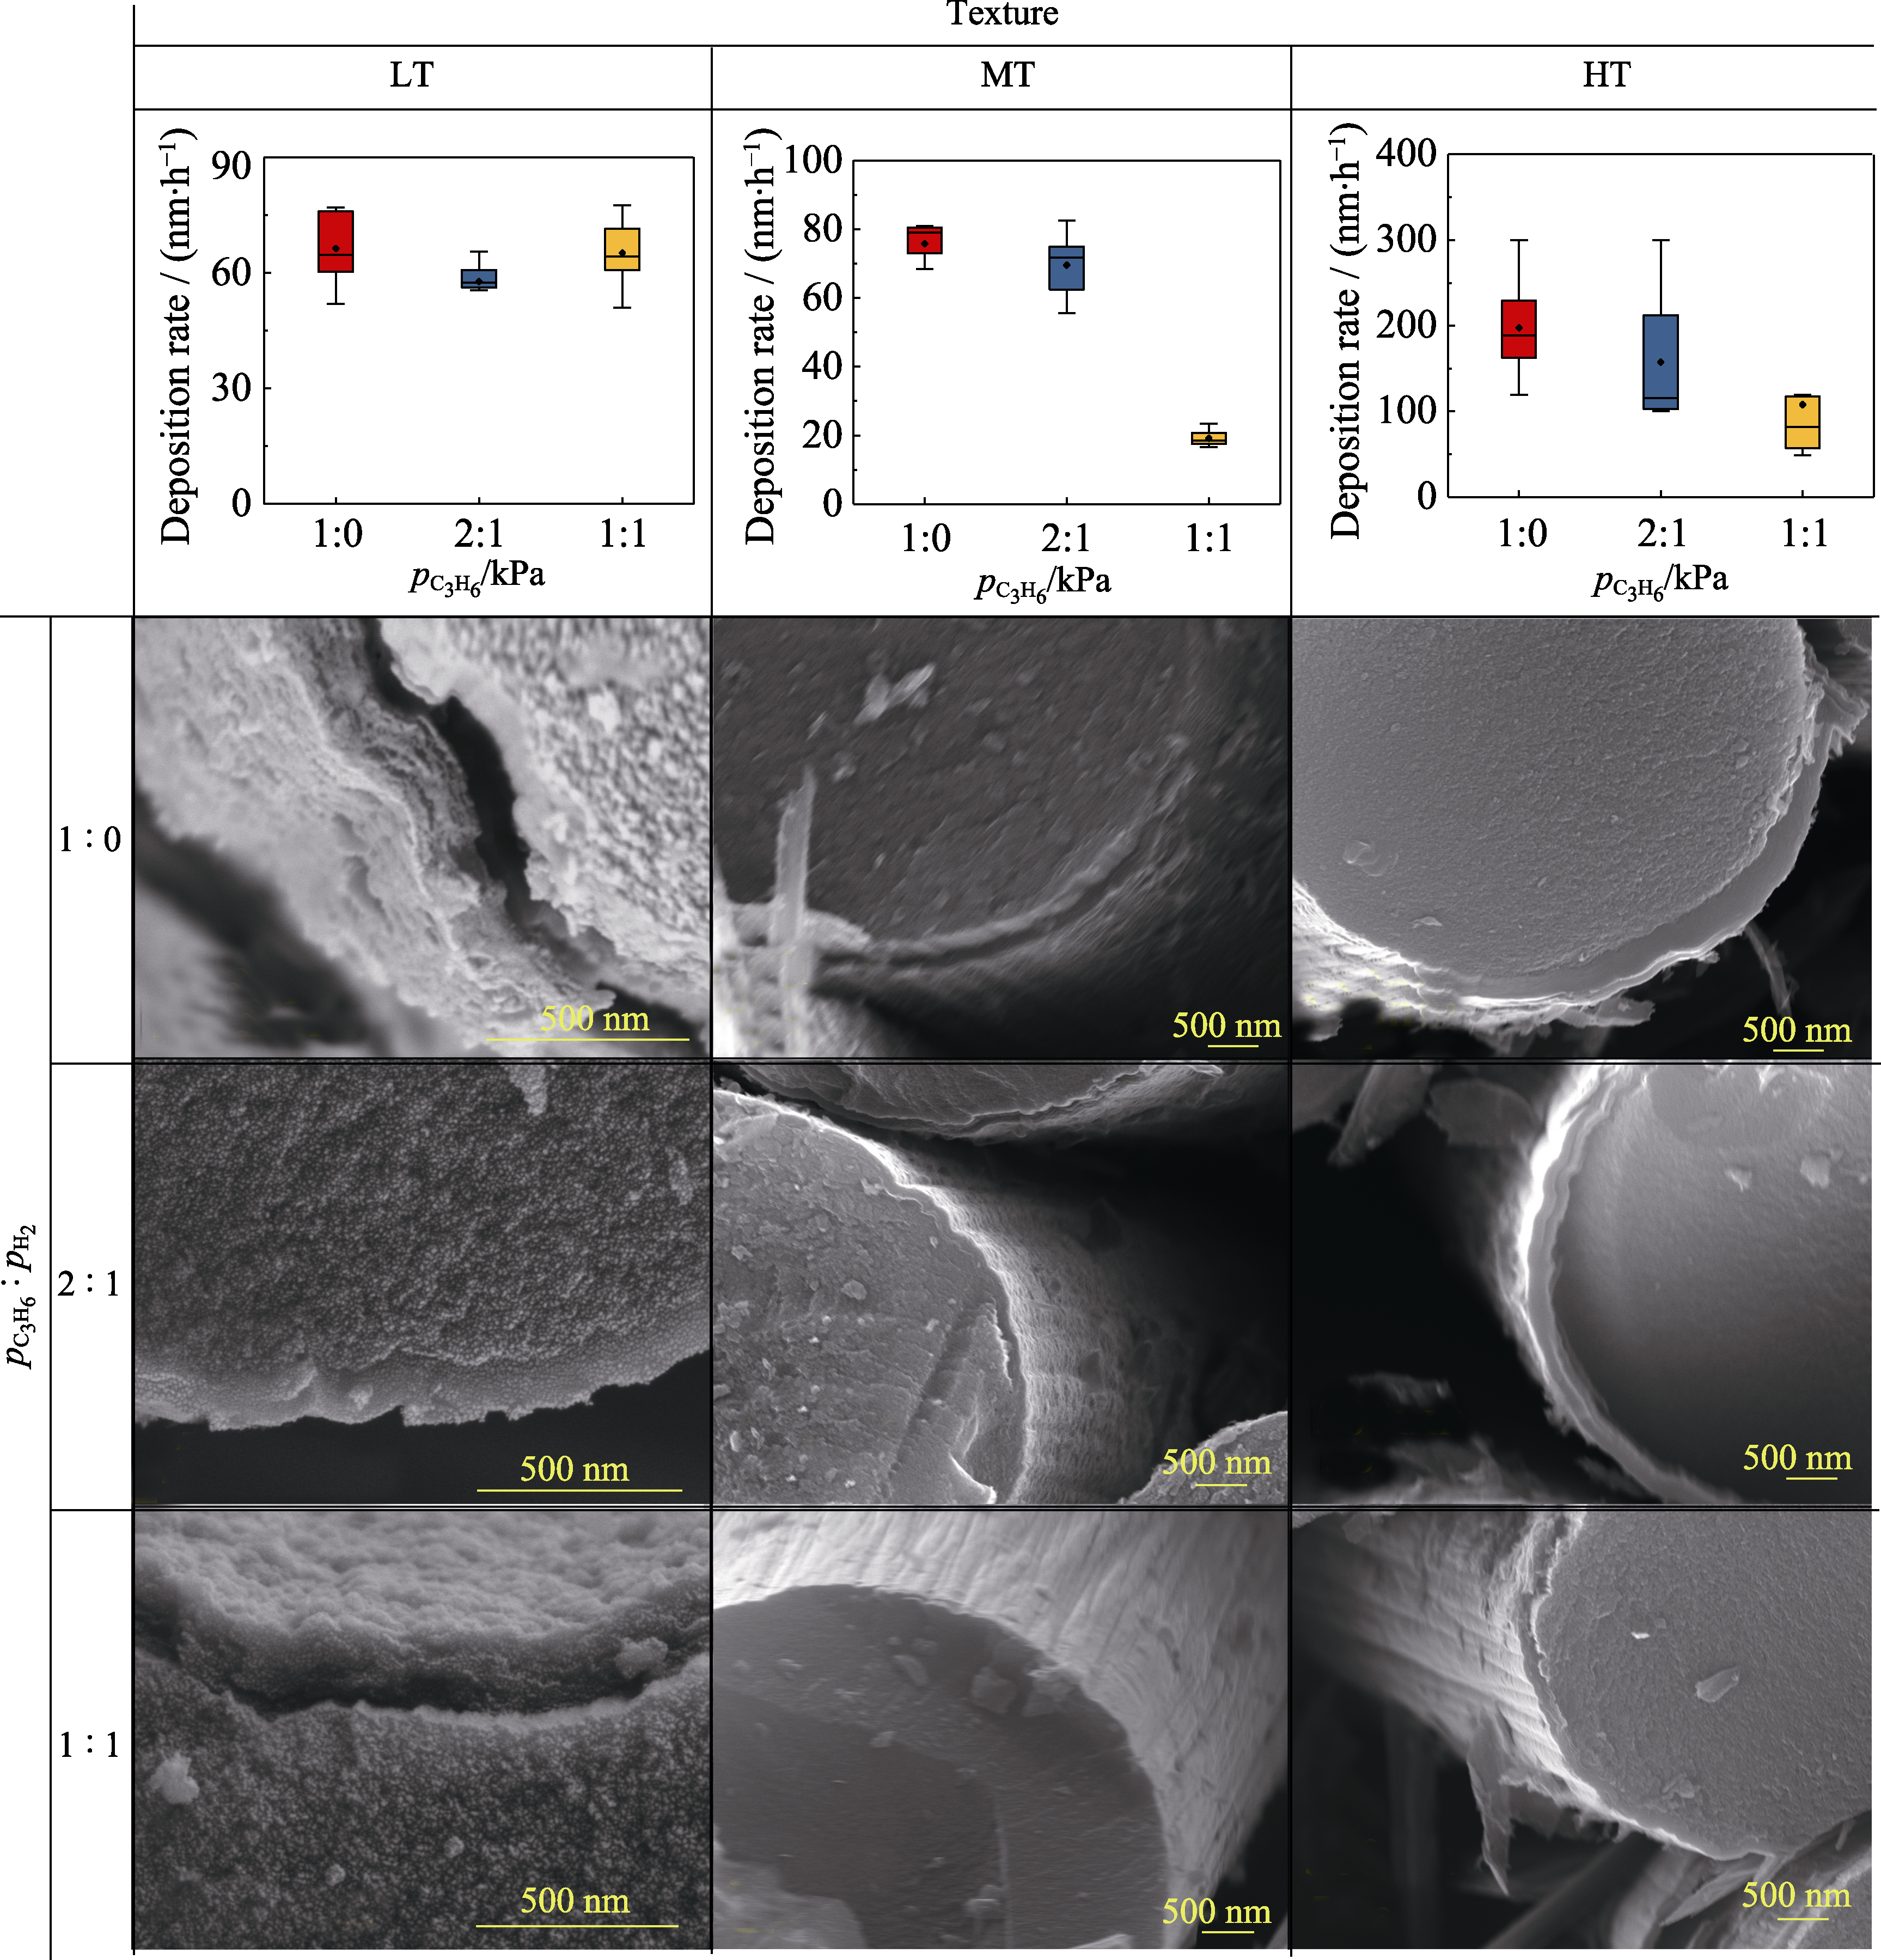
Fig. 9
Deposition rate, uniformity and typical SEM images of cross-section of PyC interphases at various
p
C3H6
:
p
H2
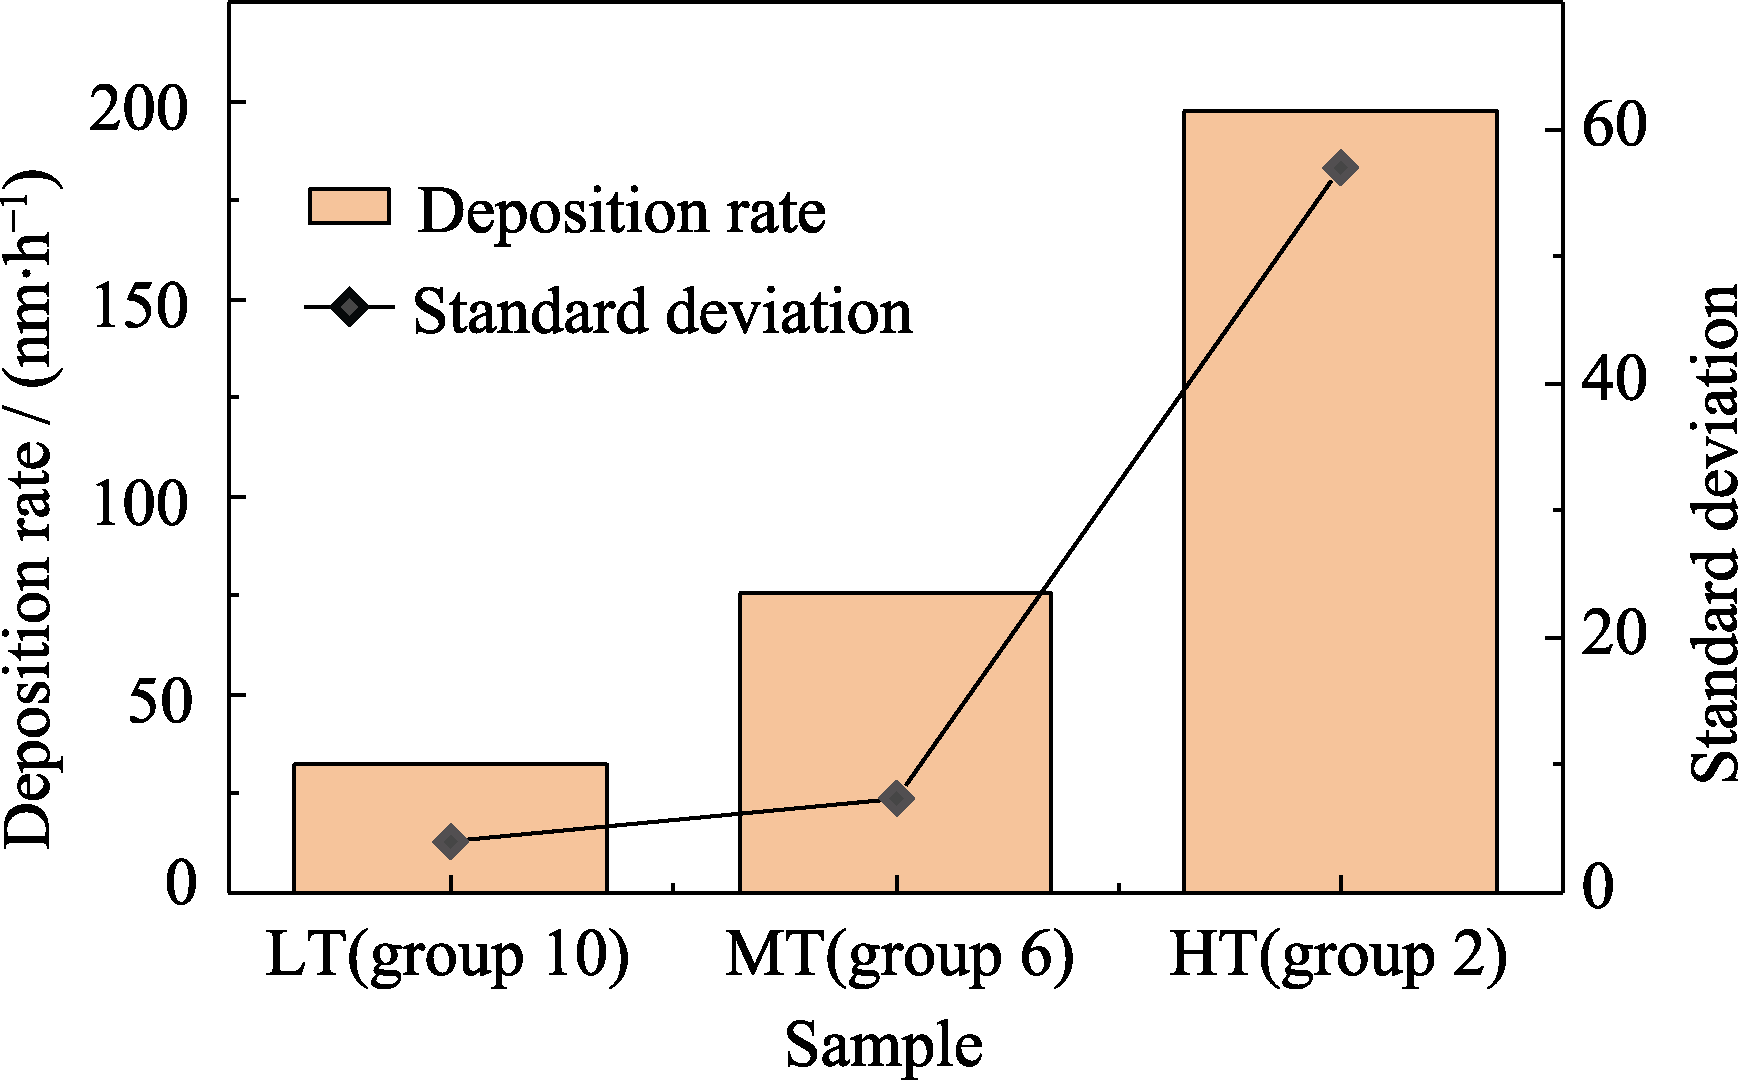
Fig 10
Relationship between interphase deposition rate, deposition uniformity and texture of PyC interphase
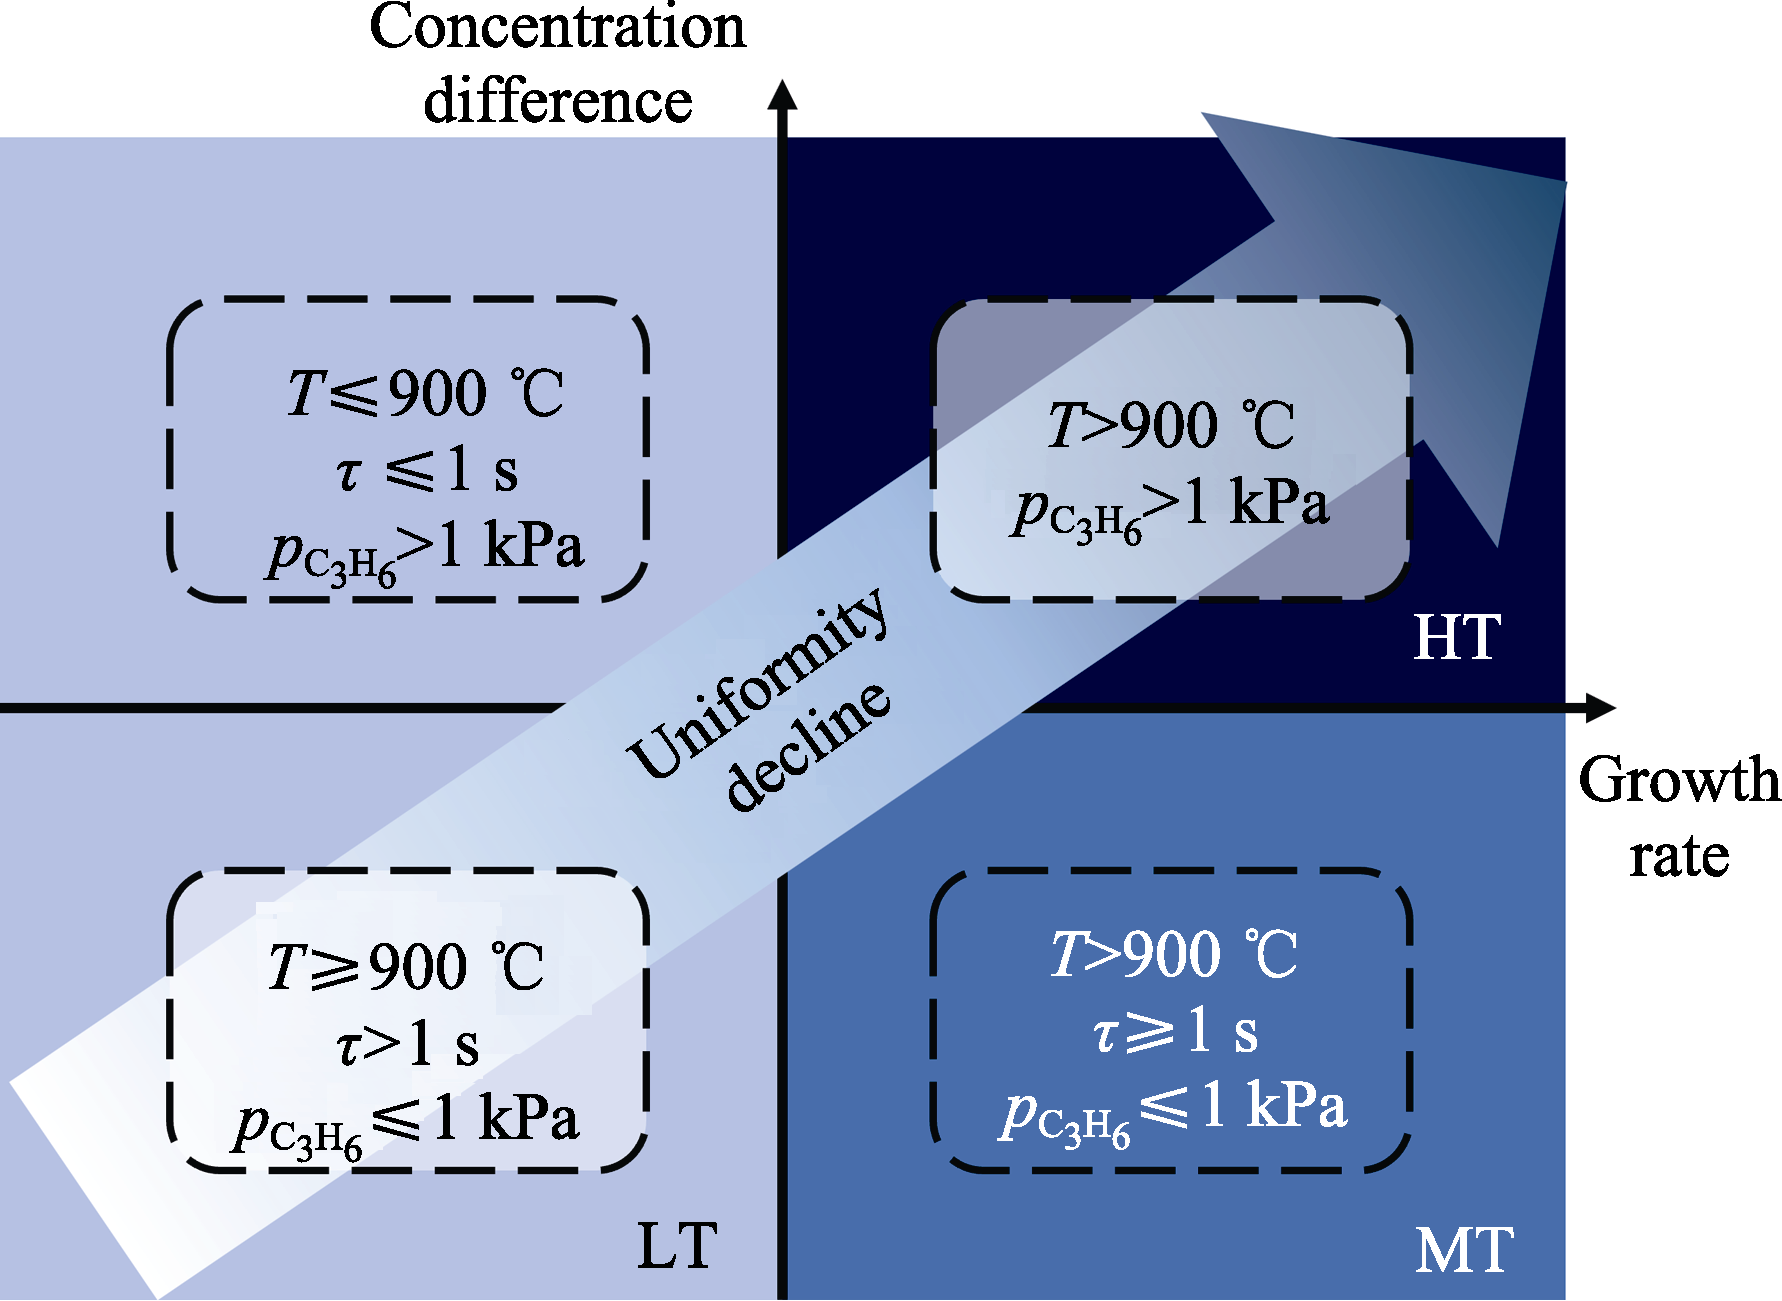
Fig. 11
Influence factors of interphase uniformity and their relations with process parameters
Fig. S1
Group 1 SEM images
Fig. S2
Group 2 SEM images
Fig. S3
Group 3 SEM images
Fig. S4
Group 4 SEM images
Fig. S5
Group 5 SEM images
Fig. S6
Group 6 SEM images
Fig. S7
Group 7 SEM images
Fig. S9
Group 9 SEM images
Fig. S10
Group 10 SEM images
Fig. S11
Group 11 SEM images
Fig. S12
Group 12 SEM images
Fig. S13
Group 13 SEM images
Fig. S14
Group 14 SEM images
Fig. S15
Group 15 SEM images
Fig. S16
Group 16 SEM images
Fig. S17
Group 17 SEM images
Fig. S18
Group 18 SEM images
Fig. S19
Group 19 SEM images
Fig. S20
Group 20 SEM images