
Numerical simulation investigation and geological guided inversion method research of electromagnetic wave resistivity instruments for LWD in anisotropic formations
Received date: 2024-04-23
Online published: 2025-03-13
Copyright
The electromagnetic wave resistivity logging tool for Logging While Drilling(LWD) is one of the most widely used logging tools in horizontal well development. However, the anisotropy of the formation and the distance between the surrounding rock and the boundary in the horizontal well environment can cause distortion in the electromagnetic wave resistivity measurement values, leading to the common problem of low drilling rate in the development of thin reservoirs. In this paper, taking the electromagnetic wave LWD resistivity tool of CNLC as an example, the numerical simulation method is used to investigate the instrument response law in the horizontal well formation, and the characteristic signals indicating the boundary distance and anisotropy of the formation are defined and quantified, and the combination of characteristic signals and classification inversion is used to realize the quantitative calculation of the anisotropy and multiple boundary distances of the conventional electromagnetic wave LWD resistivity tool in complex formations. The boundary distance, horizontal resistivity and vertical resistivity calculated by inversion are consistent with the changes in borehole trajectory, the response characteristics of logging curves and the formation occurrence information displayed by borehole imaging, which verifies the rationality of the method. This method is suitable for obtaining boundary distance, anisotropy and formation resistivity parameters from conventional LWD instruments, quantifies the boundary detection ability of conventional electromagnetic wave resistivity instruments, provides a new idea for precise geological guidance of thin-bedded and complex oil and gas reservoirs, and provides a technical method for the fine evaluation of post-drilling formations, and has great potential application value.
XiaoLei CHEN , BaoYin LIU , Jun ZHOU , ZhongQing ZHANG , ZhengZhi ZHOU , BaoHua MAO , Juan ZHANG , Yue WU . Numerical simulation investigation and geological guided inversion method research of electromagnetic wave resistivity instruments for LWD in anisotropic formations[J]. Progress in Geophysics, 2025 , 40(1) : 188 -198 . DOI: 10.6038/pg2025II0063
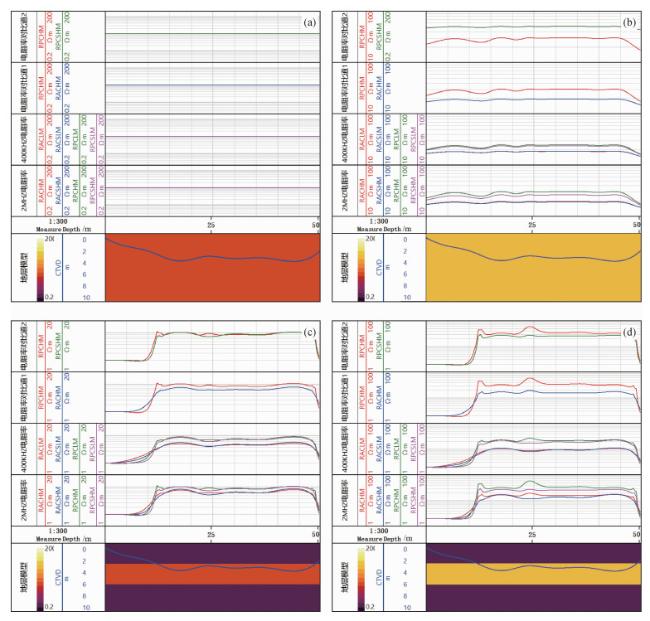
图3 不同环境条件下随钻电磁波电阻率测井响应对比(a)Rh=10 Ω · m, Rv=10 Ω · m;(b)Rh=10 Ω · m, Rv=50 Ω · m;(c)Rs=2 Ω · m, Middle layer Rh=Rv=10 Ω · m;(d)Rs=2 Ω · m, Middle layer Rh=10 Ω · m, Rv=50 Ω · m. Fig 3 Comparison of electromagnetic wave resistivity response of LWD under different environmental conditions |
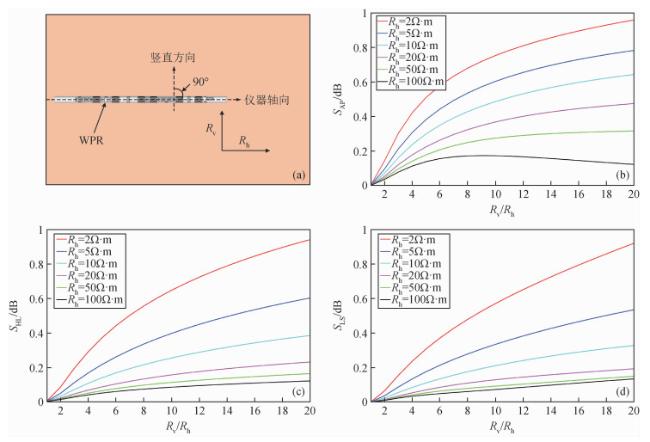
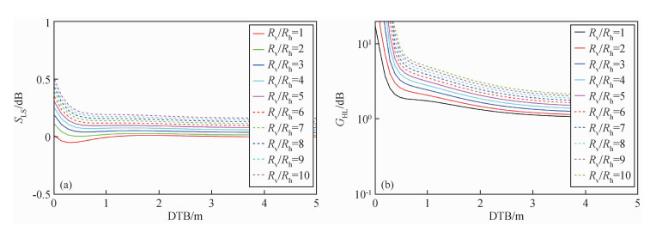
图4 各向异性指示信号随各向异性系数-电阻率变化(a)水平井地层模型示意图(各向异性Rv>Rh);(b)特征信号SAP随地层各向异性变化;(c) 特征信号SHL随地层各向异性变化;(d)特征信号SLS随地层各向异性变化. Fig 4 Anisotropy indicator signal changes with anisotropy coefficient resistivity (a)Horizontal well formation model (anisotropy Rv>Rh); (b)Feature signals SAP vary with layer anisotropy; (c)Feature signals SHL vary with layer anisotropy; (d)Feature signals SLS vary with layer anisotropy. |
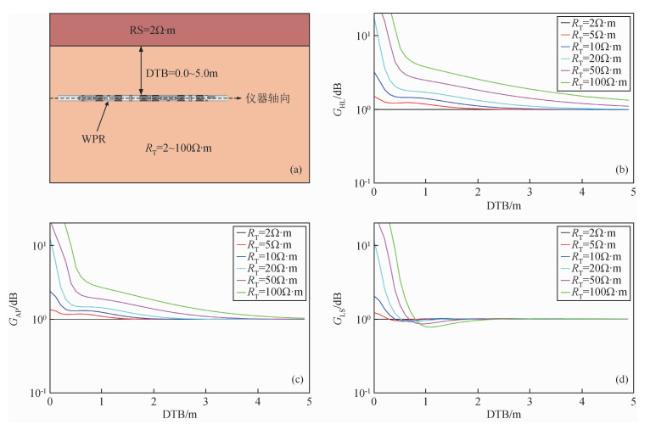
图5 边界距离特征信号随边界距离变化(a)水平井边界距离影响考察模型示意图;(b)特征信号GHL随边界距离变化;(c) 特征信号GAP随边界距离变化;(d)特征信号GLS随边界距离变化. Fig 5 Boundary distance feature signal variation with boundary distance (a)Model for the Influence of Horizontal Well Boundary Distance; (b)Feature signals GHL vary with boundary distance; (c)Feature signals GAP vary with boundary distance; (d)Feature signals GLS vary with boundary distance. |
感谢审稿专家提出的修改意见和编辑部的大力支持!
|
Bittar M, Klein J, Beste R, et al. 2007. A new azimuthal deep-reading resistivity tool for geosteering and advanced formation evaluation. //Proceedings of the SPE Annual Technical Conference and Exhibition. Anaheim: SPE.
|
|
Bittar M, Wu H H M, Ma J, et al. 2020. First LWD fully triaxial co-located antenna sensors for real-time anisotropy and dip angle determination, yielding better look-ahead detection. //Proceedings of the SPWLA 61st Annual Logging Symposium. Virtual: SPWLA, 2020.
|
|
Clegg N, Parker T, Djefel B, et al. 2019. The final piece of the puzzle: 3-D inversion of ultra-deep azimuthal resistivity LWD data. //Proceedings of the SPWLA 60th Annual Logging Symposium. The Woodlands: SPWLA.
|
|
|
|
|
|
|
|
Lofts J, Deady R, Johnston S. 2005. Technical and commercial LWD challenges for service companies in crossing multidisciplinary boundaries. //Proceedings of the SPWLA 46th Annual Logging Symposium. New Orleans: SPWLA.
|
|
|
|
|
|
|
|
Thiel M, Bower M, Omeragic D. 2017. 2D reservoir imaging using deep directional resistivity measurements. //Proceedings of the SPWLA 58th Annual Logging Symposium. Oklahoma City: SPWLA.
|
|
|
|
|
|
|
|
|
|
|
|
|
|
|
|
|
|
|
|
|
|
|
|
|
|
|
|
|
|
|
|
|
|
|
|
|
|
|
|
|
|
|
/
| 〈 |
|
〉 |