
Received date: 2024-11-06
Online published: 2025-05-09
Copyright
To address the limitations of conventional empirical formula-based pore pressure prediction methods in engineering practice, such as high dependency on velocity, numerous required empirical parameters, and significant human influence, this study proposes an intelligent pore pressure prediction model based on eXtreme Gradient Boosting (XGBoost). By incorporating the ratio of actual P-wave velocity to the normal compaction trendline as a feature parameter in model training, the prediction accuracy and generalization capability of pore pressure are significantly improved. Furthermore, an enhanced method is introduced, which replaces the normal compaction trendline with the Dv curve for pore pressure prediction, effectively mitigating the computational complexity and subjectivity associated with establishing the normal compaction trendline. The effectiveness of this improved method is also validated across other machine learning regression models. The results demonstrate that the proposed intelligent pore pressure prediction model and its enhanced method exhibit high prediction accuracy and generalization ability, providing efficient and reliable data support for drilling safety. This approach holds significant engineering application value and broad prospects for future use.
Key words: Pore pressure; Machine learning; XGBoost; Normal compaction trend; Dv curve
Bing ZHANG , XiaoTing WANG , FuYing XU , YuJia QIN , ZhiQian WANG . Research on pore pressure prediction method based on XGBoost[J]. Progress in Geophysics, 2025 , 40(2) : 541 -555 . DOI: 10.6038/pg2025JJ0121
表1 特征参数组合Table 1 Combination of characteristic parameter |
| 组合类型 | 特征参数 |
|---|---|
| 特征参数组合1 | Vp\Rho\GR |
| 特征参数组合2 | Vp\Rho\GR\P_Hydro |
| 特征参数组合3 | Vp\Rho\GR\P_Hydro\div_Vp_NC |
| 特征参数组合4 | Vp\Rho\GR\P_Hydro\div_Dv |
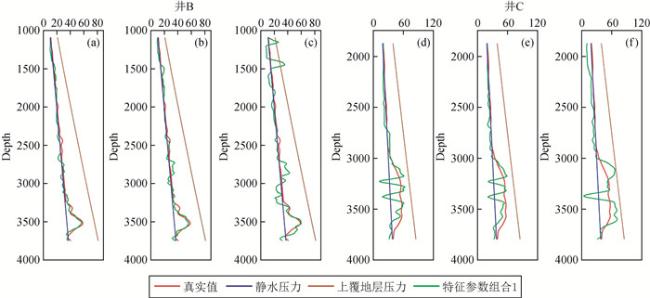
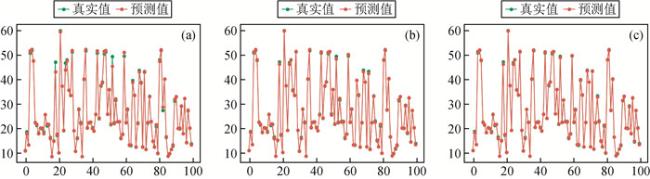
图6 不同机器学习算法在特征参数组合1下的孔隙压力预测结果(a)(d) RF;(b)(e) XGBoost;(c)(f) LSTM. Fig 6 Pore pressure prediction results of different machine learning algorithms under feature parameter combination 1 |
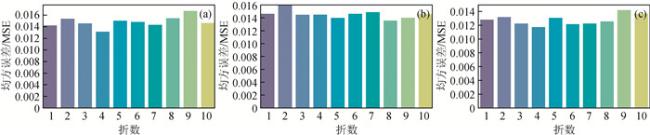
图11 超参数优化均方误差对比(a)特征参数组合2;(b) 特征参数组合3;(c) 特征参数组合4. Fig 11 MSE for different hyperparameter optimization (a) Combination 2;(b) Combination 3;(c) Combination 4. |
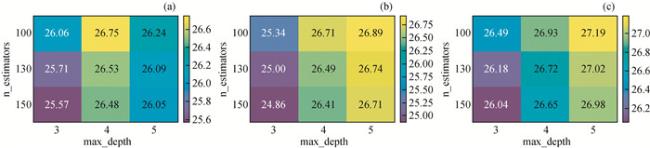
表2 超参数优化结果Table 2 Results of hyperparameter optimization |
| 组合类型 | 弱学习器数量[100, 130, 150] | 最大树深[3, 4, 5] | 学习率[0.05, 0.1, 0.15] | 采样比例[0.6, 0.8, 1.0] |
|---|---|---|---|---|
| 特征参数组合2 | 150 | 3 | 0.1 | 0.8 |
| 特征参数组合3 | 150 | 3 | 0.15 | 0.8 |
| 特征参数组合4 | 150 | 3 | 0.15 | 0.8 |
表3 测试集孔隙压力预测结果评价Table 3 Evaluation of test set pore pressure prediction results |
| 算法模型 | 决定系数 | 均方根误差 | 平均绝对误差 | 平均相对误差/% | ||||||||||||
|---|---|---|---|---|---|---|---|---|---|---|---|---|---|---|---|---|
| 组合2 | 组合3 | 组合4 | 组合2 | 组合3 | 组合4 | 组合2 | 组合3 | 组合4 | 组合2 | 组合3 | 组合4 | |||||
| 测试集 | RF | 1.0000 | 1.0000 | 1.0000 | 0.0407 | 0.0405 | 0.0403 | 0.0158 | 0.0161 | 0.0159 | 0.05 | 0.05 | 0.05 | |||
| XGBoost | 0.9999 | 0.9999 | 0.9999 | 0.1204 | 0.1145 | 0.1063 | 0.0877 | 0.0821 | 0.0799 | 0.36 | 0.35 | 0.35 | ||||
| LSTM | 0.9996 | 0.9999 | 0.9999 | 0.2773 | 0.1596 | 0.1307 | 0.2220 | 0.1154 | 0.0903 | 0.86 | 0.46 | 0.34 | ||||
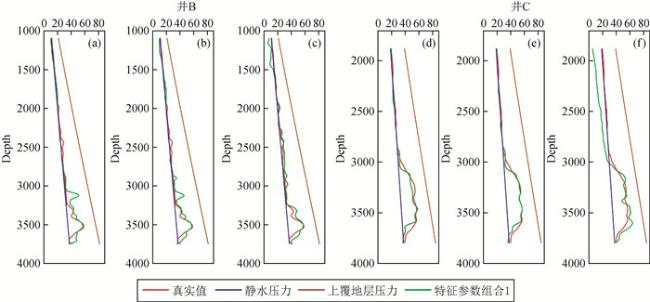
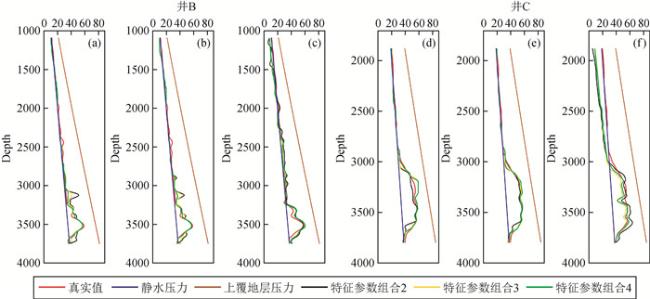
图13 井B、井C孔隙压力预测结果对比(a)(d) RF;(b)(e) XGBoost;(c)(f) LSTM. Fig 13 Comparison of pore pressure predictions for wells B and C |
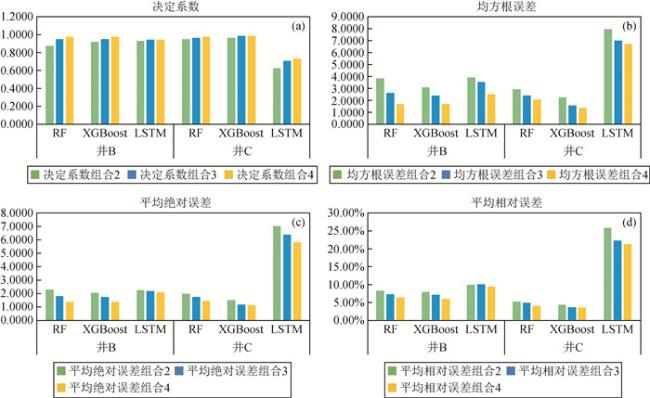
图14 井B、井C孔隙压力预测结果评价Fig 14 Evaluation of pore pressure prediction results for wells B and C |
表4 井B、井C孔隙压力预测结果评价Table 4 Evaluation of pore pressure prediction results for wells B and C |
| 算法模型 | 决定系数 | 均方根误差 | 平均绝对误差 | 平均相对误差/% | ||||||||||||
|---|---|---|---|---|---|---|---|---|---|---|---|---|---|---|---|---|
| 组合2 | 组合3 | 组合4 | 组合2 | 组合3 | 组合4 | 组合2 | 组合3 | 组合4 | 组合2 | 组合3 | 组合4 | |||||
| 井B | RF | 0.8778 | 0.9519 | 0.9763 | 3.8843 | 2.6662 | 1.7182 | 2.3344 | 1.8629 | 1.4331 | 8.36 | 7.28 | 6.48 | |||
| XGBoost | 0.9216 | 0.9522 | 0.9768 | 3.1101 | 2.4286 | 1.6928 | 2.0887 | 1.8002 | 1.4062 | 7.96 | 7.20 | 6.09 | ||||
| LSTM | 0.9288 | 0.9468 | 0.9471 | 3.9649 | 3.5636 | 2.5550 | 2.3055 | 2.2391 | 2.1194 | 9.98 | 10.15 | 9.45 | ||||
| 井C | RF | 0.9493 | 0.9654 | 0.9747 | 2.9469 | 2.4349 | 2.0801 | 2.0236 | 1.7892 | 1.4857 | 5.32 | 4.88 | 4.08 | |||
| XGBoost | 0.9686 | 0.9854 | 0.9881 | 2.2971 | 1.5795 | 1.4253 | 1.5688 | 1.2114 | 1.1721 | 4.43 | 3.62 | 3.59 | ||||
| LSTM | 0.6279 | 0.7108 | 0.7345 | 7.9811 | 7.0364 | 6.7413 | 7.0645 | 6.4210 | 5.8316 | 25.87 | 22.33 | 21.37 | ||||
感谢审稿专家提出的修改意见和编辑部的大力支持!
|
|
|
Ajibola O T, Sheng J, McElroy P, et al. 2022. Machine learning applications for reservoir pressure trend prediction in potash area of Delaware basin. //SPE/AAPG/SEG Unconventional Resources Technology Conference. Houston, Texas, USA.
|
|
|
|
Bowers G L. 2001. Determining an appropriate pore-pressure estimation strategy. //Offshore Technology Conference. Houston, Texas.
|
|
|
|
|
|
Eaton B A. 1975. The equation for geopressure prediction from well logs. //Fall Meeting of the Society of Petroleum Engineers of AIME. Dallas, Texas.
|
|
|
|
|
|
|
|
|
|
|
|
|
|
|
|
|
|
|
|
|
|
|
|
|
|
|
|
Wang M X, Østmo S, Munkvold O P N. 2025. Machine-assisted 4D seismic interpretation. //4D Forum—Insight to Actions: A Global Forum. Galveston, Texas: Society of Exploration Geophysicists, 135-138.
|
|
|
|
|
|
|
|
|
|
|
|
|
|
|
|
|
|
|
|
|
|
|
|
|
|
|
/
| 〈 |
|
〉 |